In this SSRS Report Builder tutorial, you’ll learn how to use the Expression Builder to format headers and add titles to each page in your paginated report.
The Expression Builder allows you to apply conditional formatting on specific elements in your report. You can also use this to create “expressions”. Expressions help you control the content, design, and interactivity of your paginated report.
Method #1: Format Column Headers In SSRS Report Builder
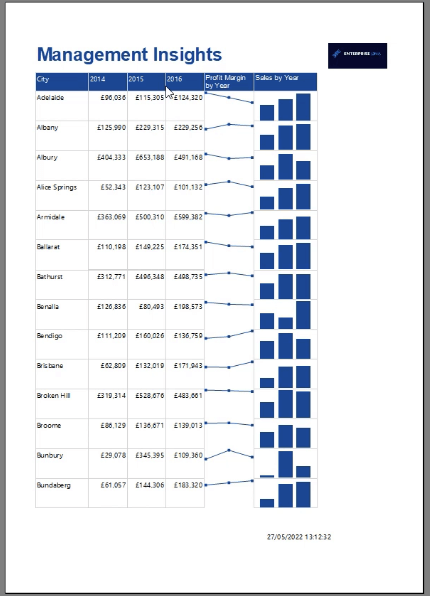
In this example, notice that the year columns don’t show any insight to the data they contain. They only contain the year and don’t indicate the specific data they’re showing.
To fix this, you can add another column header to the tablix. Right-click on your tablix header and then select Insert Row > Inside Group Below.
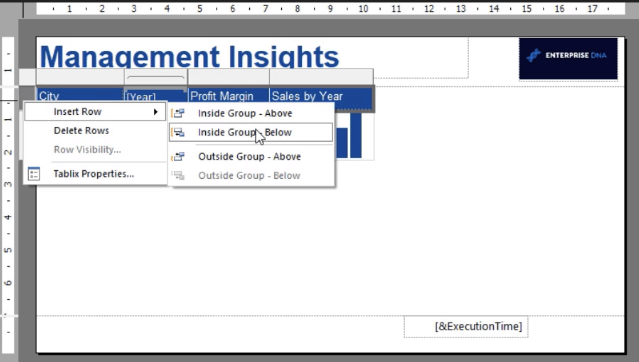
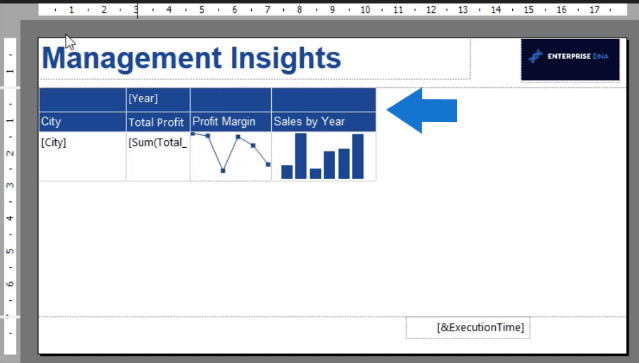
This adds another row below your current column header. Format the headers to your desired column names.
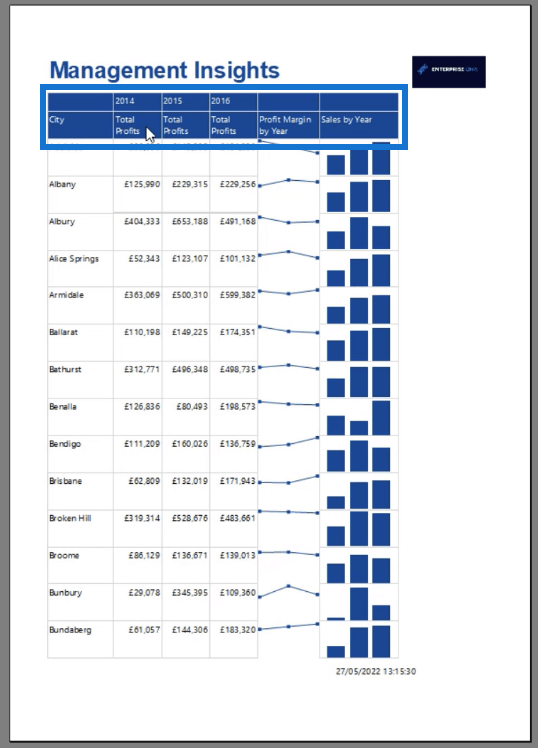
When you Run your report, you’ll see that the column headers look significantly better than the first example. At a first glance, you understand that the Year columns provide information on the Total Profits.
Method #2: Format Column Headers In SSRS Report Builder
Another way to add more insight to the Year columns is by using the Expression Builder.
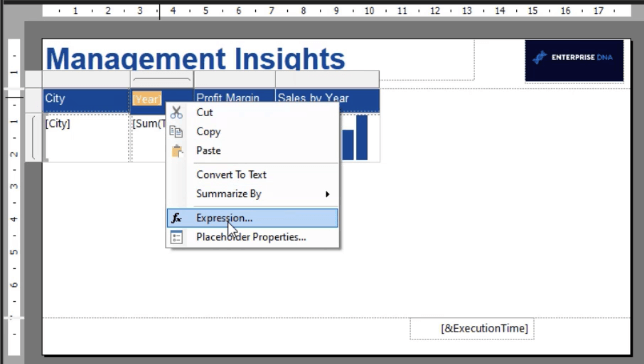
To open the Expression Builder window, right-click on the Year header and select Expression.
In the expression textbox, write & “ Profits”.
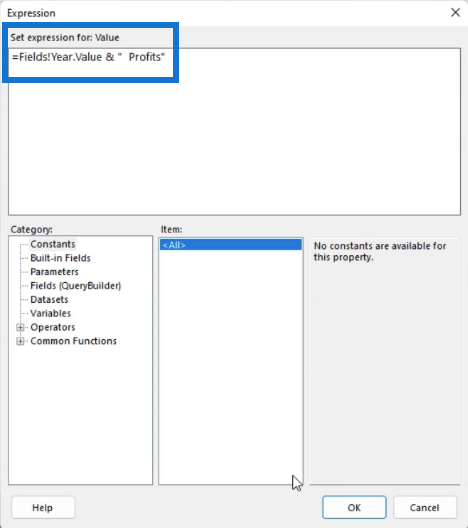
The ampersand (&) works similar to how you’d use it in Excel; it joins words together. So instead of just the Year, the column header will show “Year Profits” (example: 2016 Profits).
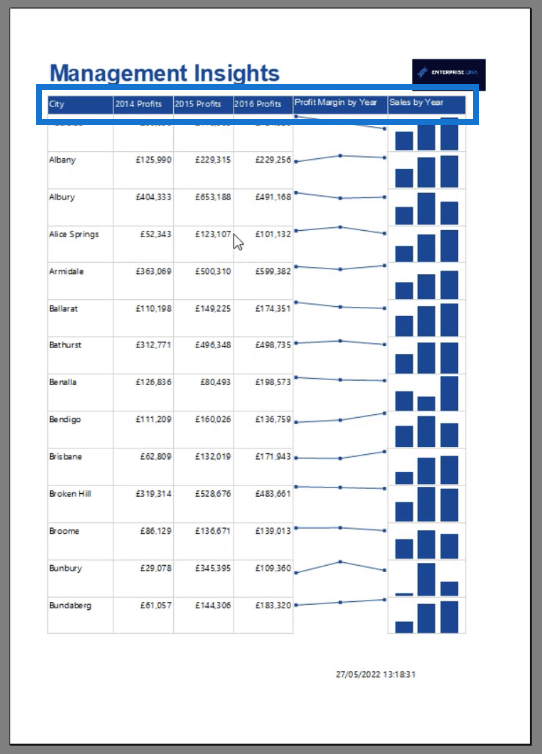
When you Run the report, you’ll see that the column headers give a clearer picture of what the report is about.
Add Headers To Each Page
In the Run view, you can see that only the first page contains the column header. The succeeding pages only show the values.
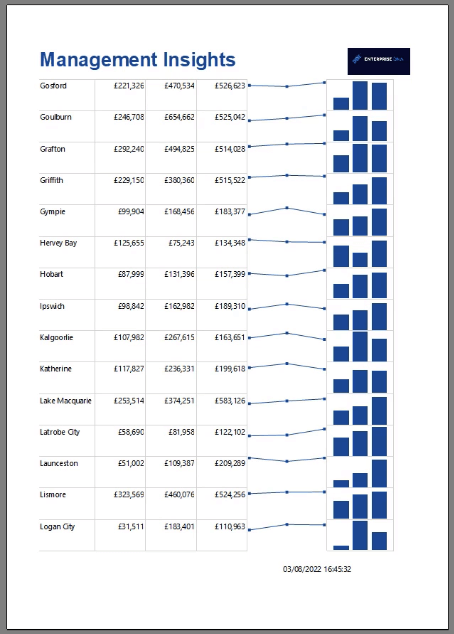
When creating reports, you need to make sure that appropriate titles and column headers can be found on each page. This eliminates confusion and helps end users easily grasp the content of the report.
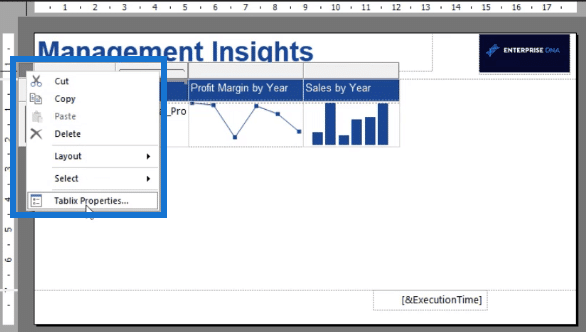
To fix this, go back to the Design view. Click the tablix and then right-click on the gray square found on the upper left corner. Click the Tablix Properties option.
Under the General tab in the Tablix Properties window, you can see options for the Column Headers. Click the check box to enable the Repeat header columns on each page option.
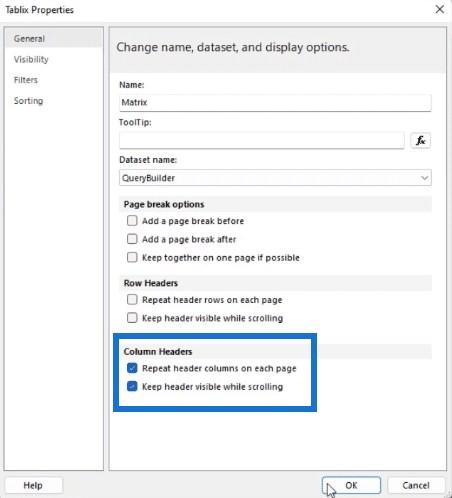
You can also opt to enable the Keep header visible while scrolling option. This feature is similar to freezing panes in Excel.
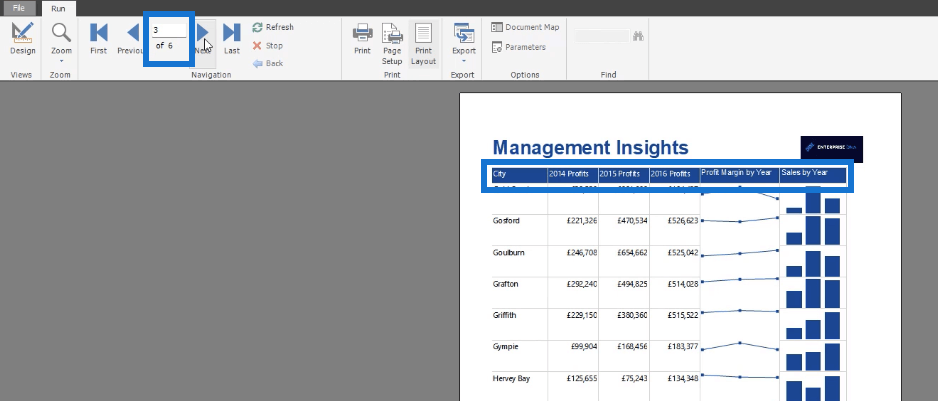
When you Run the report again, you can see that each page now contains column headers.
Publish The Paginated Report
Once you’re satisfied with your work, you can then publish it to the Power BI Service or export it as a PDF.
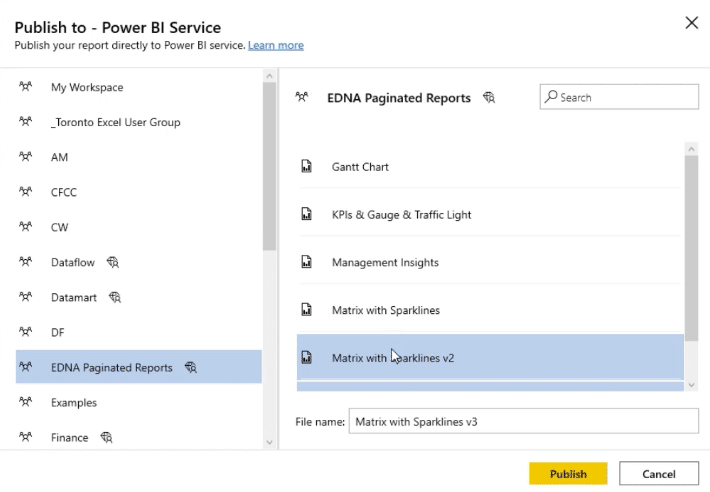
To publish a paginated report, click the Publish option found in the Home tab.

You can only publish paginated reports using premium Power BI Service accounts. This is denoted by the diamond icon.
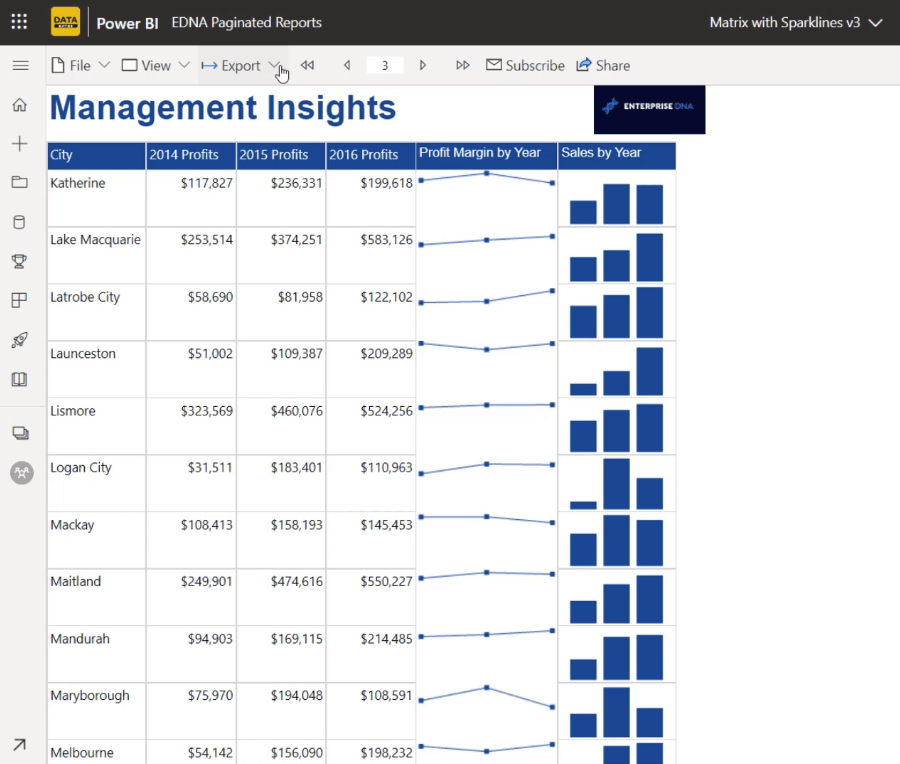
To check, open your report in the Power BI Service app. You can see that the title and column header remain the same even when you flick through the pages.
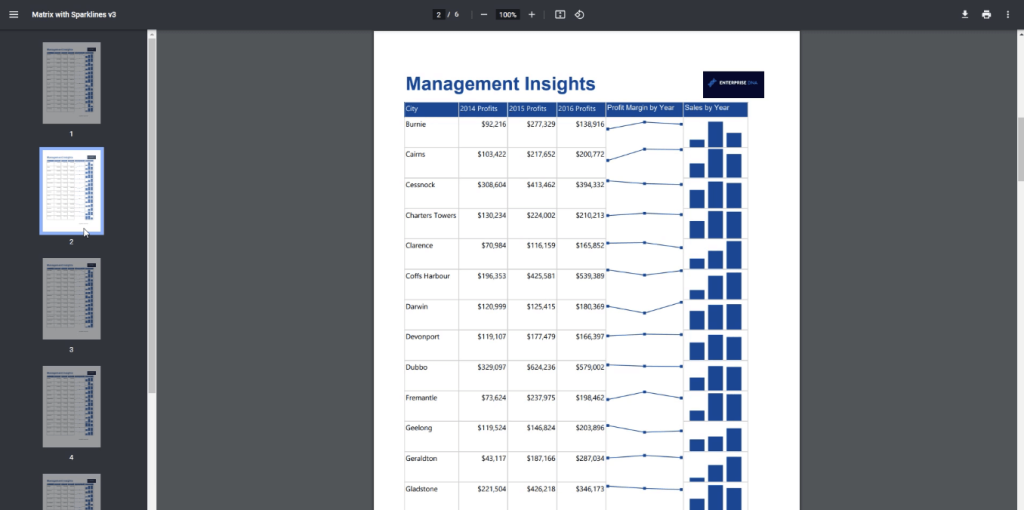
When you export the report as a PDF, you can also see that each page contains the title and column header.
***** Related Links *****
Power BI Navigation Tips
How To Create A Dynamic Header & Footer In Paginated Reports
Power BI Data Visualization Technique: Creating A Dynamic Heading Or Title
Conclusion
In this tutorial, you learned how to format the column headers in your paginated reports.
Column headers help end users understand what the data in the table is about. So it’s a best practice to show the headers in each page in your paginated report. This is especially useful when you want to export your report as a PDF.
In the case of reports published in the Power BI Service, you need to keep the header visible while scrolling. This helps end users understand what the data is about even as they scroll through the rest of the page.
All the best,
Sue Bayes


