
In today’s blog post, I will discuss how to create a smooth and flowing navigation experience when viewing a dashboard. I personally treat Power BI navigation as a complex set of various buttons with different purposes and applications.
This is a continuation of my series on developing report transparency. You can check out the first installment where I talk about layout design here.

Four Types Of Power BI Navigation
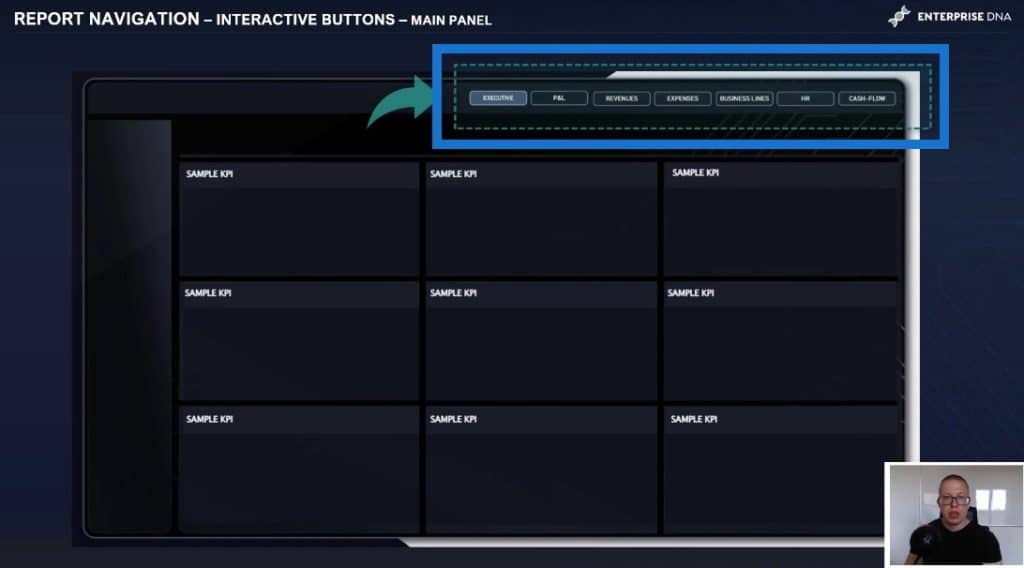
There are four types of navigation. The main pane navigation gives you access to the major sections or objects of analysis. This is the type of navigation you will notice on this particular presentation page.
A perfect example of this would be navigation buttons that switch pages from a revenue analysis to a digital expenses analysis or a switch from an analysis of an income statement to a report of operational volume-based data.
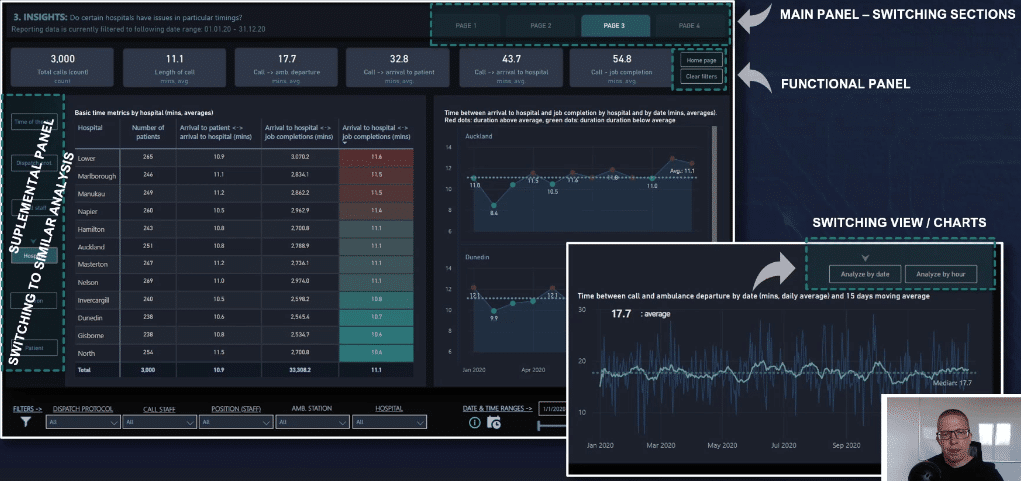
In addition, you can use supplemental navigation, which brings you to parallel analysis within the same section. For example, you analyze operational expenses in the overall view, and then you switch to a payroll analysis or show expenses by department.
You may also have additional buttons that change the way of visualizing one particular piece of data. For example, switching between a stack bar chart and a tabular view or switching between revenue analysis by type or business line to revenues by contractor or invoices. It could also be a button that navigates you to the same chart with different metrics.
However, in most cases, it’s more efficient to address such transitions by using DAX formulas such as the SWITCH function or by using newly added field parameters.
And finally, we have functional navigation, which gives you additional control over your report pages, including features like returning to the homepage, returning to any previously used page, resetting all the current filters, and returning to the default state in terms of filter selection and visualization settings.
There’s also the drill-through navigation, which allows you to drill down to a specific point or category of data to another page with detailed analysis.

Effective Navigation Placement
All these types of navigation help you to effectively structure and locate navigation panes with buttons in the right place on your report.
As you can see on this page, the main navigation pane was placed in the upper middle right section of the report. This is an effective navigation placement because it reflects the eye’s natural move from the most important sections on the left to the different sections on the right.
This is a form of storytelling and allows the end user to navigate naturally from left to right. Placing your main pane to the left is also a great way to locate your main buttons.
The location generally depends on a couple of factors, but one of them is the count of given sections in your report, which determines the final number of single buttons applied within the navigation pane.
On this particular page, you can see an example of placing two different kinds of navigations side by side. Buttons that serve different destinations will be placed right near the specific visualizations to give an easy-to-understand message. The application of those buttons will impact the visual but not the others.
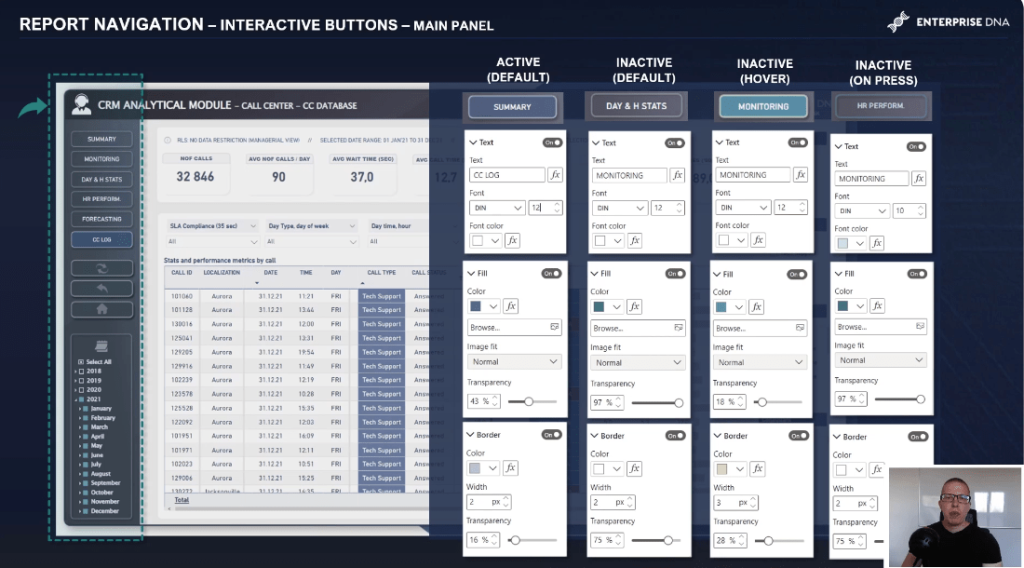
If we look closely at the main navigation pane, we’ll notice that within a particular report page, one button is in active mode and visually distinguishable from the other buttons, which are inactive. As you can see on the right, there are some different settings applied to the different states of buttons.
While setting and customizing navigation is more important than precise numbers or percentages for given states, there are some general rules that if applied, can greatly improve the user experience.
Make your active button the most visible part of the navigation pane.
This will depend on the color of the background that is displayed behind the button.
Aim for applying a visible filling along with a light border if you’re using darker layouts. If you use a lighter background, select a border that visibly wraps around the button to distinguish it from the surrounding background. Two pixels with a border work fine in most cases.
All remaining inactive buttons should have more blending fill, which can be achieved by setting a high level of transparency.
The font color is important here and should be light enough to make an impression of not being active yet. But at the same time, it must give the impression that it is clickable.
If we are to darken the font colors for inactive buttons, they will appear to be incapable of navigating to different sections.
After that, the crucial part is to apply the right effect during the hover state. For this particular case, I used a solid background in a blue-green color scheme and a thicker border to make the impression that the button is ready to use.
You can also make some adjustments to phone type and phone size, like making the buttons bolded in hover mode. However, I find it to be distracting so I take a more implicit approach here.
The visual effects when clicking on the button are not a crucial step because the duration of clicking the button when navigating to another page is marginal. The effect is not visible. However, setting the font size to be a little bit smaller than the default size in hover mode works very well.

3 Workarounds For Supplemental Navigation
Supplemental navigations are used for navigating to a similar analysis. I will highlight three different ways to set navigation that is similar to a web application.
Obviously, we can apply a default bookmark or a page navigator which is a new feature in Power BI, but I prefer some workarounds to make this more remarkable.
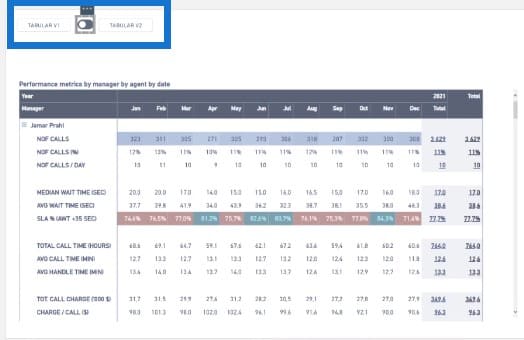
The first solution is to include a simplistic button with the double changeable tool. The second solution is just like the first option which uses two buttons without separate borders but with an additional icon that points out the selected page. The third option is to use both formatted buttons and the icon which is the optimal solution.
Now let’s dive into the pbix file to show you how you can easily set up a simplistic first solution with toggles. Let’s say you have two different tables. You’ll need two visuals, two separate buttons, and two toggles.
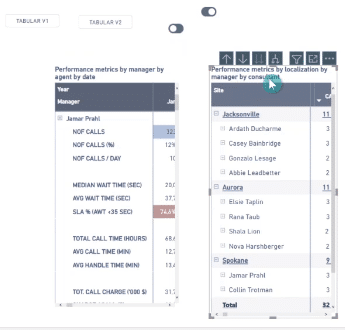
Since this is our first table, we will leave out the toggle (which indicates the left choice) and hide the other toggle (which indicates the right choice).
We will move two different objects, which are the images at the top, in order to have more control and hide one of them in this scenario.
In the second scenario, we will turn off the first table and turn on the second table. We will create another bookmark and program this particular button to navigate to the second bookmark.
Now we have ready-to-use navigation that we can use to move from one view to another.
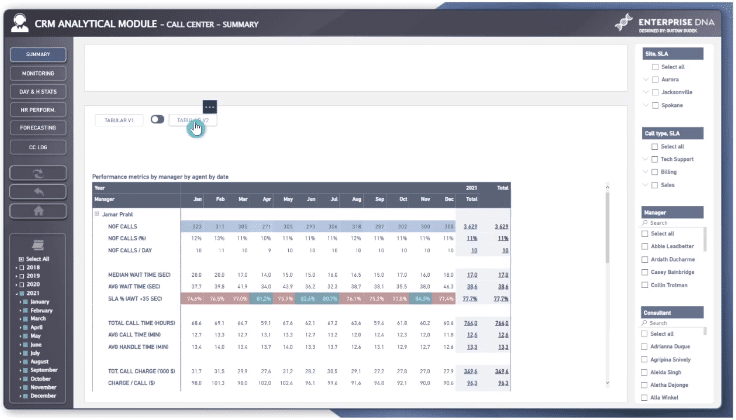
And now we come back to our presentation to see a quite unique way to incorporate supplemental navigation. The main idea behind the application is to create an artificial drill-through effect that is operating based on metrics rather than on data categories.
Let me show you in practice how quickly and effectively we can adjust the report view depending on what we actually want to analyze.
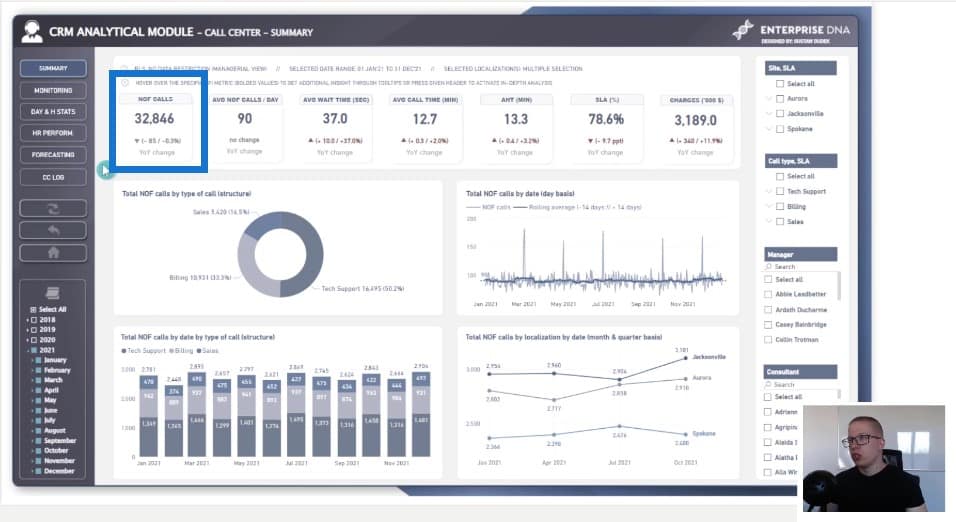
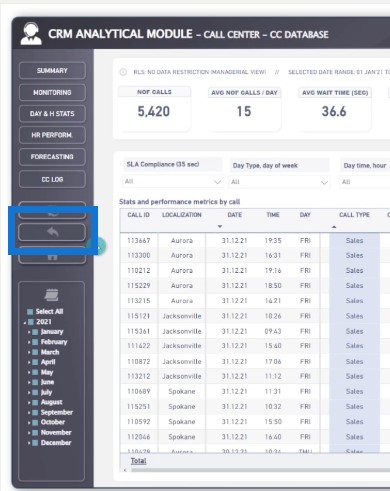
We have here the summary page where we can actually structure the navigation. This gives us the ability to move to different views depending on the metrics we would like to analyze. By clicking on the headers, we can change the particular visualization.
In terms of technical execution, we can just group the four different visuals according to the names of particular measures. The moment we click on the Number of Calls bookmark, we activate that specific bookmark and hide all the different grouped objects that do not belong to the Number of Calls.
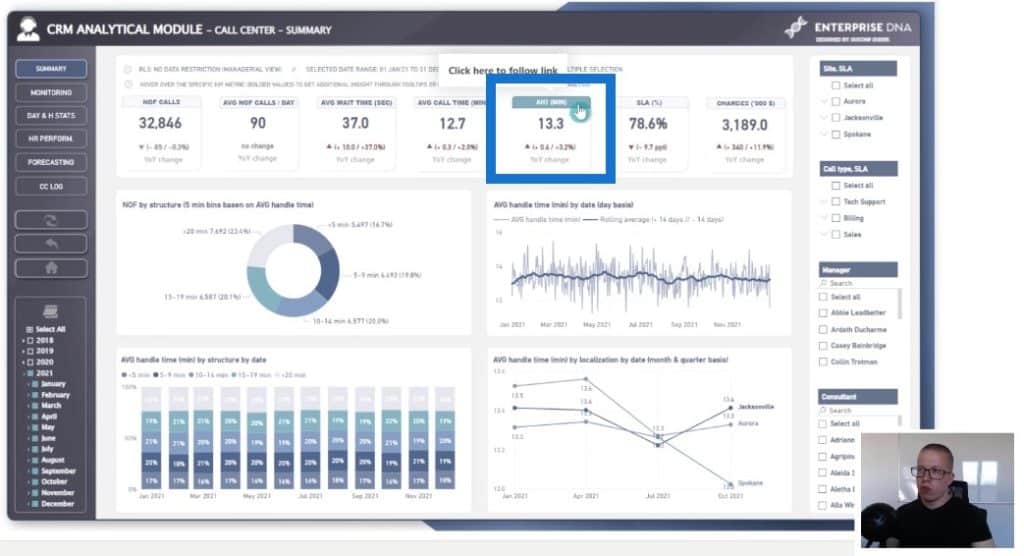
And inversely, if we would like to analyze the average handling time in minutes, we can unhide only this specific visualization and then hide all the others.
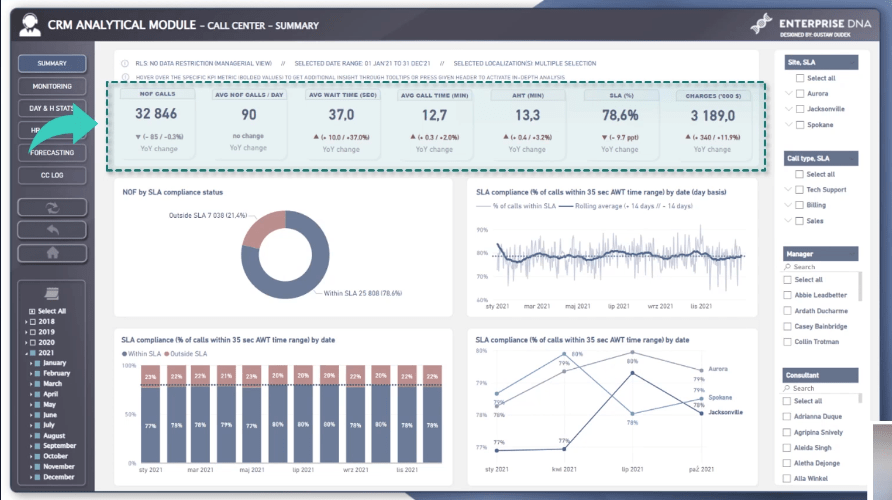
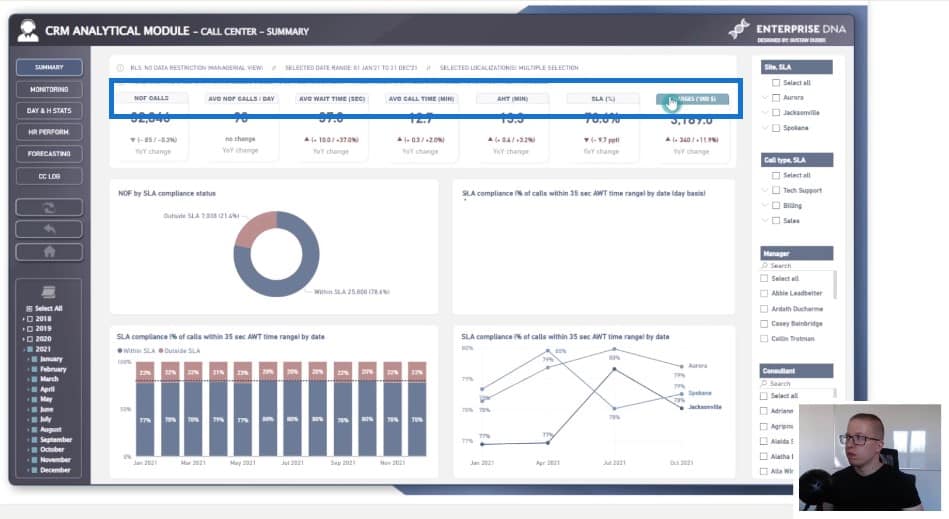
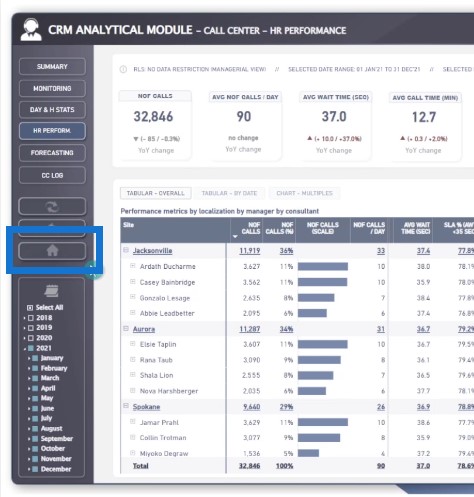
Then we have an example of a functional pane that gives the end user additional control over report pages.
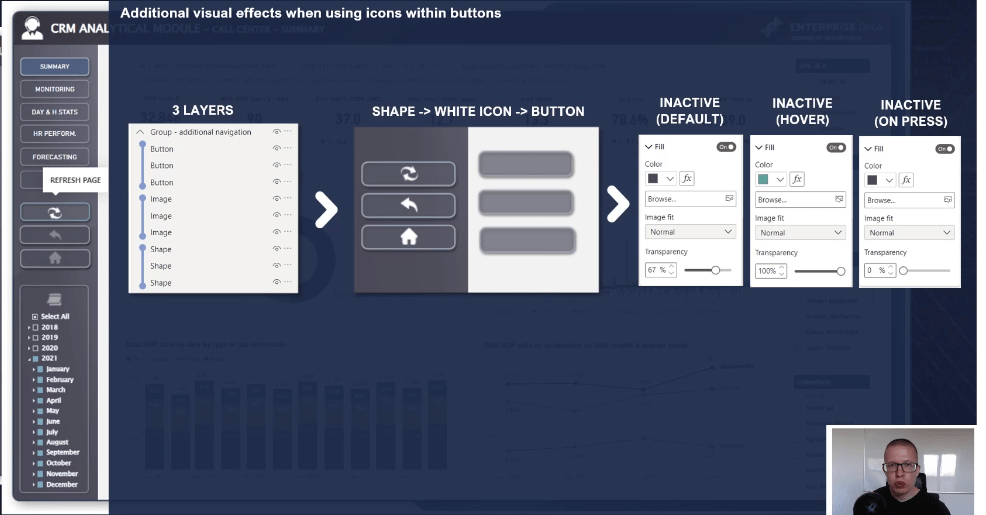
This includes the refresh button, back button, and homepage button. As you can see, there are icons within the buttons to give the end user the feeling of activating different navigation.
Ideally, the icon should also be changed to some extent when hovering over the given button. This can be achieved by setting three layers of objects. Shapes like rounded rectangles, for example, are placed on the button, icons are placed in the middle, and buttons are placed on top.
The uppermost object (which is the button) is set to semi-transparent in the full state. It makes the middle object (which is the icon slightly grayed out) indicate the inactivity of the button. After hovering, the upper object button is set to fully transparent, which unlocks the original icon’s look.
Overall, we go from a button with a grayed-out icon to a button with a lighter-colored icon, which looks like it has been activated.
Let me show you how this functional navigation works when using Power BI reports. For example, we’ve made some choices according to some specific filters. We can restore all the information and all the views to the default state with just one click back to the default state.
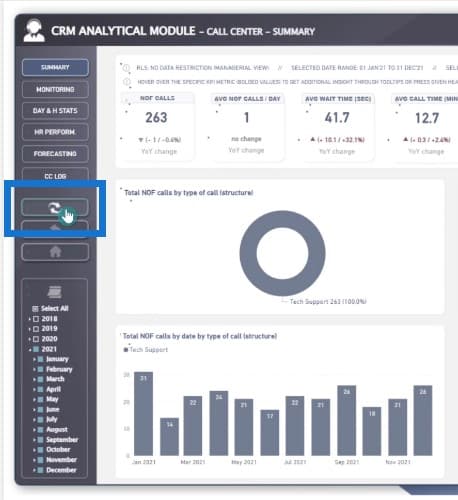
On the other hand, if you would like to go back to the previous page, you can just use the second button to help you navigate back to it.

And finally, if you want to come back to the homepage, you can achieve that by clicking the homepage button.
Collapsing And Expanding Effect
In terms of button navigation, I would like to present one more possible application that can be both effective from an analytical standpoint and useful in terms of report design. I’ll show you how buttons and navigation can be used to modify visualizations by triggering a collapsing and expanding effect.
I will show you how you can apply the effect of expanding and collapsing in some visuals like tables or charts.
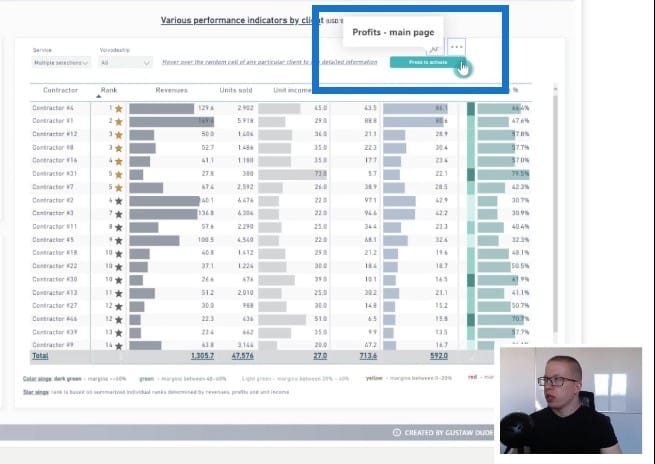
By clicking one button, you can see that we partially collapsed the table to reveal another kind of chart, which in this particular case is the line chart showing trends (the bottom chart).
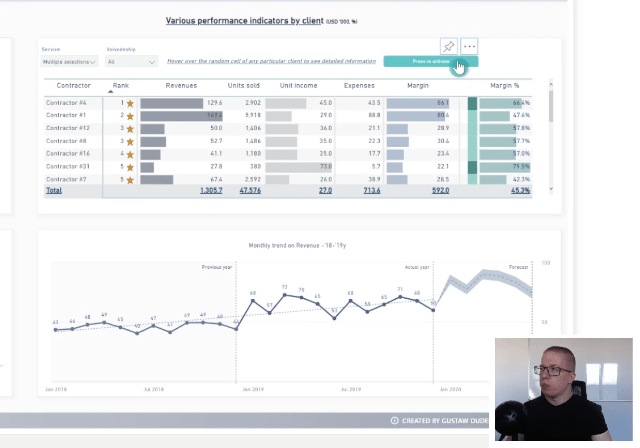
The cool thing here is that we can select multiple contractors, and we can immediately get information about revenues and profits on the line chart.
Using Custom Visuals
I would like to point out two additional visuals that are worth mentioning. These visuals are unavailable in the default Power BI visual pane, but you can always download them from the marketplace.
These are the Chiclet Slicer and Hierarchy Slicer. If you prefer to focus on the visual aspects of your reports, these slicers can correspond with the other navigation buttons because they have a lot of formatting options in the formatting pane.
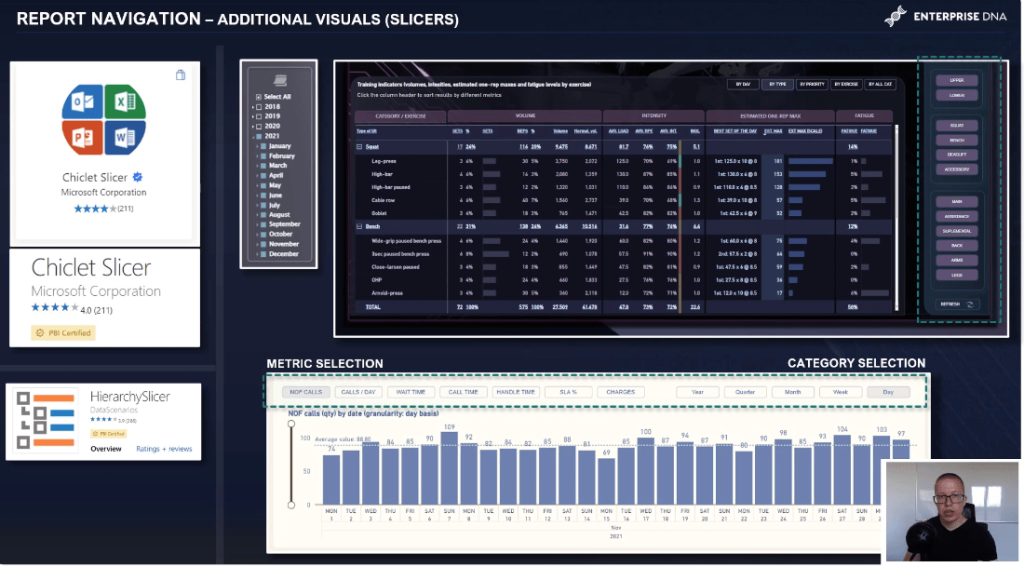
Generally, the Chiclet Slicer works well when selecting or filtering categorical data or switching metrics. You can set features like rounded edges, use a different color when hovering the button, and change the color of backgrounds for the active and inactive buttons.
The downsides, however, include the inability to change font type, no option to have one additional button with all selected options, and a significant loading time compared to native slicers.
The second one, which is the Hierarchy Slicer, also has great features like the ability to adjust the color of activated categories, which is really helpful when designing dark layout reports.
The main downside, however, is having only the drop-down mode and the significant loading time. Nevertheless, both options are worth testing when creating portfolios, demo reports, and client reports.
***** Related Links *****
High-Quality Power BI Report Navigation Experience
Power BI Interactive Reports: Navigation And Bookmarks
Power BI Page Navigation Updates, Tutorial, & Review
Conclusion
In this blog post, we have discussed different solutions for page navigation in Power BI reports. Having great navigation in your reports is crucial for a great user experience. Hopefully, the tips I discussed gave you a variety of ways to do this in Power BI.
Please watch out for part 3 of my series on developing report transparency, where I will discuss the importance of DAX.
All the best,
Gustaw Dudek


