I’m going to show you a quick and easy tip on how you can sort visualizations dynamically in your Power BI reports. This technique will allow you to showcase different insights on your report. You may watch the full video of this tutorial at the bottom of this blog.
I have seen a few questions about this on the Enterprise DNA Forum. I was also able to utilize this technique in a recent report I made for Enterprise DNA’s Power BI Challenge. The challenge required participants to work on a delivery app review. I wanted to put together a really creative report while giving a ton of insights into the data, which is why I decided to go for this approach.
Sort Visualizations Using An Icon
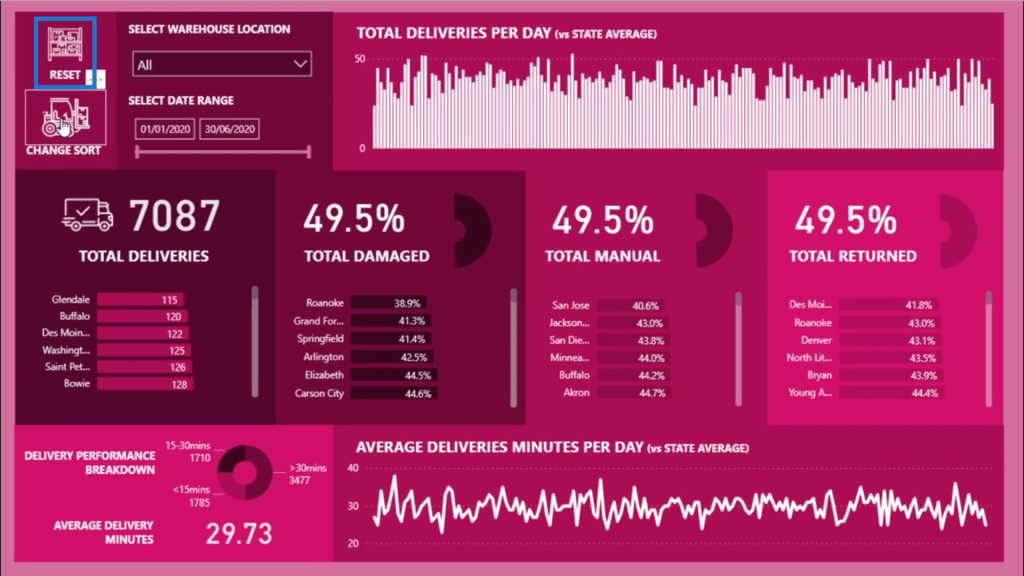
This is the report I created. As you can see, there are a number of insights on this single page.
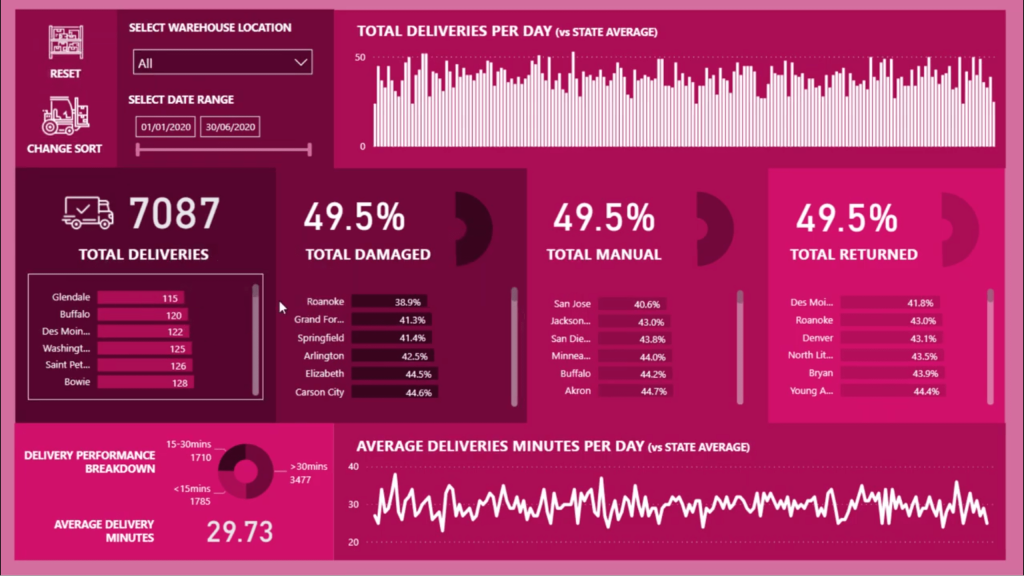
It shows numbers related to deliveries, damaged goods, manual entries and returned goods.
These numbers are totally dynamic. But I wanted to add some extra insights by allowing people who will work on this report to sort visualizations in a snap. That’s why I added this Change Sort icon.
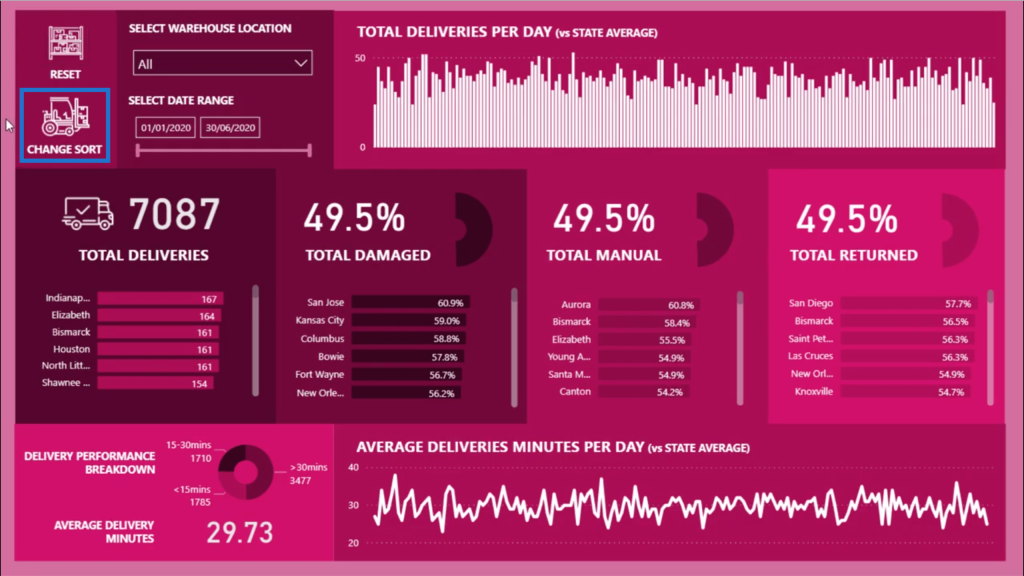
Now looking at the numbers here, you’ll see that the numbers are sorted in descending order. This is the initial state.
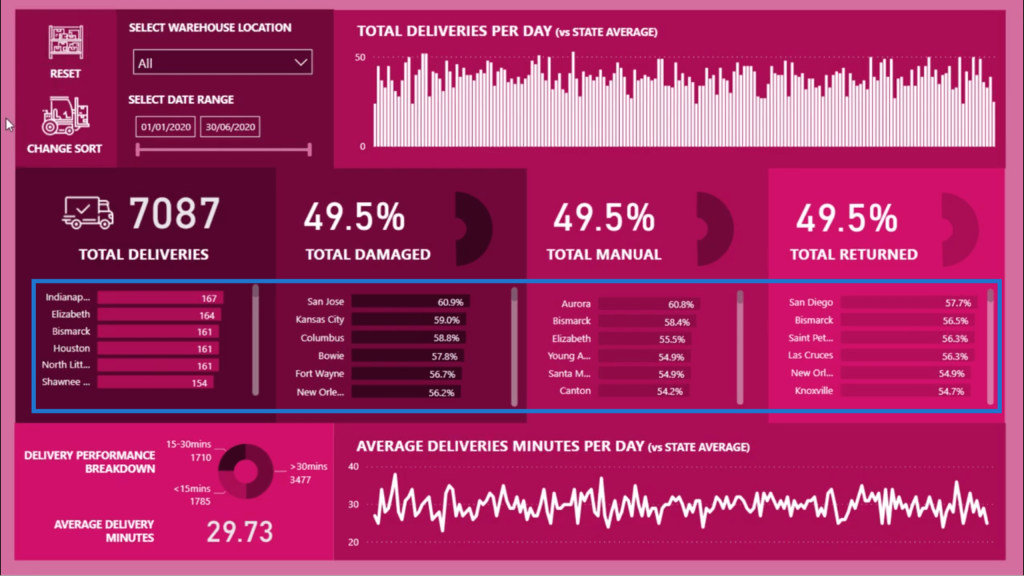
But if I click on the Change Sort button, notice that the numbers automatically get sorted in ascending order.
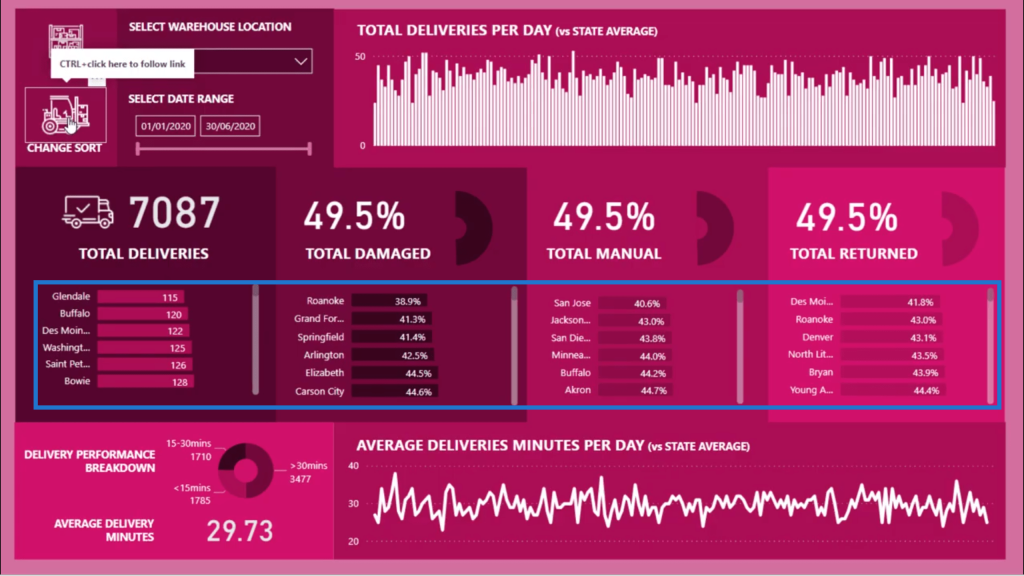
This is a really cool way to showcase different insights quickly. Normally, you’d have to create an additional formula to sort your data like this. This way, you can have a whole range of different data in a single visualization being sorted in one go.
Using Bookmarks To Sort Visualizations
I was able to sort visualizations in a single click by utilizing Bookmarks under the View ribbon.
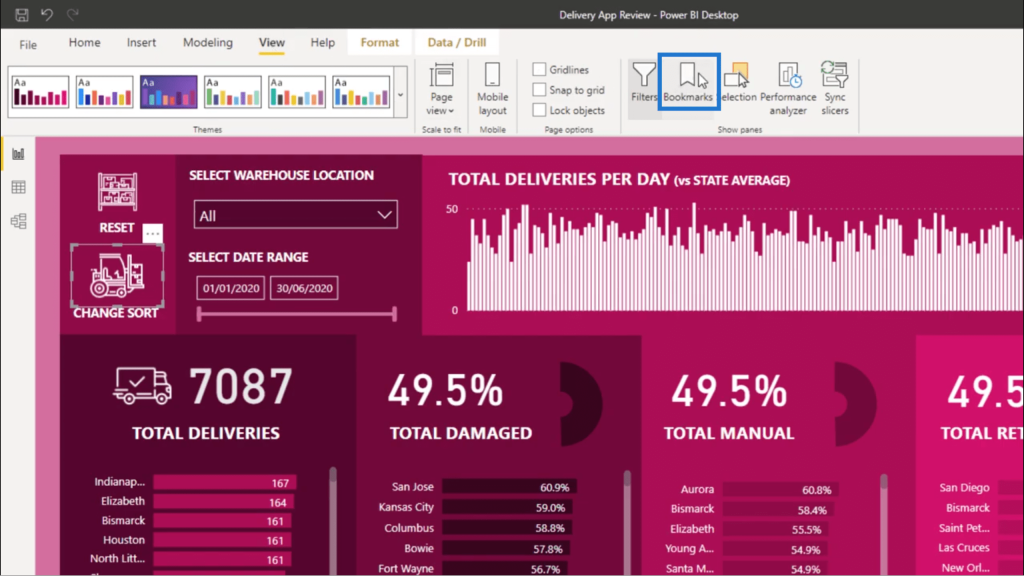
If you click on Bookmarks, you’ll be given two options – to Reset and to Change Sort.
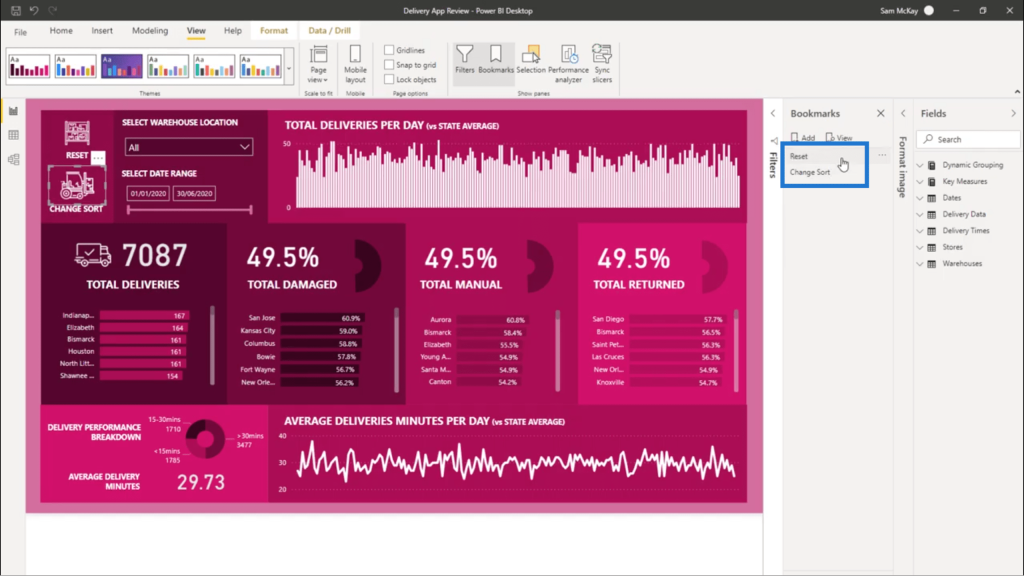
When I got into this Bookmark pane, I just went through each of my visualizations and got them all in descending order. I added a bookmark for that. Then, I sorted them into ascending order and added a bookmark for that action as well.
Now that I have my bookmarks, I need to find a way to call that bookmark. I did that by adding an icon from my files. Once that icon was in place, I just went to the Format pane.
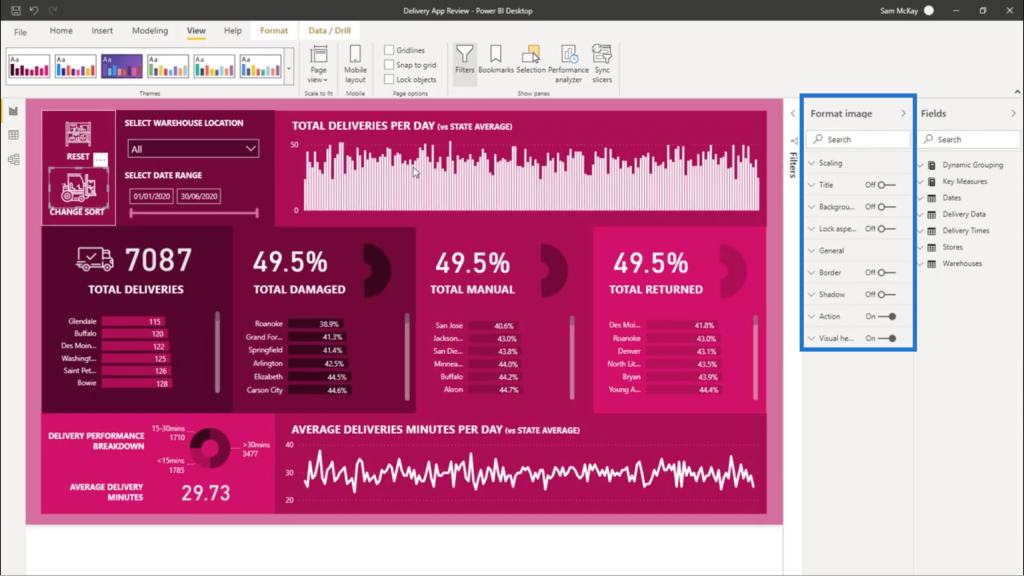
I went to Action and turned it on. Then, I changed the Type to Bookmark. Under Bookmark, I chose Change Sort.
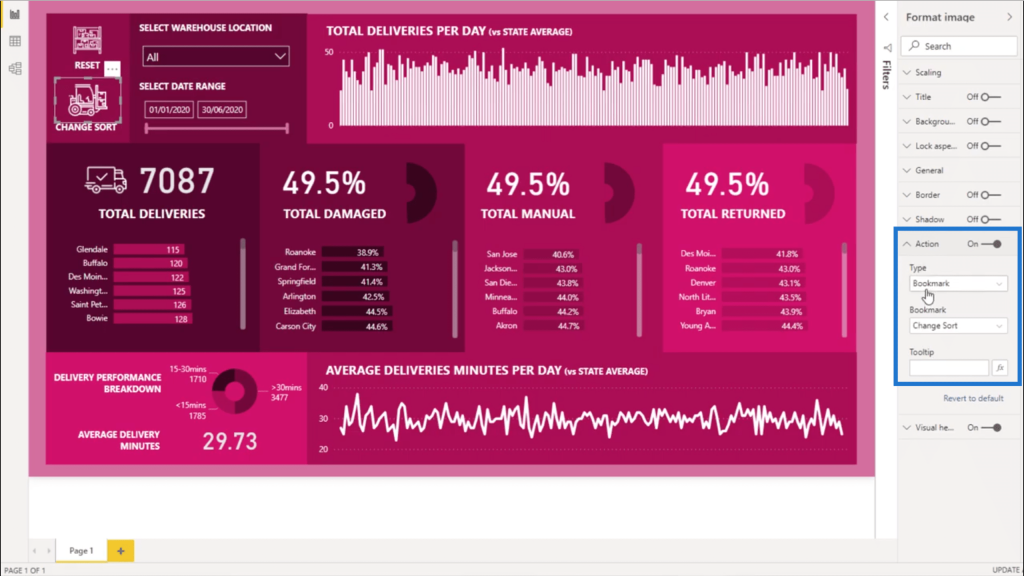
Once that’s done, the icon I uploaded here is now connected to the Bookmarks I created. That means that this icon can now sort visualizations dynamically with every click.
The same thing is done on the Reset button here on top. The Reset button puts the numbers back to its default state.
***** Related Links *****
Group Customers Dynamically By Their Ranking w/RANKX In Power BI
How To Control The Interactions Of Your Visuals In Power BI
Sorting Dates By Financial Year In Power BI
Conclusion
This is a great technique to use especially if you want great insights delivered.
You can even use this technique in a number of different ways. It doesn’t have to be an icon all the time. You can use text or you can use any of the cards in your report. You just have to be creative in your approach.
All the best,
Sam


