The small multiples is a new visual feature in Power BI. It can be used in line charts, bar charts, and column charts. To enable this feature, you need to have the December 2018 version of Power BI Desktop. You can check out my review on this feature in my recent video tutorial. You can watch the full video of this tutorial at the bottom of this blog.
In this tutorial, I’m going to show you how small multiples visual interacts with two calculation items in a report. In this example, I’m using the data from a recent Power BI challenge we had in Enterprise DNA; the calculation items are Defects and Downtime.
Creating Calculation Groups
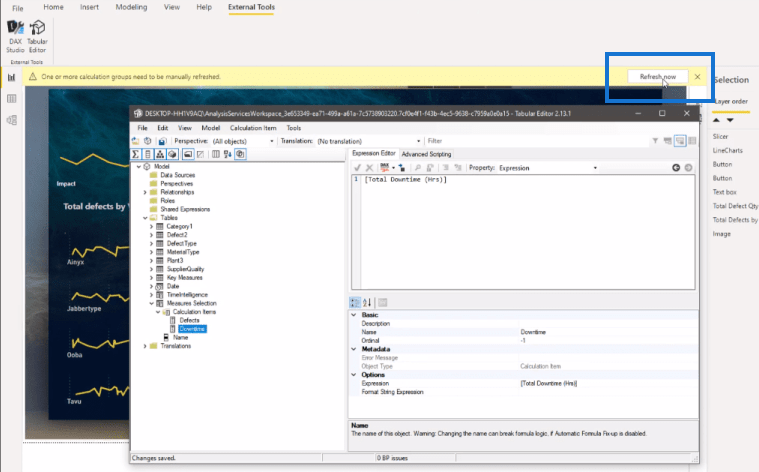
Calculation groups are a collection of measures. They are created in a Tabular Editor, which you can download for free from the internet. You’ll find the Tabular Editor in your External Tools. If you have the latest version of Power BI Desktop, it should popup automatically as shown below.

To create calculation groups, we click on the Tabular Editor, and go to Tables, then Create New – Calculation Group.

We’ll call this Measure Selection. Next, we’ll add a calculation item, and we’ll call it Defects. Under this calculation item, we’re going to use the measure Total Defects that I’ve already created for this report.

Then, we create the other calculation item, which is the Downtime, and we also place the measure that I already created for this calculation.

Then, we click save and refresh the report as well.

Interactive Report With Small Multiples Visual
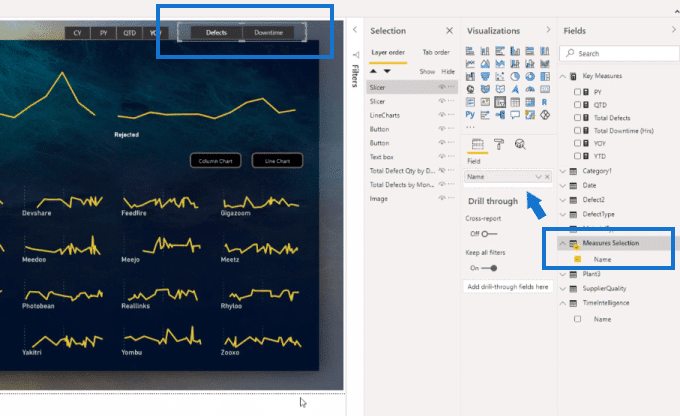
Here, we have created a new slicer and put our Measure Selection into this slicer.

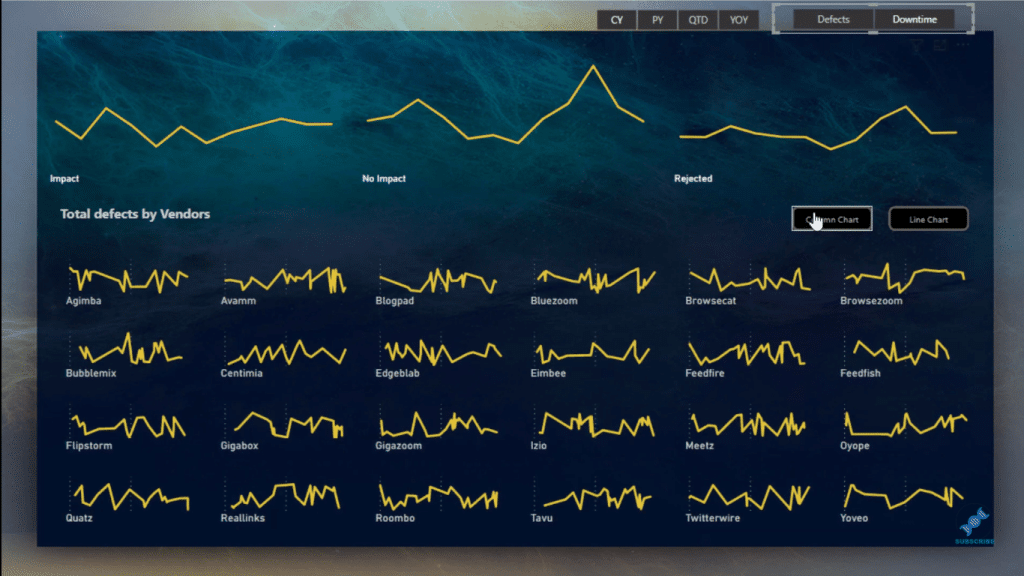
And now we can see that it’s working well and it’s very interactive. We can click through the slicers and the report shows us the data really effective.

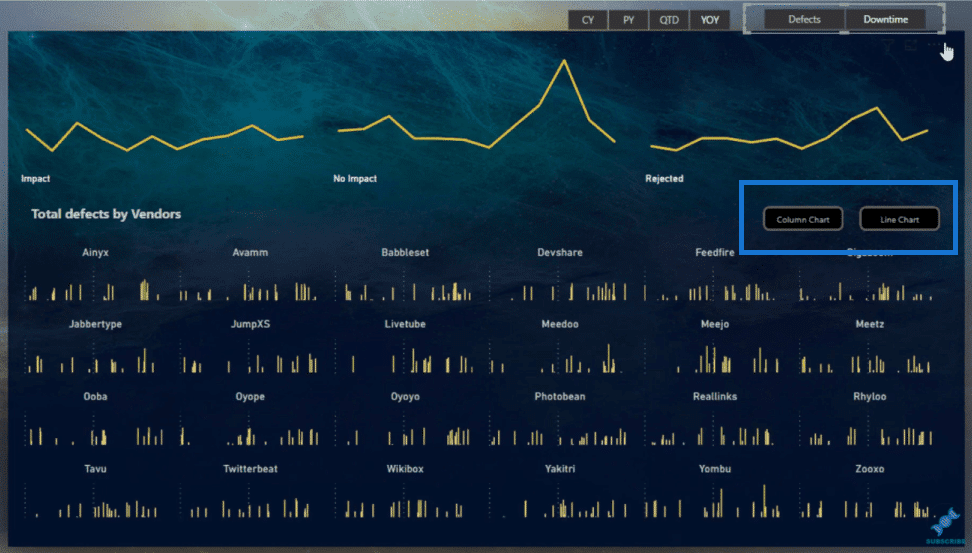
We can also choose to have this in a column chart. I’ve added some bookmarks into the report to enable this action.

***** Related Links *****
Introduction To Calculation Groups In Power BI
Creating Measure Groups – Power BI Best Practices
Measure Branching: Power BI Development Strategy
Conclusion
The small multiples visual feature is a new one and so we’re looking forward to seeing more updates on it before its full release. Nonetheless, it’s quite useful now even as its preview version.
I hope you’ve enjoyed this tutorial. Try exploring this feature for yourself a little more and share with us your experience in the comments section below.
Best regards,
Mudassir


