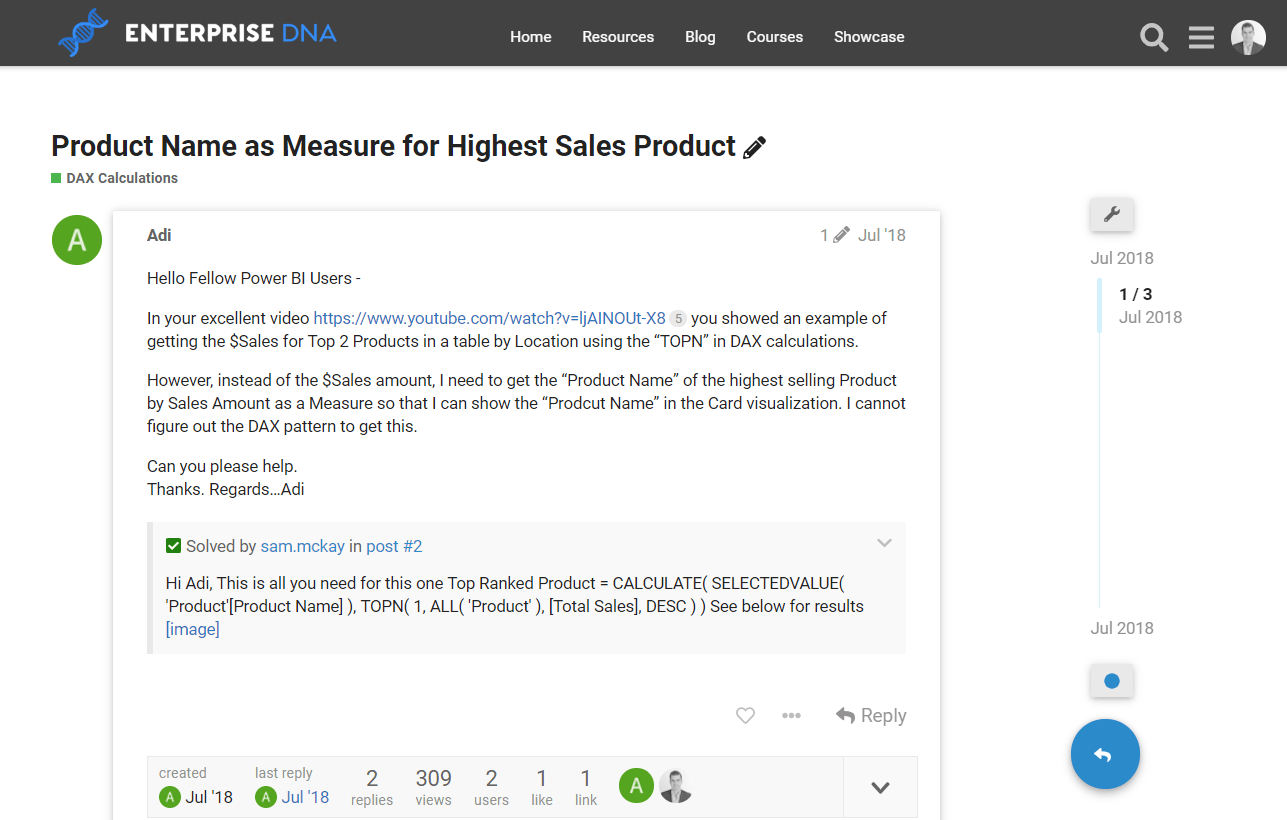
This tutorial came out as a question in the Enterprise DNA Support Forum where a member needed to work out the top value for a particular result, and wanted to show it in a Power BI card visualization. Moreover, the member wanted it to be dynamic so that the card visualization will change or update the result according to the selection made. You may watch the full video of this tutorial at the bottom of this blog.

I felt like this was a good example to branch out into a tutorial that shows how to combine a few key functions inside DAX to extract this type of result.
One key function here is SELECTEDVALUE, which enables us to get text results in Power BI and showcase them in our reports in some way. We need to calculate a text value and change the context in which we calculate it.
In this tutorial, we want to show the top result with this solution. To complete any internal ranking and change the context of a calculation, I recommend that we utilize the TOPN function. In this case, we’ll use TOPN in combination with CALCULATE and SELECTEDVALUE to extract this result and put it into a card visualization inside of our Power BI report.
Using TOPN For Ranking
TOPN is the easiest and most efficient way to create this result and I’ll show you why. Let’s look at the formula.

This formula loos through each product on the list, and then identifies and shows only the top result. TOPN is a table function ranking device, so it will dynamically create a table of rankings. Then, by specifying the number we want to retain in that table, which in this case is one, we can return just the top (1) result of ALL of our Products via Total Sales in descending (DESC) order.
What’s great about the TOPN function is that we can retain any number that we want to have in our rankings. We can have the top 3, top 5, top 10, top, 20, etc. Since we only want to show one text result for this analysis, we put the number one in here.

The TOPN is doing that ranking for us virtually, but then only leaves the the context of the top result. SELECTEDVALUE picks up the result left, and then returns the product name of that top-ranked result. SELECTEDVALUE allows us to isolate a text value as well, and then shows it in a particular visualization. In this case, it’s a card visualization, but it can also be a table, a chart, etc.
So, this is how TOPN can enable us to create filters based on ranking. We can then put the results in a card visualization since it’s going to return a scalar value, which is a singular value.
How The Result Is Shown In The Card
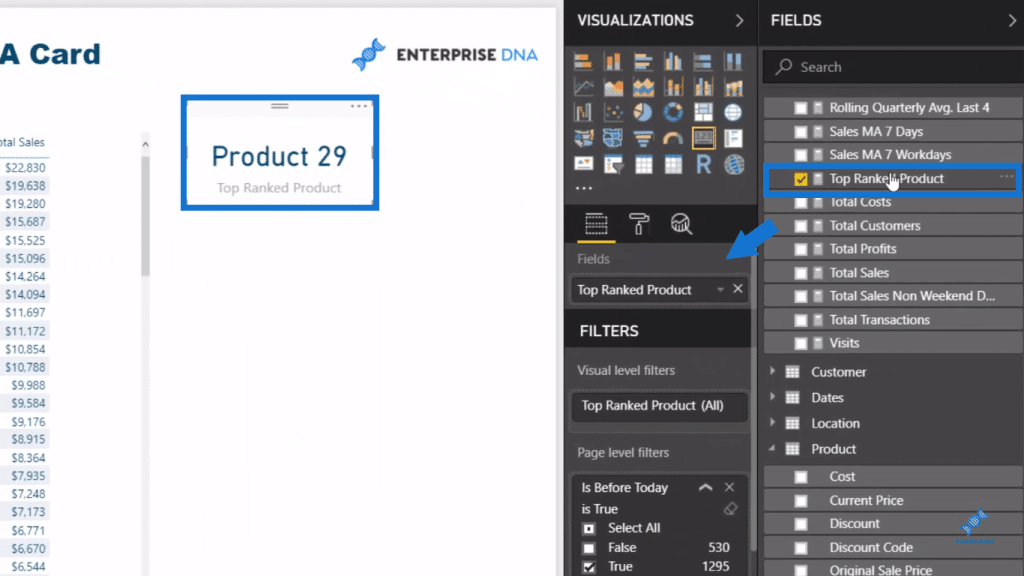
The card visualization that shows the top ranked product result is actually that measure that we created.

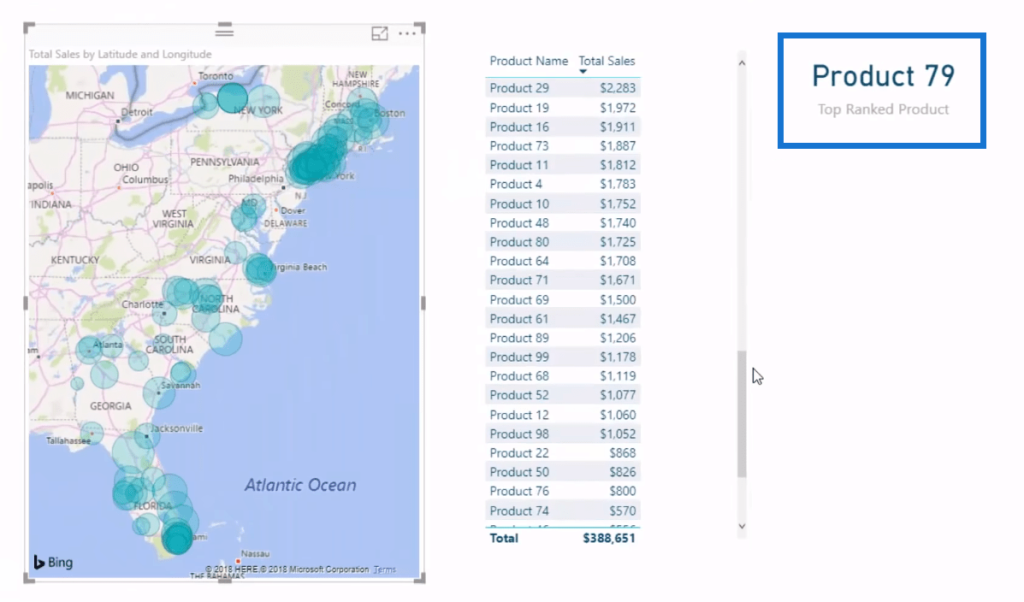
We placed that Top Ranked Product measure into our Fields and that’s how we get this dynamic calculation every time. We can then click through any region and our card visualization will give us the result.

***** Related Links*****
Ranking Insights Using TOPN In Power BI
Power BI Visuals: Change Size By Ranking Logic
Data Visualization Technique in Power BI – Multi Measure Dynamic Visuals
Conclusion
There are many great ways that you can utilize this technique in showing results in a Power BI card visualization using TOPN. Once you understand how this function works, you’ll see that it has lots of applications for most ranking type of analyses.
This is quite a unique concept but a really useful one. Hopefully, you can see how to extract many other types of text results into cards just by changing around what filtering dynamics you have inside of the CALCULATE function. You can have your top-ranked region, top salespersons, top products, etc. You can also use this to show your bottom rank product, bottom region, etc.
I hope you enjoy this content and gain some great insights from it.
Cheers!
Sam
***** Learning Power BI? *****
FREE COURSE – Ultimate Beginners Guide To Power BI
FREE COURSE – Ultimate Beginners Guide To DAX
FREE – 60 Page DAX Reference Guide Download
FREE – Power BI Resources
Enterprise DNA Membership
Enterprise DNA Online
Enterprise DNA Events


