
In this tutorial, I’ll show you how to harvest or capture a value inside a measure to reuse in another measure and achieve dynamic calculations. I use a combination of measure branching techniques with SELECTEDVALUE DAX function in Power BI. You may watch the full video of this tutorial at the bottom of this blog.
The Power BI team has made some updates to formulas recently that enable this to work better than before.
It’s not difficult to do, so let’s jump into it

Creating A Supporting Table
Here I have a really simple measure, which is a sum of my revenue (so just sales). But it could be anything, for example, it could be your quantity or your costs or it could just be any core measure that you create.
If all these increased by a selected amount, say 5%, 10%, or 15%, I want to show the impact of that. And I want to make it dynamic so that I can select different amounts, and then be able to see what the new scenario amount is.
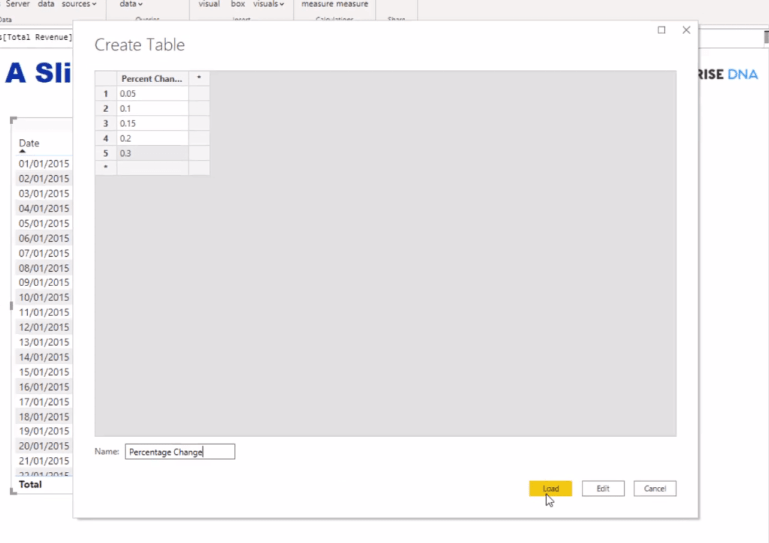
The first thing we need to do to create this is to Enter Data. So, I’m going to enter some values here, and then we’re going to harvest a selection based on these values.
So, I’m going to call this Percent Change. And then I’m going to put some values in here, say 5%, 10%, 15, 20, and 30%. I’ll call this table Percentage Change. So, I’m basically creating a new table here.
Instead of getting it from Excel, I’ve just created it from scratch using the Enter Data feature embedded into Power BI desktop.

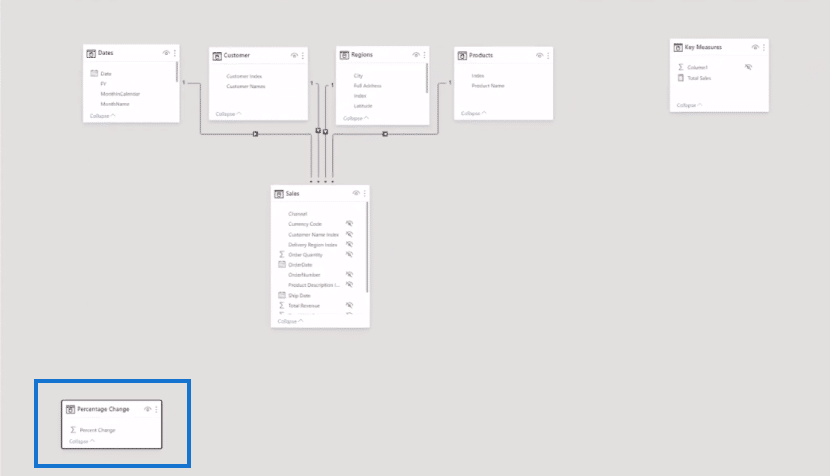
Once I load that in, this supporting table will come into my model, like so.
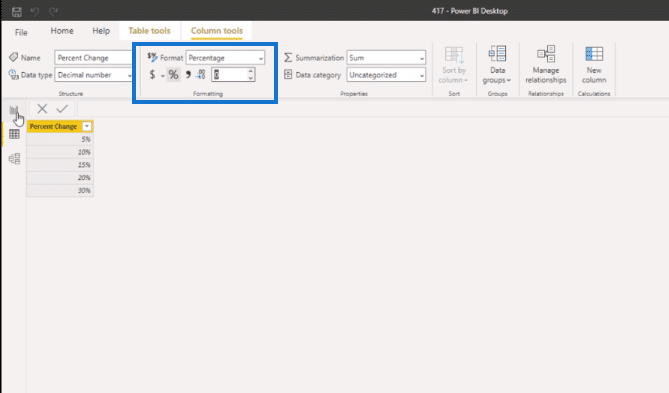
Inside our supporting table, I’m going to change the formatting to percentage and get rid of the decimal point.
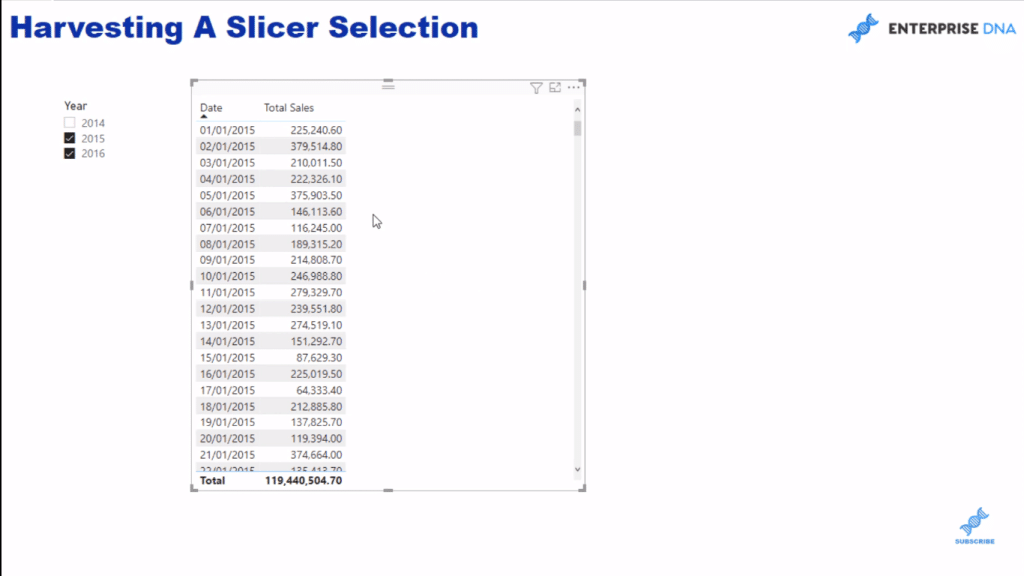
Harvesting A Slicer Selection Using The SELECTEDVALUE DAX Function
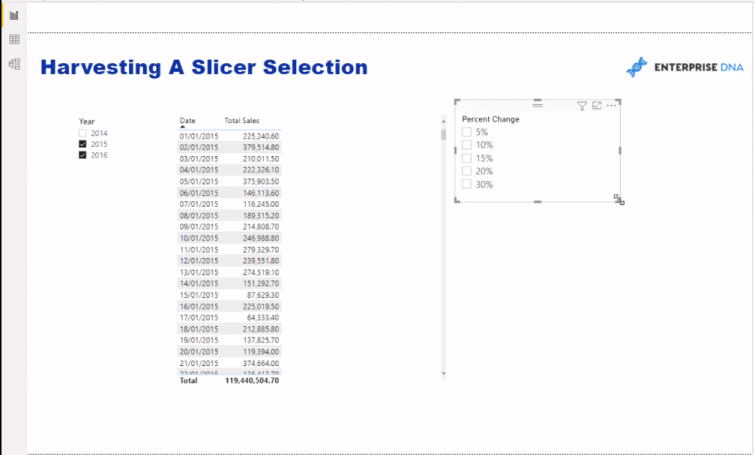
In the report page, I’m going to create a slicer and make it a list.
Now, I want to be able to select one of these and be able to harvest that selected measure. I want to be able to input this measure and combine it with my Total Sales to see what the scenario sales would be.
We can’t do that at the moment because it’s just a column for now. We need to get it into a measure.
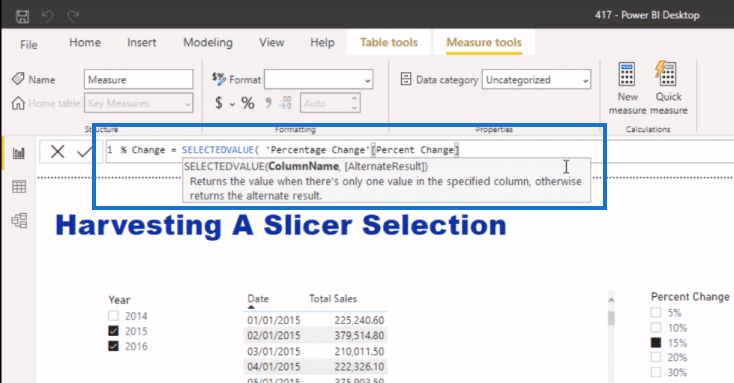
So, I’m going to create a new measure here, and I’ll call this % Change. Then, I’ll use the SELECTEDVALUE DAX function and grab my Percentage Change (Percent Change) column.
The alternative result is quite important here because if say nothing is selected, then you’re going to get an error if you don’t put an alternative result.
Sometimes, you can use BLANK, but that’s not going to help us in this case. If nothing is selected, we want to show that there’s a zero impact. So, I’ll place here zero (0) as the alternative result.
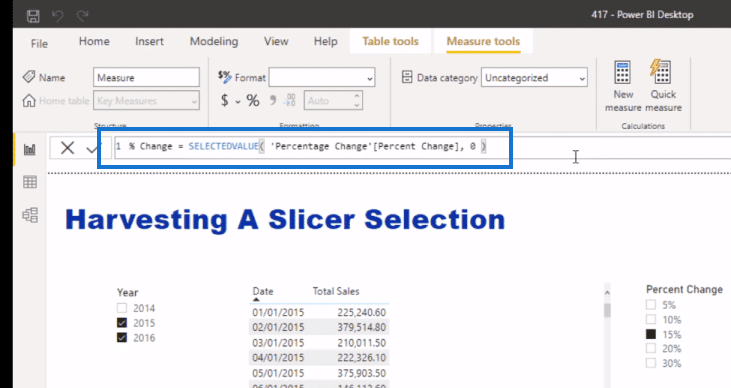
I just need to make sure this is formatted correctly as well. I’ll turn this into a percentage. And then I’ll drag this measure into the canvas and we’ll look at it as a card.
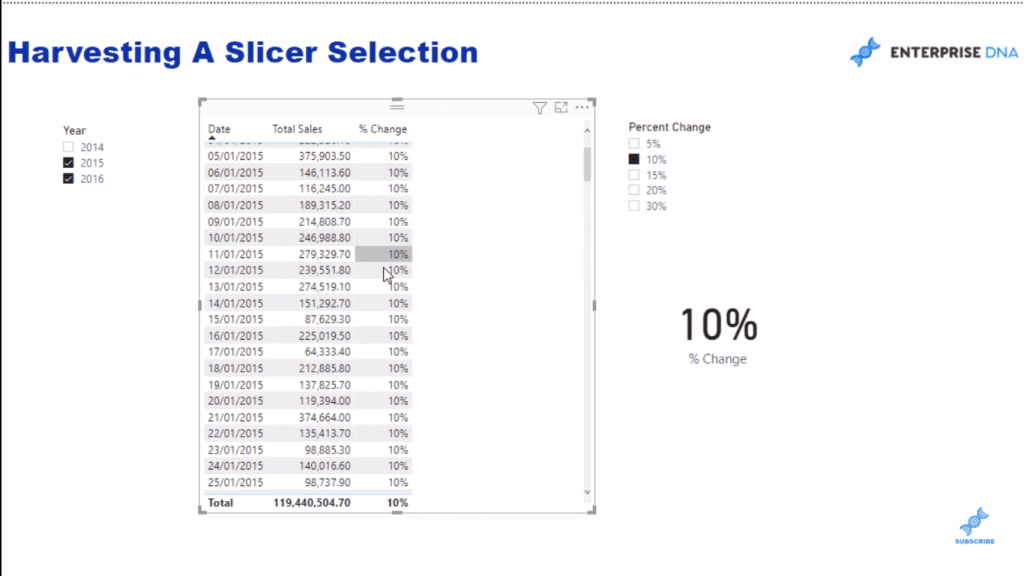
This is what I mean by harvesting. I can select from the slicer, say 10%, and I get 10% in the card visualization.
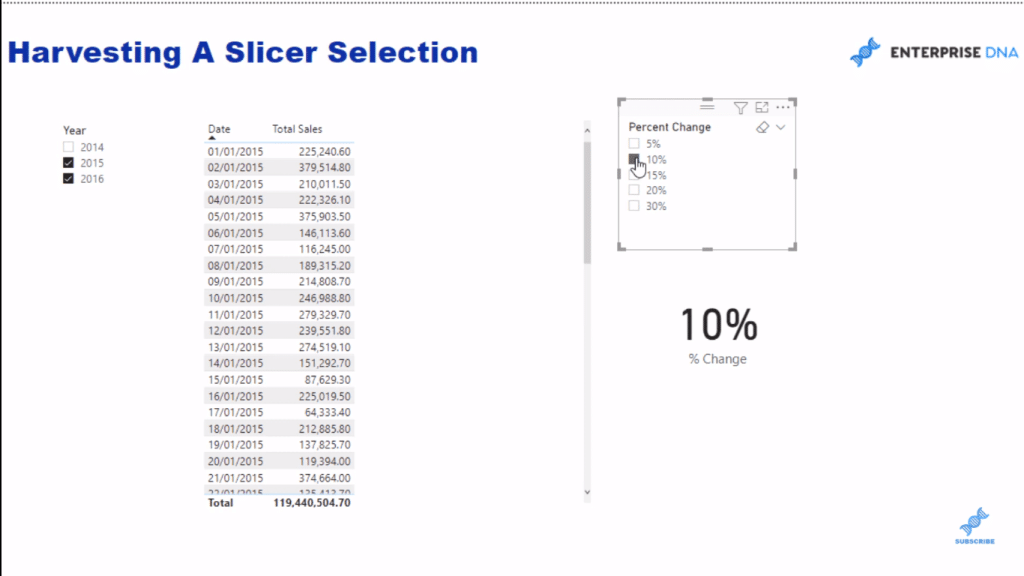
When I drag this measure into the table, you’ll see that I now have this 10% across every single line. I’m harvesting it by the selection, so it changes by the selection.
A fairly simple technique but you can apply this for more advanced analytics especially on scenario analysis and predictive analysis. I’ll show you how to create a simple dynamic calculation out of this SELECTEDVALUE DAX formula.
Creating A Dynamic Calculation Using The SELECTEDVALUE DAX Formula
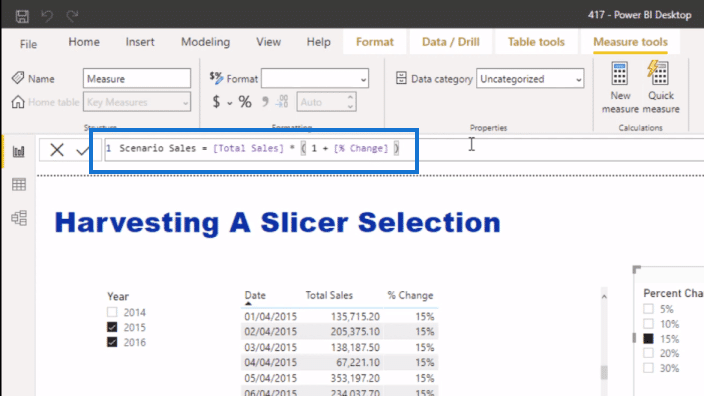
Now I’ll create another measure and I’ll call this Scenario sale. And then I can go equals Total Sales multiplied by one (1), plus the percent change (%Change).
This is how you can create these dynamic calculations. Just think about ways that you can expand on this. You can have multiple different parameters impacting your scenario sales.
And that’s what you can achieve by harvesting your slicer selections. You’ll see that it’s nothing difficult. It’s literally just recognizing that you can use the SELECTEDVALUE DAX function and then embedding the column that you created using Enter Data into the selected value parameter.

***** Related Links *****
How To Harvest Power BI Slicer Selections To Use Within Other Measures
How To Date Harvest In Power BI Using DAX
Showcasing Multiple Selections In A Power BI Slicer
Conclusion
You might think that this is just so simple, but this is the beginning of some quite advanced analytics, especially around scenario analysis and predictive analysis.
This is how you can embed these values into your reports and get dynamic calculations that you may never have seen before.
I’ve gone into this quite a lot in other tutorial series. I’ve even created an entire module dedicated to scenario analysis at Enterprise DNA that takes this to a more advanced stage, so make sure you check that out too.
Cheers!
Sam


