
In this tutorial, we’re going to take a look at a piece of DAX code. You may have already used something like this. Or, you may come across it and be confused about how this code works and how both Row Context and Filter Context seem to be interacting with each other in just a single DAX code. Either way, this tutorial will look at all of the above in detail. You can watch the full video of this tutorial at the bottom of this blog.
First, we’re going to look at the code itself. Then we will go over the theory part to understand it better. Lastly, we will look at everything behind-the-scenes by using DAX Studio.
The data model that we’re going to use is basically a simple sales data model that contains Dates, Sales, and the Products table. The Sales table contains transactions for each given day. The Products table contains information about the sales information about the products on each given day. The Dates table contains only a few columns for the purpose of this tutorial.

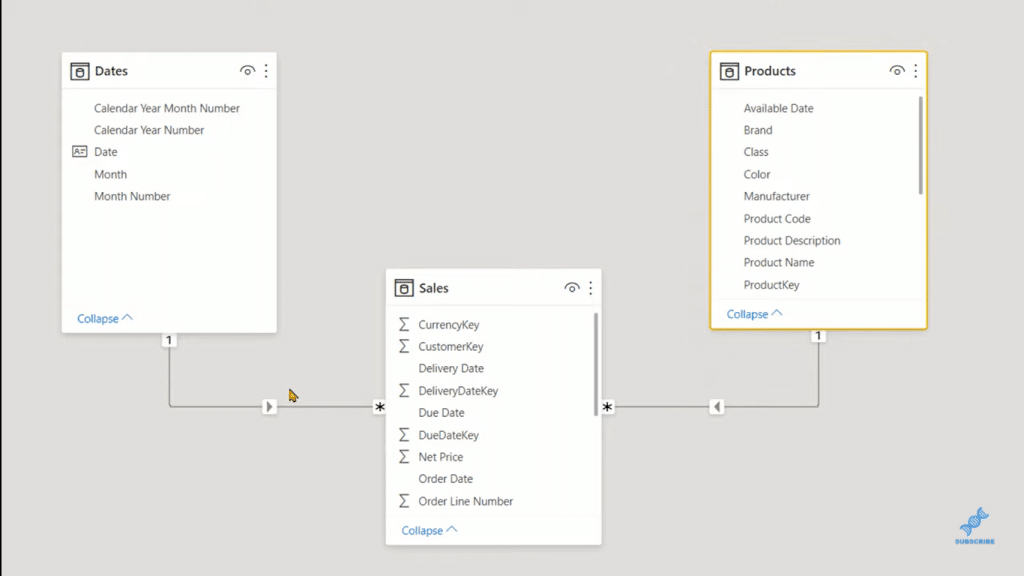
We’re only interested in the Dates table, but we’re going to use the Sales table and the Products table to explain how the filter context and row context propagate with the help of relationships.
Row Context And Filter Context In A Running Total Measure
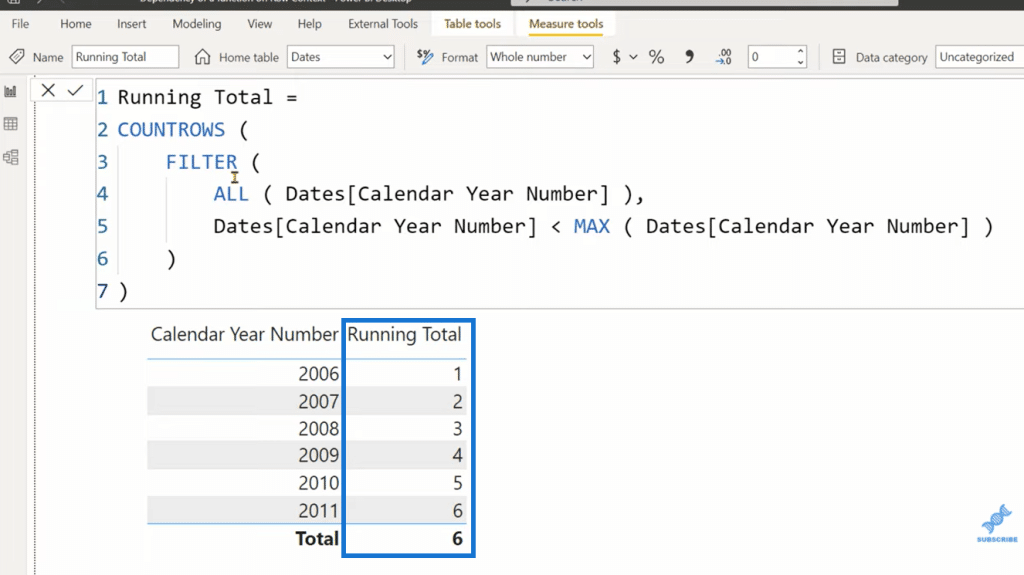
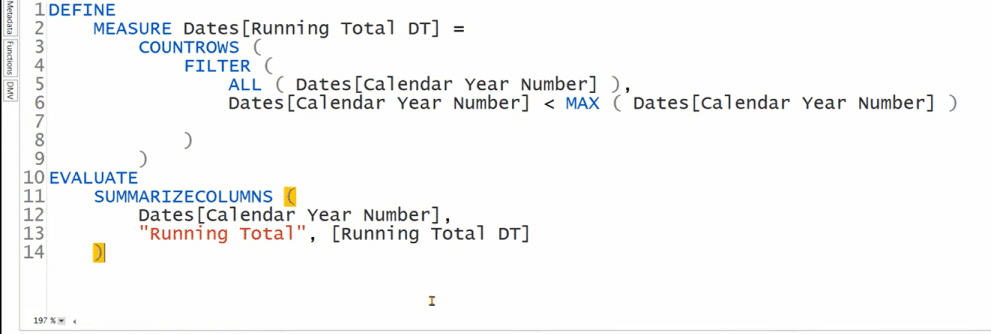
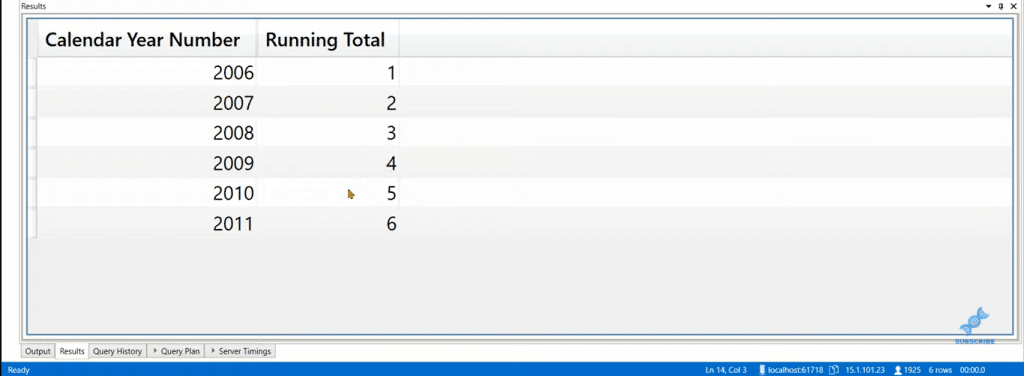
Now, let’s create a running total measure because it contains both row and filter contexts. This is a basic running total measure, where I use COUNTROWS over the FILTER, and the ALL function to return all the years that I have inside the Date table. When I bring that measure inside the table below, you can see that we get the result that we expect.
Now let’s try to analyze how that DAX code is working.
In the measure, you can see that first, we have COUNTROWS, but that’s not the first function that is getting evaluated or being executed. Then, we have the FILTER function, and then the ALL. The first thing in the evaluation order is of ALL. ALL returns all the unique values of the Dates Calendar Year Number by ignoring any filter context that exists outside of the ALL function.
So, in the metrics, we have the Calendar Year Number column, and it is actively filtering that column. But since ALL is going to ignore the existing filter context, we are going to get all the unique values of that column.
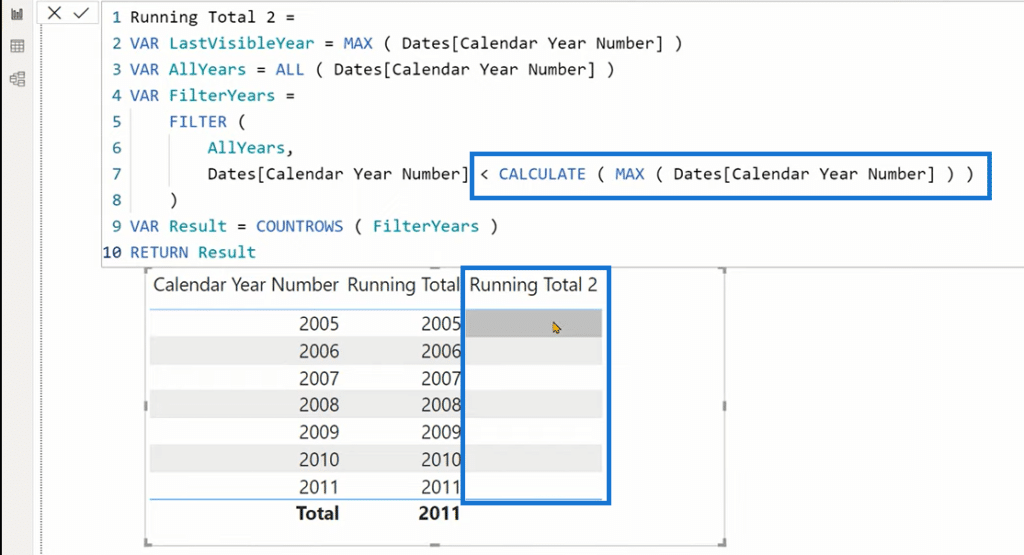
In the second argument, in the row context, we have written that the Dates Calendar Year Number should be less than the MAX Dates Calendar Year Number. Now, if you are a beginner and are still trying to understand and learn DAX, you might think that both the references on the left-hand side and inside the MAX function belong to the same column and are the same table that we have inside the ALL function.

But that is not true. The only part of the row context that belongs to the ALL function is the one that we have on the left-hand side. The one that we have on the MAX is getting evaluated inside a filter context and not in the row context.
So, FILTER tries to create a row context on the table that you provide in the first argument, and this part of the code is actually retrieved from that particular row context. So each row, FILTER iterates that table that we have inside ALL, and then we’re able to access all the values that we are currently iterating.
So, in the first iteration, we only have one value. In the second iteration, we have the second value. But when we write MAX, it is independent of the row context that we are creating using the FILTER function. So MAX is getting evaluated in the filter context that is being created by the Current Year Number that we have used in that matrix.
When we are at 2006, MAX is going to return 2006 whereas the current row can be 2006, 2007, or 2008. FILTER is going to return the table that satisfies the criteria that we are specifying in the second argument. When we move to 2007, MAX is going to return 2007. In 2008, it is going to return 2008. And depending upon all the values that are less than the value that is getting returned by the MAX function, FILTER is going to return a table.
To prove that MAX is not dependent on the row context, we can segregate this piece of DAX code into several variables. And then, we will be able to understand that the column reference on the left-hand side and on the right-hand side are not the same.
So, let’s create a variable.
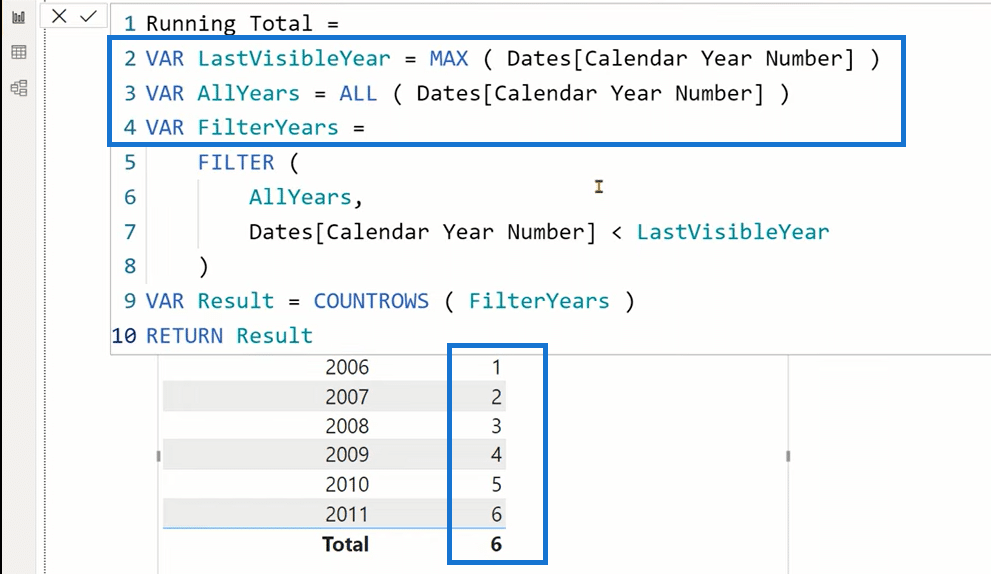
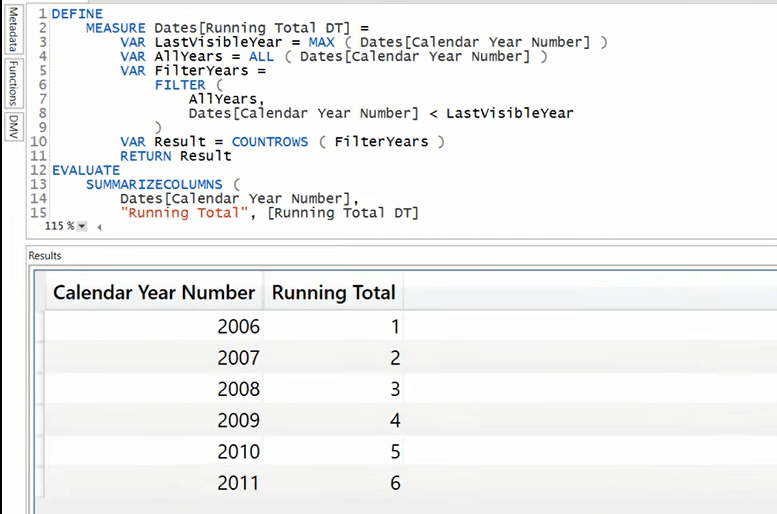
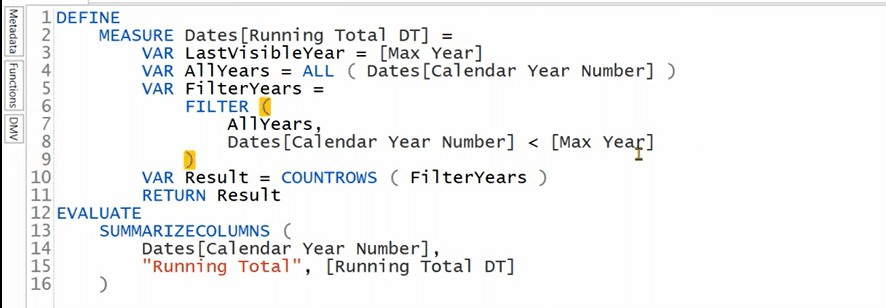
As you can see in the measure below, I created three variables (VAR). I then added the FILTER code lastly with a variable Result that uses COUNTROWS. When I use this measure in the table below, you’ll see that nothing changes. The results are still the same. We still get the same running total that we were getting earlier.
If we go back to the code and try to retrieve the value of the first variable and confirm that, you can see that for each row, we get the same year.
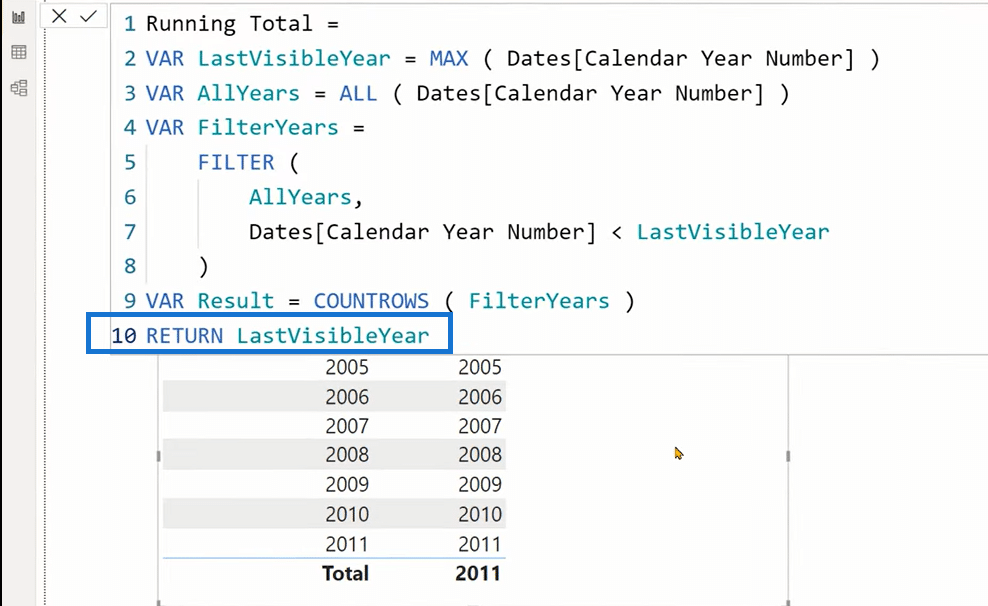
So, hopefully, I was able to explain to you that the MAX function, in this particular code, doesn’t actually depend upon the real context for its values. And if you want to simplify your understanding of the evaluation context, you can always break the code into several variables so that you can understand the evaluation order and how the code is getting executed.
Now, I want to show you a scenario in which the MAX function will depend on the row context that is created by the FILTER function.
So, let’s go back to that measure. Let’s duplicate that, and instead of Last Visible Year, I’ll have CALCULATE MAX Dates Calendar Year Number. When I bring that into the matrix, you can see that we get a blank.
Why?
The thing is we are iterating all the years and what CALCULATE does is that it converts the currently iterated row into an equivalent filter context.
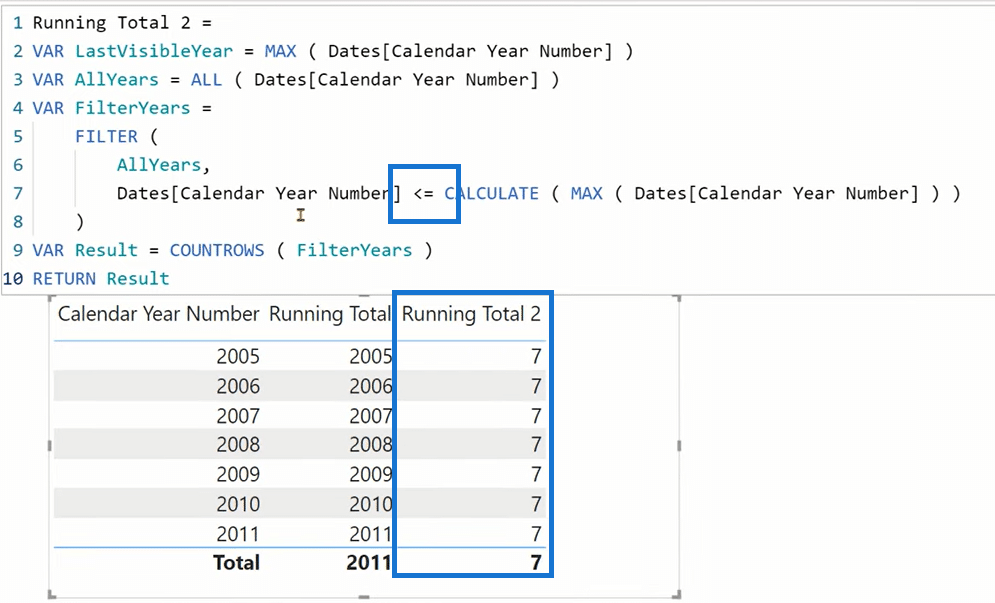
If I write an equal sign here, you can see that we get seven, seven, and seven.
Why?

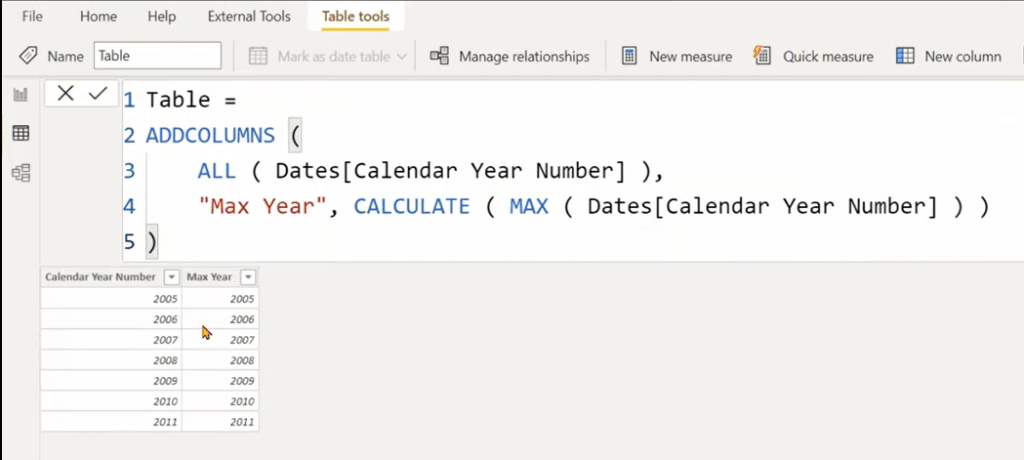
Let me create a new calculated table so that you can easily understand what is happening.
I’ll go create a new table. Next, I’m going to write ADDCOLUMNS over the ALL Dates Calendar Year Number. Then, I’ll write Max Year, and then I’ll use CALCULATE over the MAX of the Dates Calendar Year Number. And now you can see that for each row, we are repeating the same value.
Since these numbers are not strictly less than themselves, we are getting a blank. But when we use equal to (=), we are saying that all the values that are less than 2011 get a seven.
Moreover, even if you are using a measure reference such as something like Max Year, this code will not work.

If I click confirm, you can see that we still do not get anything. This is because when we write Max Year, we are simply writing CALCULATE MAX Dates Calendar Year Number.
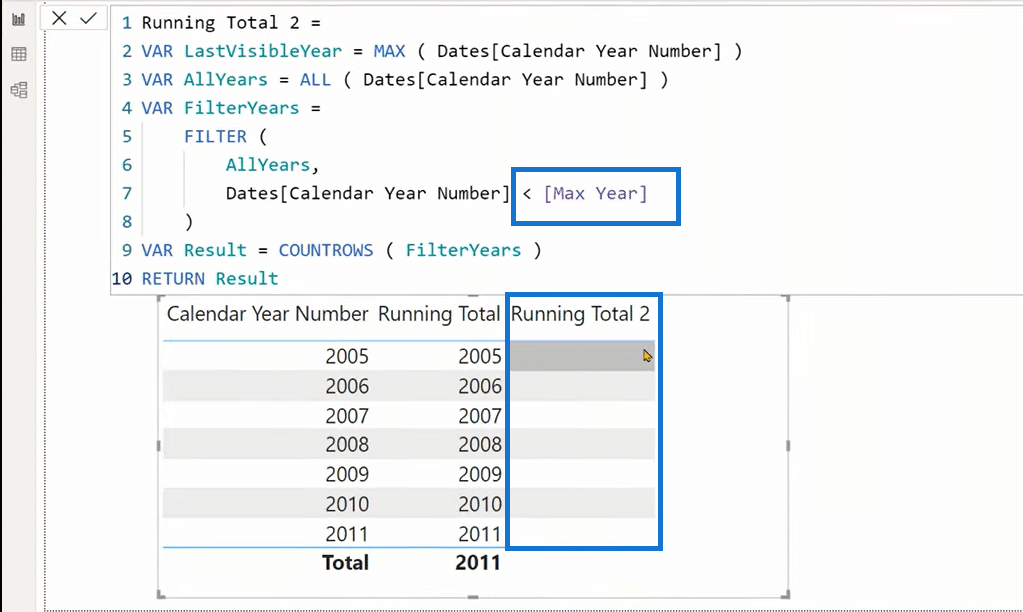
A measure reference always has a CALCULATE outside of it. So, this measure is initiating a context transition that converts the currently iterated row into a filter context.
But if you are bound and you have to use a measure reference, what you can do is store that measure in a variable. And as you may know, variables are constant, and they cannot create a context transition. So it cannot convert the row context into a filter context.
So, that is a quick demonstration of how a row context and a filter context are interacting with each other in a DAX code.
Now let’s go to DAX Studio to understand what is happening behind the scenes.
Using DAX Studio To Understand Row Context And Filter Context
Let’s go to the External Tools and launch DAX Studio. We need to connect to the Power BI file with the help of Query Plan and the Server Timings.
Then, I’m going to create a query measure. I’ll write DEFINE MEASURE in the Dates table, Dates Running Total. And then, I’m going to use the original code that we had.
Since we are supposed to return a table, we can write EVALUATE. Finally, we are going to create the table using the SUMMARIZECOLUMNS. So, we are going to write Dates Calendar Year Number, and the virtual column, which will be the Running Total. And then, I can write something like DT as a DAX Studio keyword.
If I execute this code, you can see that the code is complete and we still get the same result that we have seen inside Power BI.
Now, let’s go to the Query Plan to understand what is happening behind the scenes. Let’s see if the MAX function is actually dependent on the row context or not. Let’s go to the logical Query Plan because the physical Query Plan is generally more complex and is a bit difficult to read.
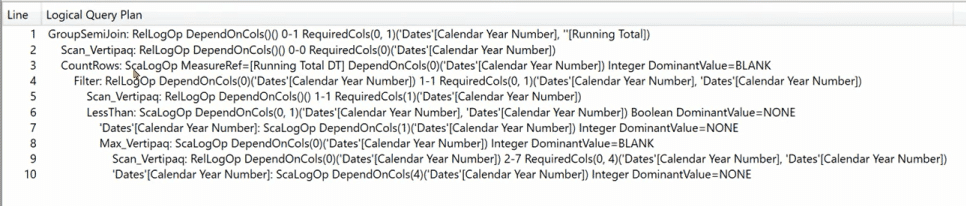
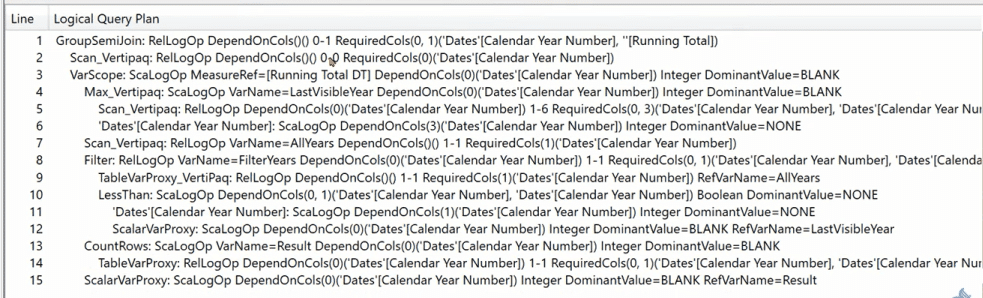
You can see that the first operator on the first line is GroupSemiJoin and that is used by the SUMMARIZECOLUMNS to create an inner joint between two columns.
Then, for joining those columns, there is Scan_Vertipaq, which is the storage engine that we have inside the analysis services. We can see that it says that we need a column, which is Dates Calendar Year Number. In Power BI, you can see that on the matrix, we have this Calendar Year Number column, which is acting as access to our report.
Next, we have the COUNTROWS function in our measure as a top-level operator, then COUNTROWS calls the FILTER function for the filter. There is a Scan_Vertipaq again, which says that RequiredCols is Dates Calendar Year Number.
Lines 2 and 5 are the same, but the first Scan_Vertipaq is marked with zero while the second one is with one. That means that the column that we are accessing, with the help of the ALL function, is extracted separately from the column that we have inside the SUMMARIZECOLUMNS function.
Then, there is a LessThan operator. In the next line, we can see that there is a comparison between the row context and the MAX function.
This is followed by the Max_Vertipaq. So, we are actually extracting the Max value from the storage engine. Towards the right, you can see that it says, DependOnCols Dates Calendar Year Number. This is the most important thing that we need to remember. Earlier, I said that there is no dependency of the MAX function on the row context, and this is what actually proves it.

And so, here it says zero.
Where did we find zero?
On the top (the second line), which is being extracted for the SUMMARIZECOLUMNS. That means that the MAX function doesn’t depend on the row context, but it is actually depending upon the column (Calendar Year Number) that we have inside that table. So that table is actually creating the filter context.
In short, the MAX function is dependent on the filter context and not the row context.
Next, you can see that for calculating the Max_Vertipaq, we have a Scan_Vertipaq, which says that DependOnCols zero (0) Date Calendar Year Number. And then, there are several other columns that require columns.
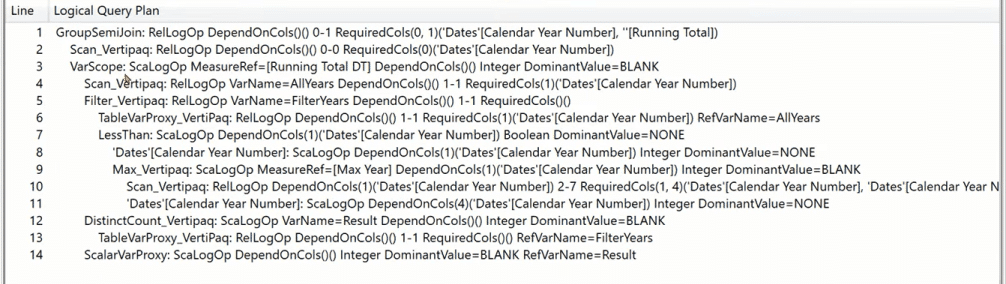
Now let’s look at the variable version of the code. Instead of returning the LastVisibleYear, I’m going to return the COUNTROWS version or the Result variable, and you can see that we still get the same result.
If we look at the Query Plan, you can see that it’s a bit longer, but it is much easier to read.
Lastly, here’s the calculated version of the code as well
And this is what its Logical Query Plan looks like.
***** Related Links *****
DAX Power BI: What Is Row Context
Introduction to Filter Context in Power BI
What Is Context Transition And Why Does It Matter?
Conclusion
In this tutorial, I’ve explained how a given function can interact and cannot interact with the row context. I’ve also shown you how the MAX, in this case, was evaluated in the filter context and not in the row context.
It’s important to always remember that the filter context filters the entire model and the row context only iterates the given table and never filters the model. The filter context doesn’t iterate a table.
I hope you found this tutorial helpful. Stay tuned for our DAX Studio code that we will release very soon. We will go much deeper into similar scenarios. We’ll also teach you how you can optimize your DAX code.
Enterprise DNA Experts
[youtube https://www.youtube.com/watch?v=HMtxENQCD_w&w=784&h=441]


