In this tutorial, I’ll discuss how to use the ROUND function in Power BI when it comes to conditional formatting. Excel users might be familiar with how this function works in Excel, and we actually use it in a similar way in Power BI. You may watch the full video of this tutorial at the bottom of this blog.
I recently encountered a problem with conditional formatting, and I’ll show you how I solved it using this function. I needed to highlight a number in a certain column if the results from the other 2 columns didn’t match. After talking to one of our Enterprise DNA experts, I figured out that I just needed to use a DAX function called ROUND.
ROUND Function In Power BI
The ROUND function is used to round a number to the specified number of digits. You can check the Microsoft documentation for this function here.

The number term refers to the number that you want to round. In my case, this is the measure. On the other hand, the num_digits represent the number of digits from the decimal point that you want to round.

You can also check these considerations when using the ROUND function.

Let’s discuss how I used this DAX function in a calculation and conditional highlighting that I did for a client.
Margin Calculation Without ROUND Function In Power BI
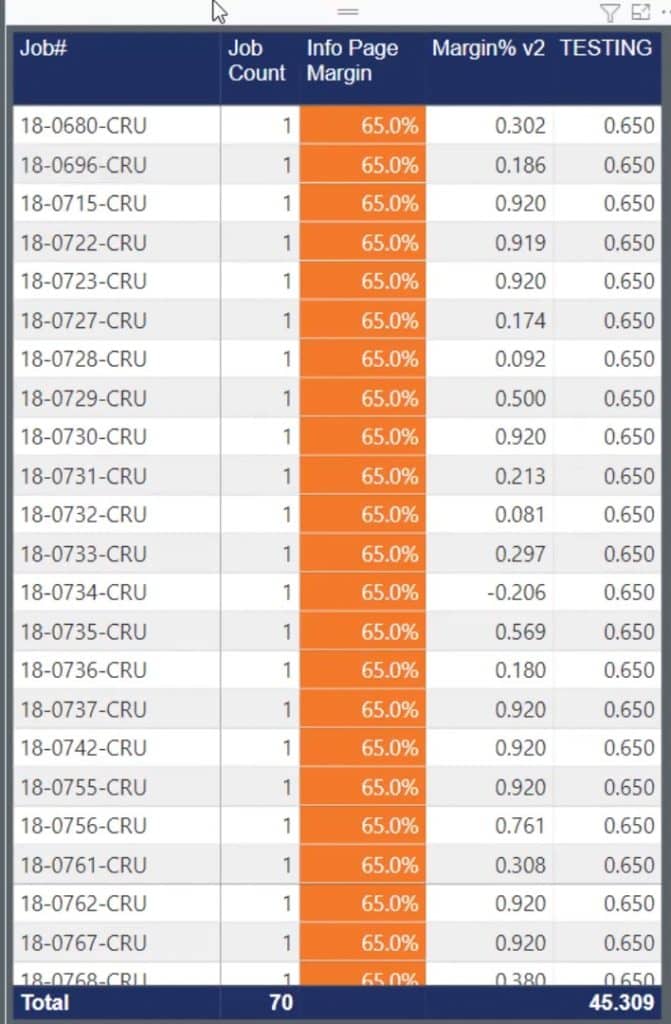
Here is the situation that I had when I did the Margin Target calculation and conditional highlighting for my client. I broke down this table by job. I also added a Job Count column so we could see the total amount of jobs.
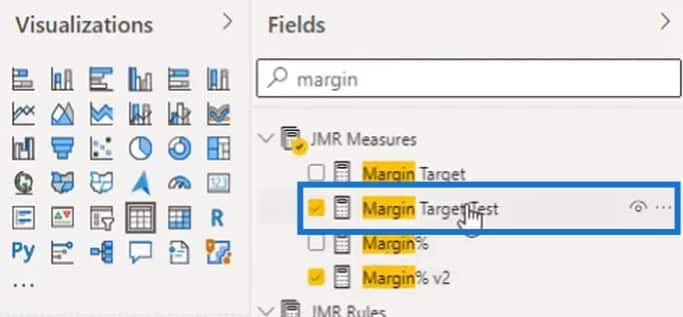
In this scenario, I used a measure that I named as Margin Target Test to get the results for the Info Page Margin column.
The Info Page Margin column is a margin calculation. Typically, the margin is in a number form. So, I used this measure to divide the margin to 100 in order to get the percentage.

Incorrect Conditional Formatting Sample Scenario
In the original measure, I was trying to highlight the number in the Info Page Margin column to orange, if it doesn’t match the actual margin which is the number in the Margin% v2 column.
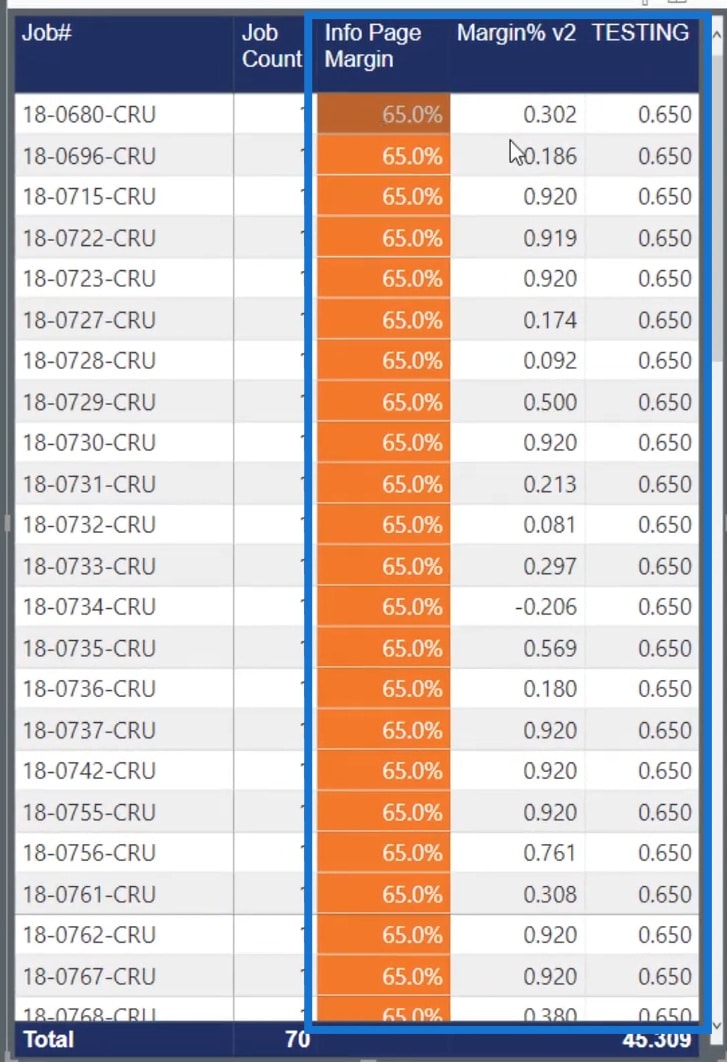
To show you that, here’s a tab that I labeled as incorrect. This will show you the highlighted incorrect values.
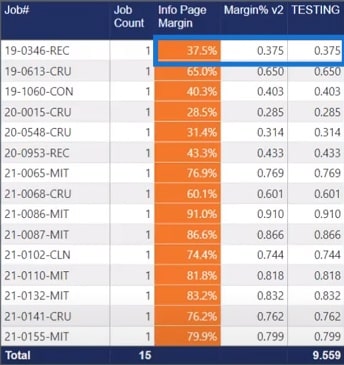
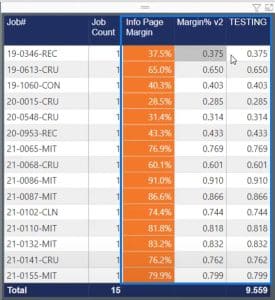
As you can see, the margin from the Info Page Margin column is 37.5%. Then, the numbers in the Margin% v2 and TESTING columns matched. In that case, the 37.5% shouldn’t be highlighted. This table shows an incorrect output because of the original way that I’ve set up the measure.
Reviewing The Incorrect Measure
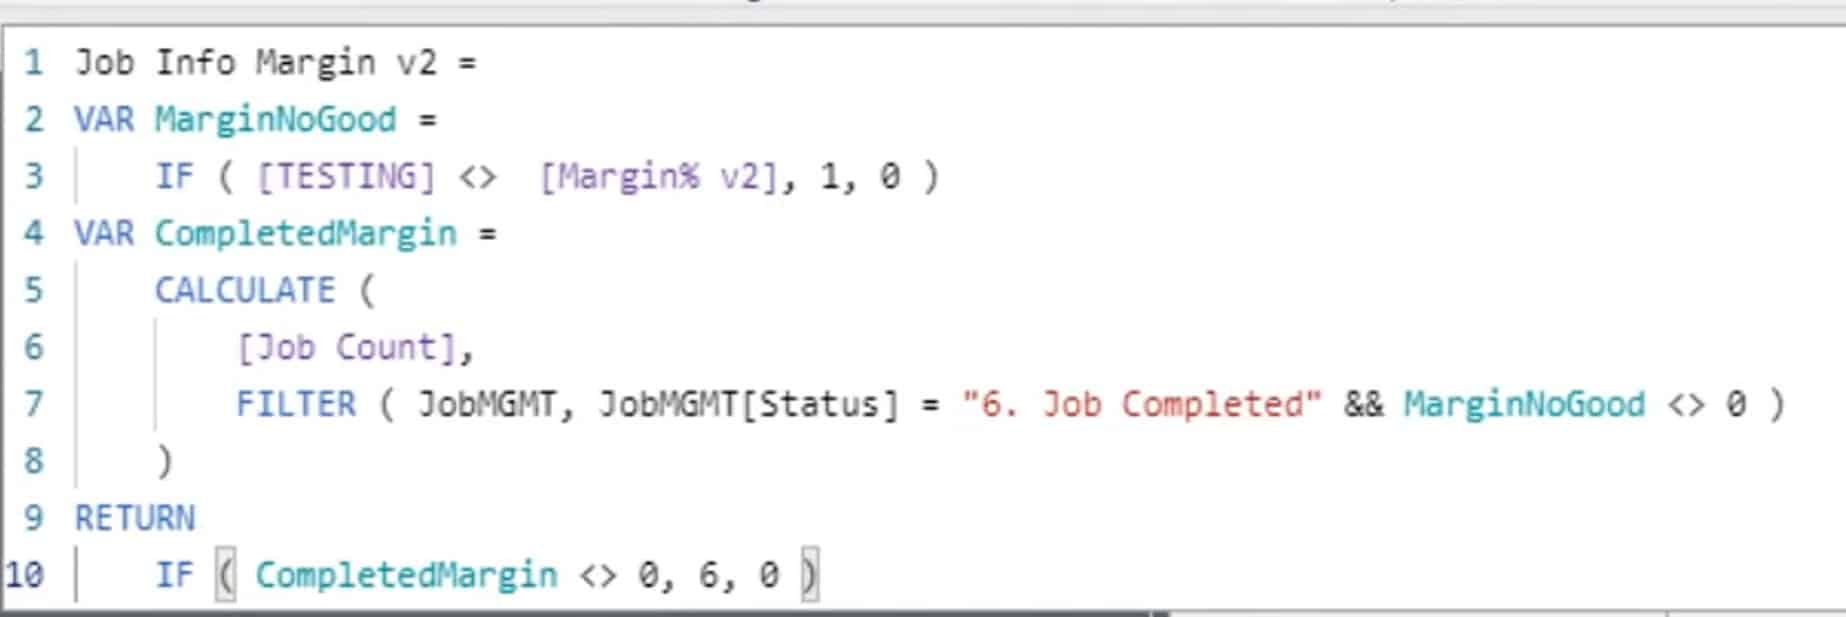
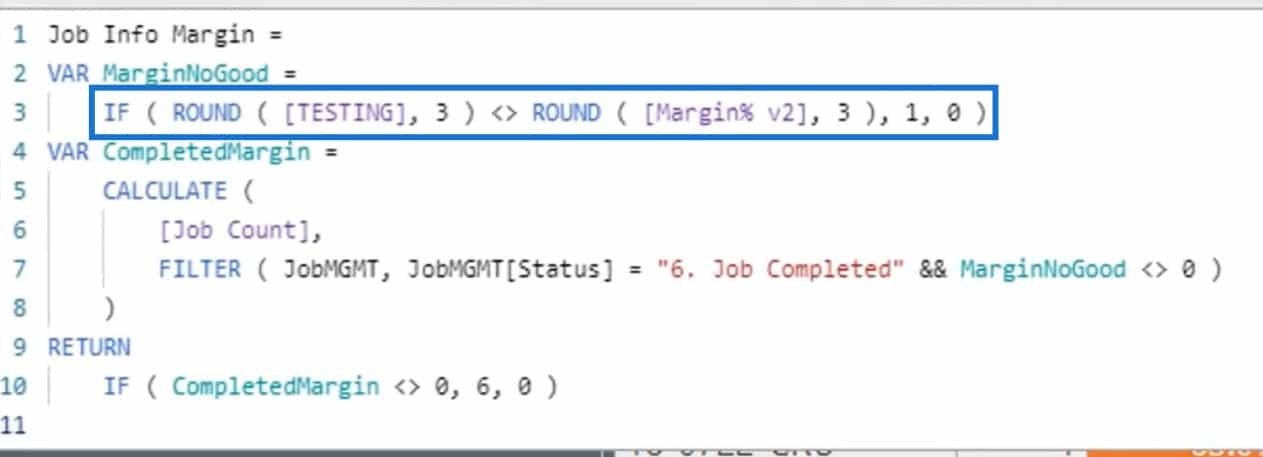
Here’s the incorrect measure that I used for the previous scenario.
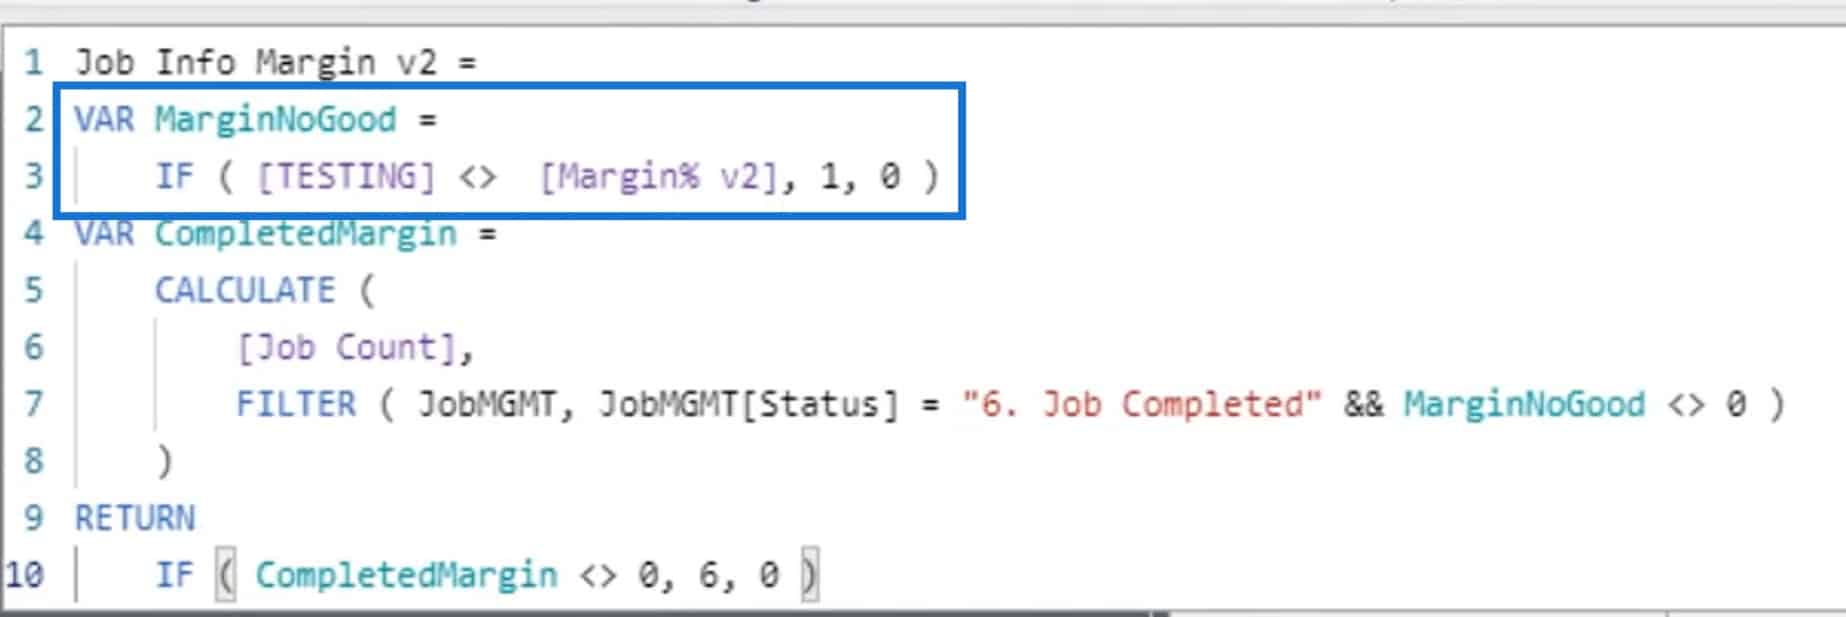
In this measure, I created a variable called MarginNoGood. This variable contains a condition where if the result from the TESTING column doesn’t match the number from the Margin% v2 column, the value will be set to 1. If not, the value will be set to 0.
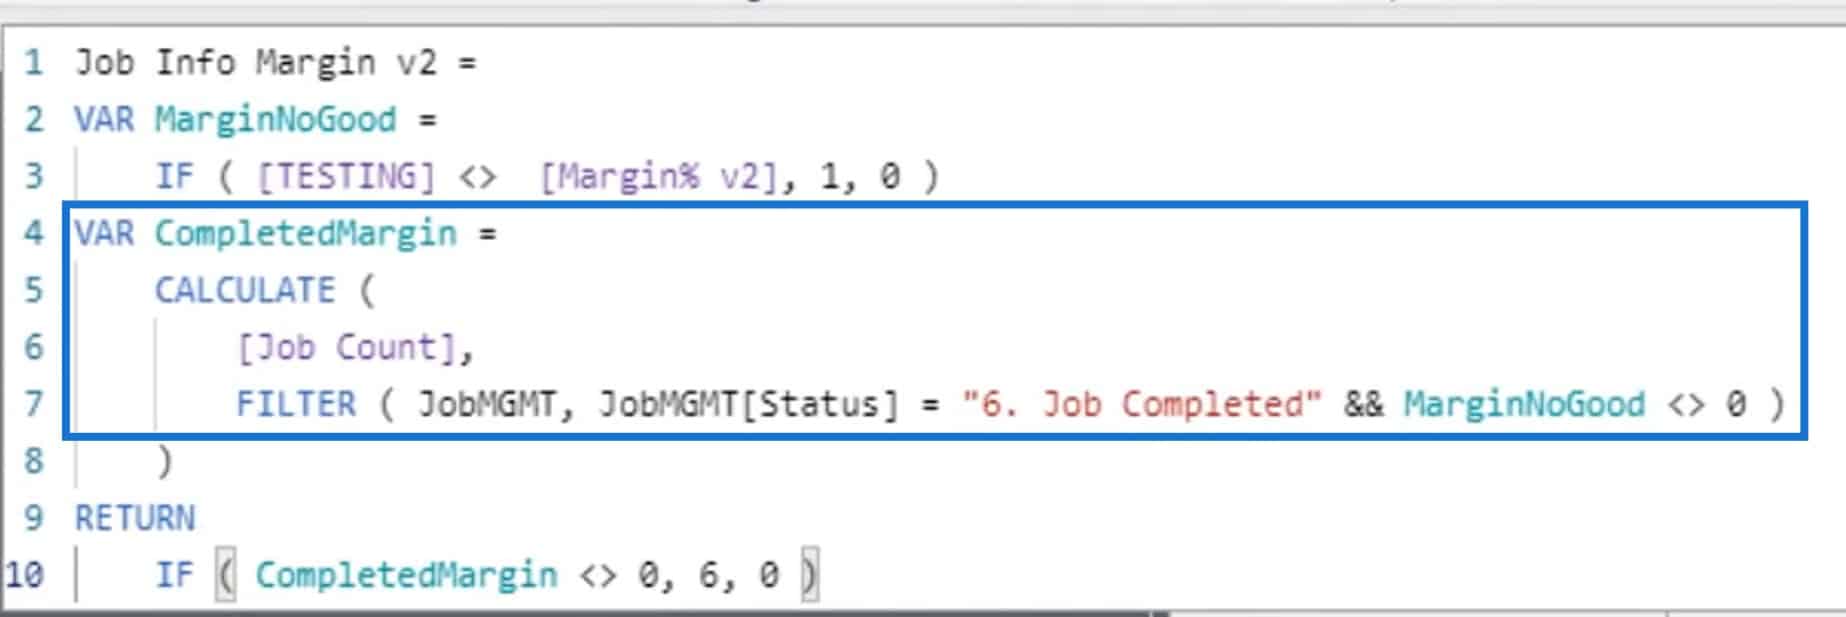
Then, I created the CompletedMargin variable. I used this to calculate the number of jobs that were under the “Job Completed” status and those that resulted in 0 from the MarginNoGood calculation.
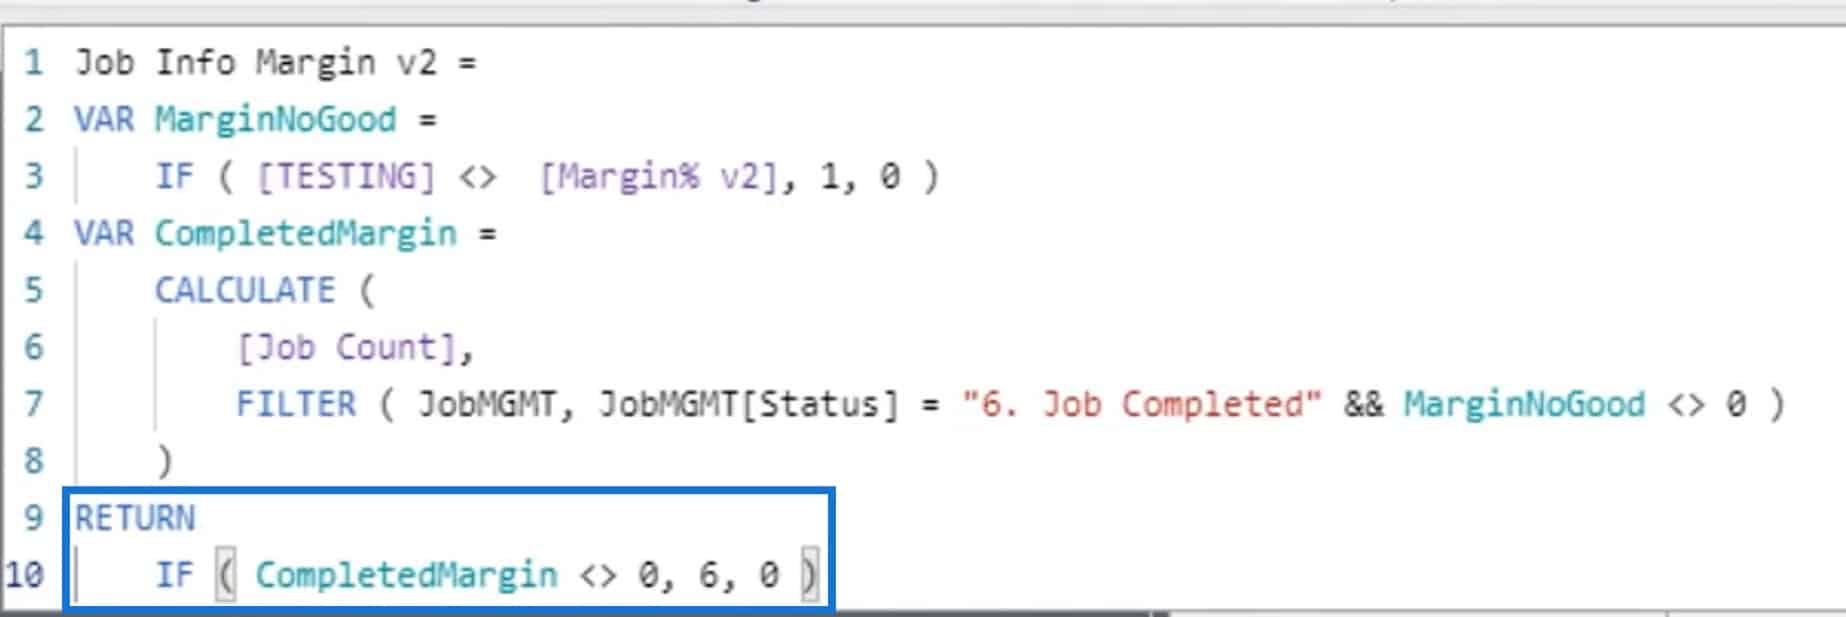
After that, I used the RETURN keyword wherein I could get a 6 or a 0 that I can use to conditionally highlight the background of the number under the Info Page Margin column.
Creating A Conditional Highlight Background
I created a conditional highlight background by opening the Info Page Margin here. Just hover over the Conditional formatting option and click the Background color option.
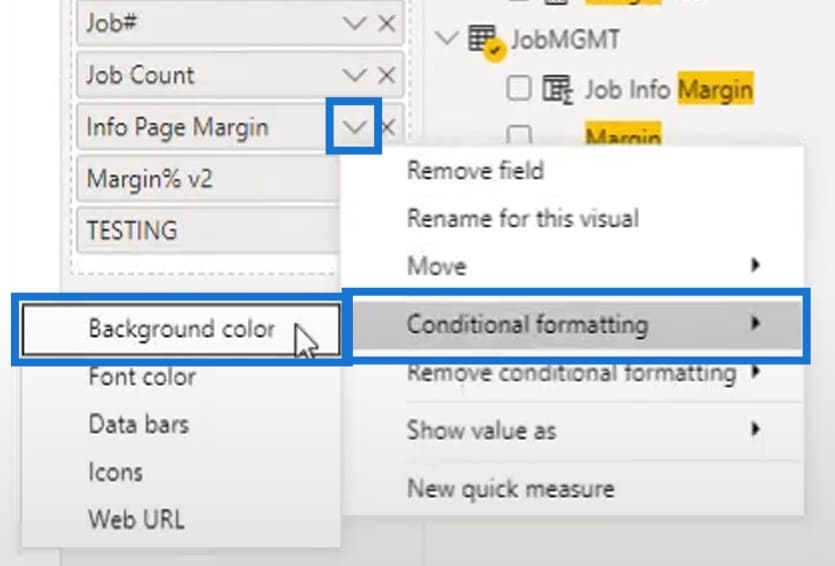
Then, there will be different options here. In this example, I used the Rules options.
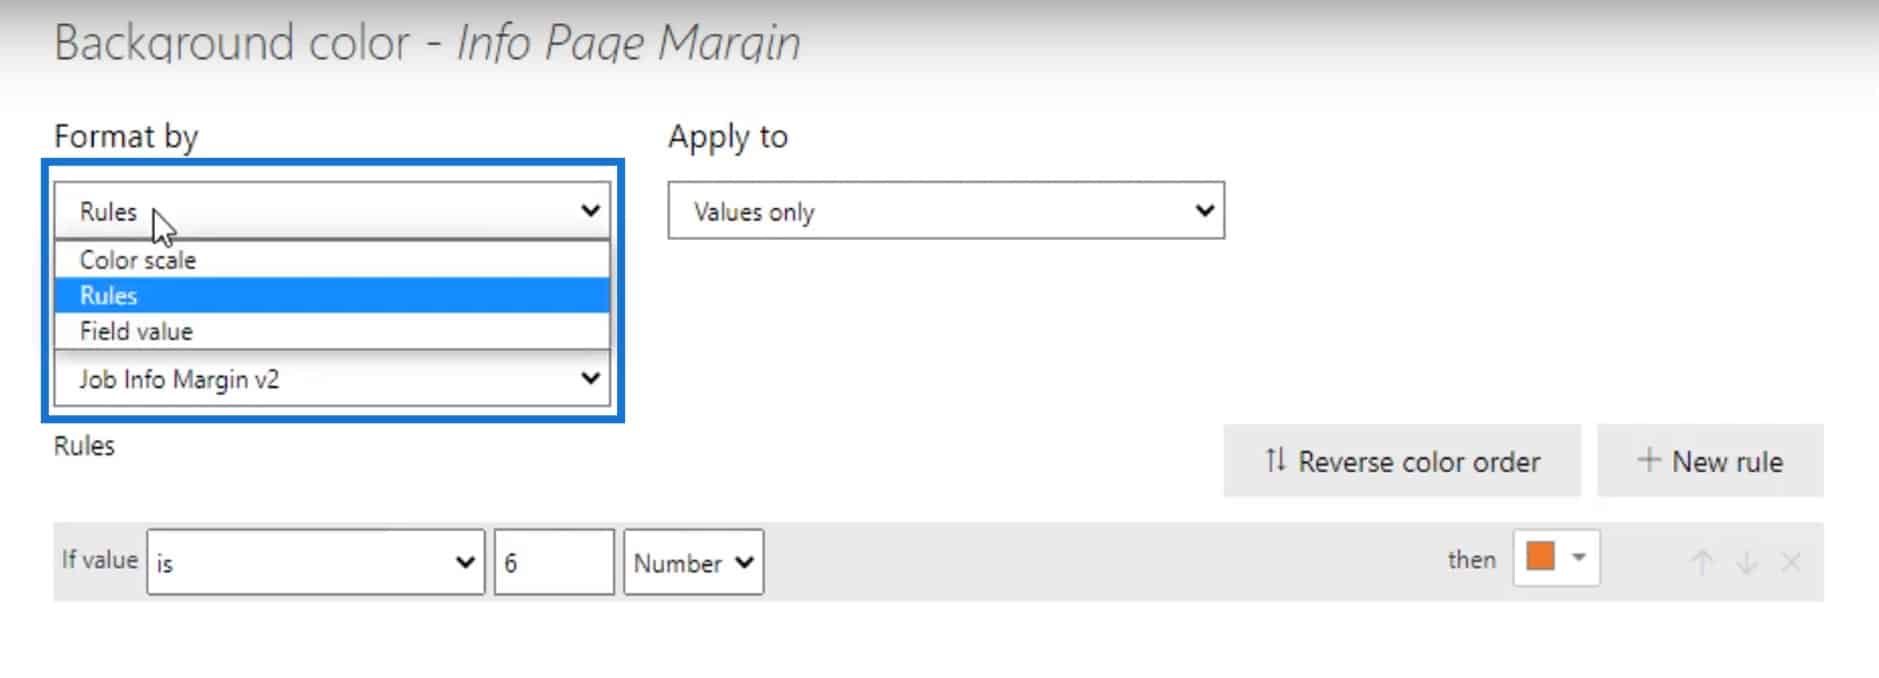
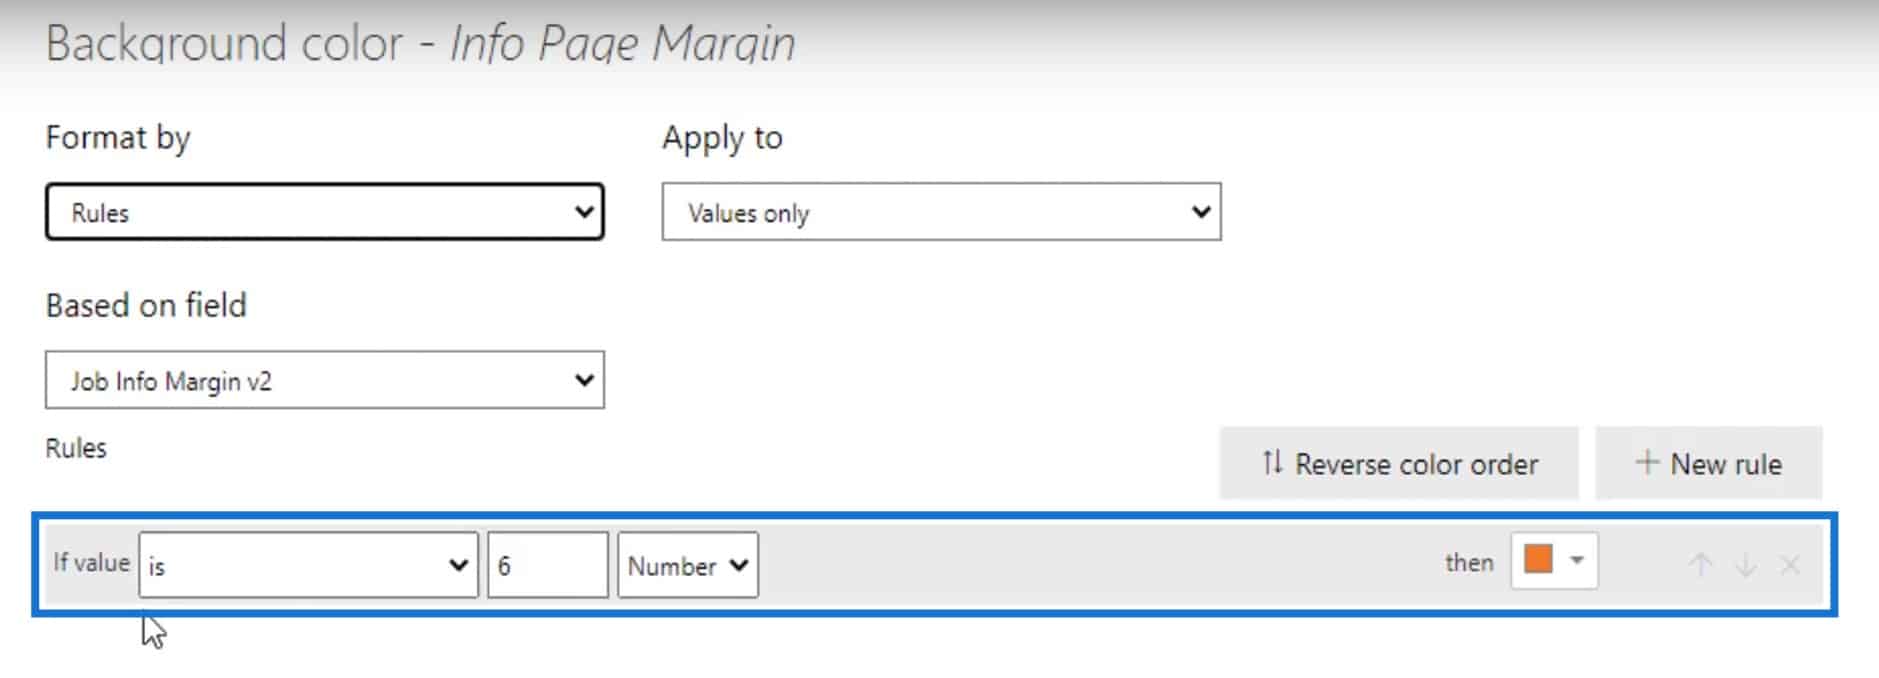
From there, I set a rule where if the value is 6, that result from the Info Page Margin column should be highlighted with an orange background.
With the previously mentioned calculation and conditional formatting setup, the numbers under the Info Page Margin column were highlighted incorrectly. As you can see, the numbers under Margin% v2 and TESTING columns matched but the numbers in the Info Page Margin column were still highlighted.
So, I had to use the ROUND function for it to work correctly.
Conditional Formatting Using ROUND Function In Power BI
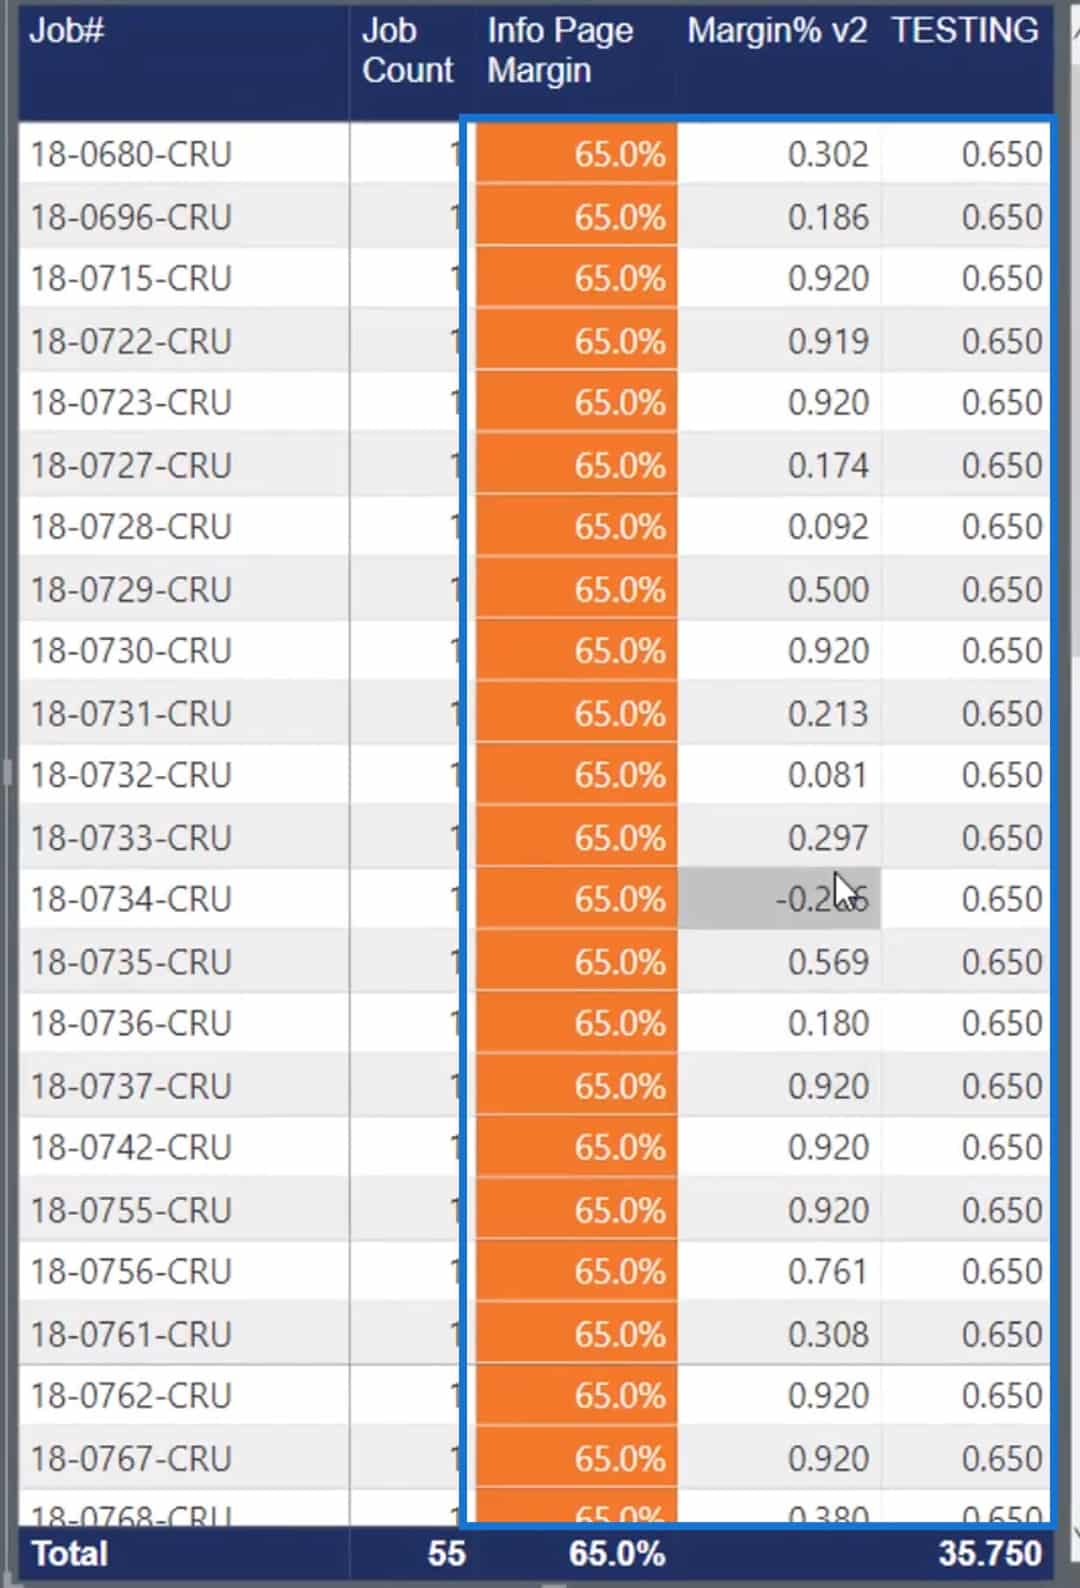
I created another measure that I named Job Info Margin. The formula that I used in this measure is almost similar to the previous one. However, I used the ROUND function in this formula. I also used 3 as my num_digits. That means I want to round it to 3 decimal places.
By doing that, all the numbers in the Info Page Margin column are now highlighted in orange. That’s because the numbers in the Margin% v2 and TESTING column didn’t match.
As I scroll down the table, I can see that there are rows where the Margin%v2 and TESTING column matched. Therefore, it didn’t highlight the numbers under the Info Page Margin.
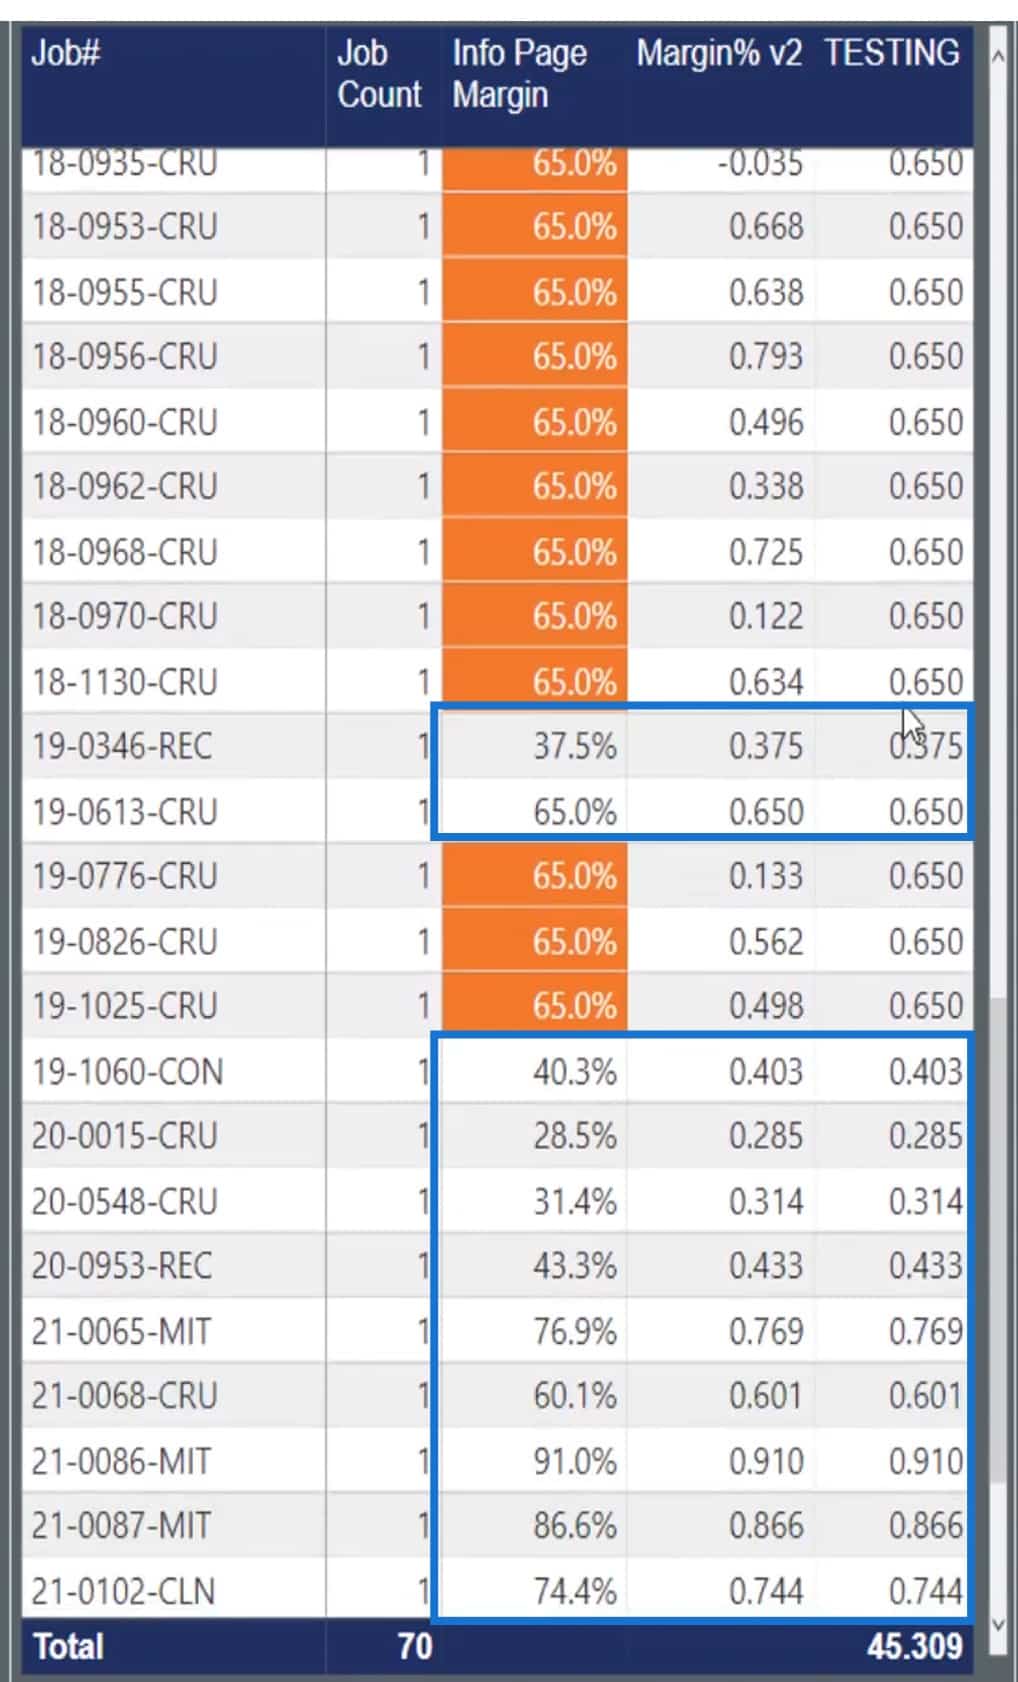
And that is the correct output that I need. Hence, with the help of the ROUND function, my conditional highlighting is now working correctly.
***** Related Links *****
Calculate Percentage Margin In Power BI Using DAX
Custom Conditional Formatting Techniques In Power BI
Showcase Unique Insights Using Conditional Formatting In Power BI
Conclusion
On a final note, the ROUND function in Power BI is definitely valuable when it comes to conditional formatting. For those who are familiar with Excel, you’ve probably had some experience at some point using the ROUND function. But here in DAX, if you ever encounter an instance where you’re stuck with analyzing why two numbers or percentages don’t match, try using this function.
I hope this helps you in your future DAX endeavors.
Check out the links below for more examples and related content.
Thank you!
Jarrett


