I’m going to show you how to create custom tiebreakers when using RANKX in Power BI.
Getting a tie in a critical portion of RANKX results is a common scenario. There are a number of tiebreakers you can use but it’s important to choose the one that makes the most sense for each situation. You may watch the full video of this tutorial at the bottom of this blog.
The Role Of RANKX In Power BI
I have a habit of comparing DAX functions to jobs in real life. This helps me associate each function to what it does within Power BI.
RANKX evaluates and puts elements in order according to a specific set of criteria. In the real world, it can be compared to a judge in a dog show who asks the participants to line up accordingly.

In the scenario I’ll be using today, I’m going to use RANKX as a judge for a hypothetical sales contest. The data involves numbers from a sales team and the prize goes to the person with the highest Total Sales for the month.
To keep things interesting, let’s pretend that the 1st prize is a Cadillac El Dorado while the 2nd prize is a set of steak knives. That’s a huge gap in value, which means there could only be one winner.
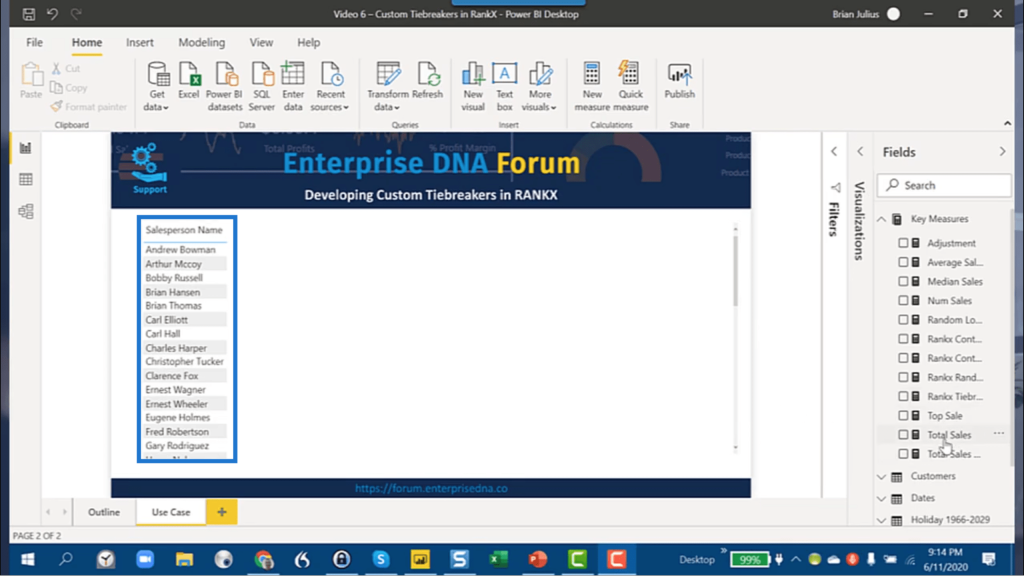
Looking at my table, I have a list of every Salesperson in the Sales team.
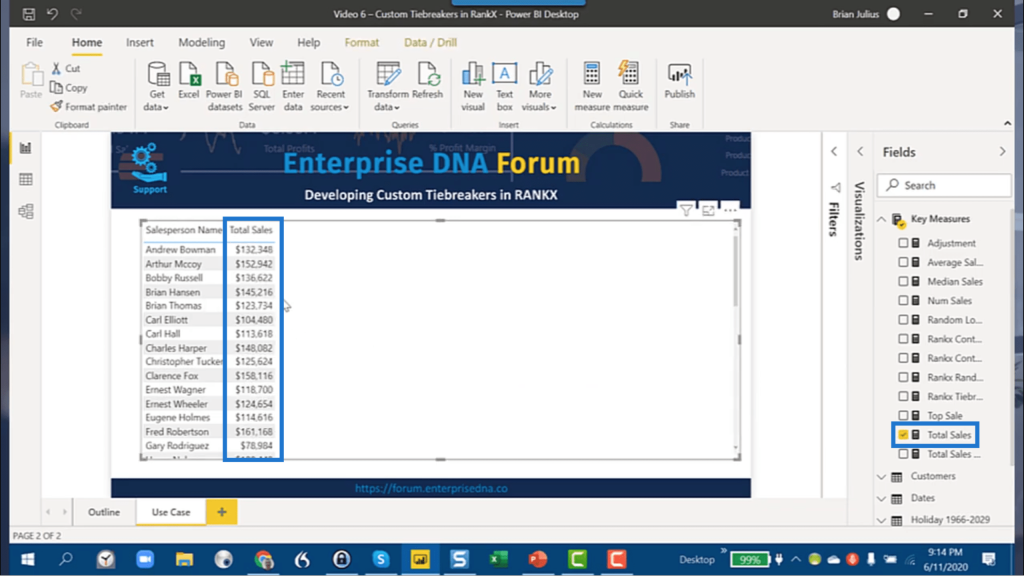
I’ll add the data for each person’s Total Sales.
This is the RANKX measure I’m applying to this table.
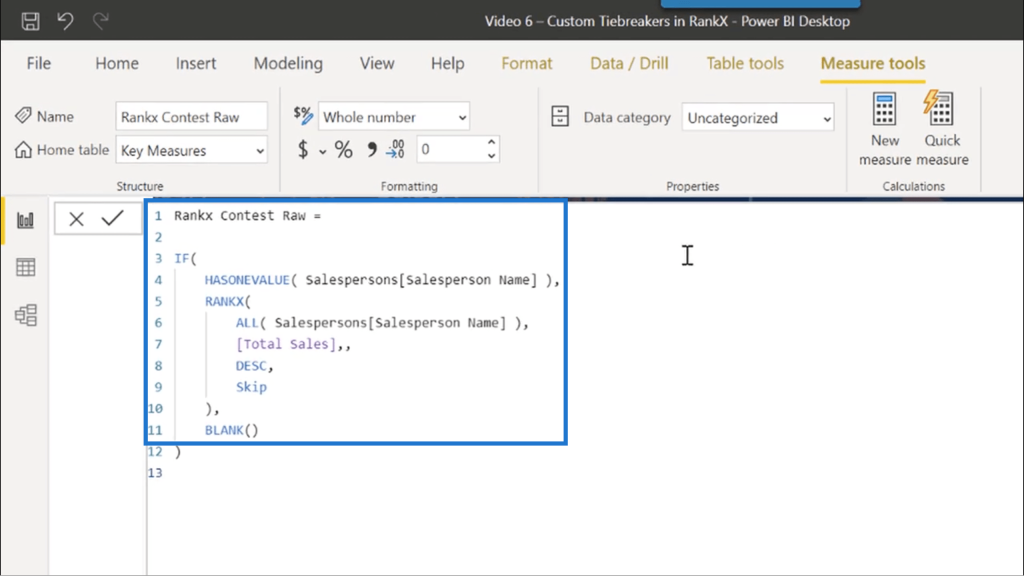
It’s just a basic RANKX configuration that uses HASONEVALUE so that I don’t end up including the Total when I sort the ranks.
ALL of the Salespersons are ranked based on the Total Sales. These are arranged in DESC order. Here, I’m using Skip in case there’s a tie.
Some may use Dense instead of Skip, but in this case, neither actually helps.
Skip Versus Dense
To demonstrate how Skip affects the measure, I’m going to drag and drop the Ranks into the table.
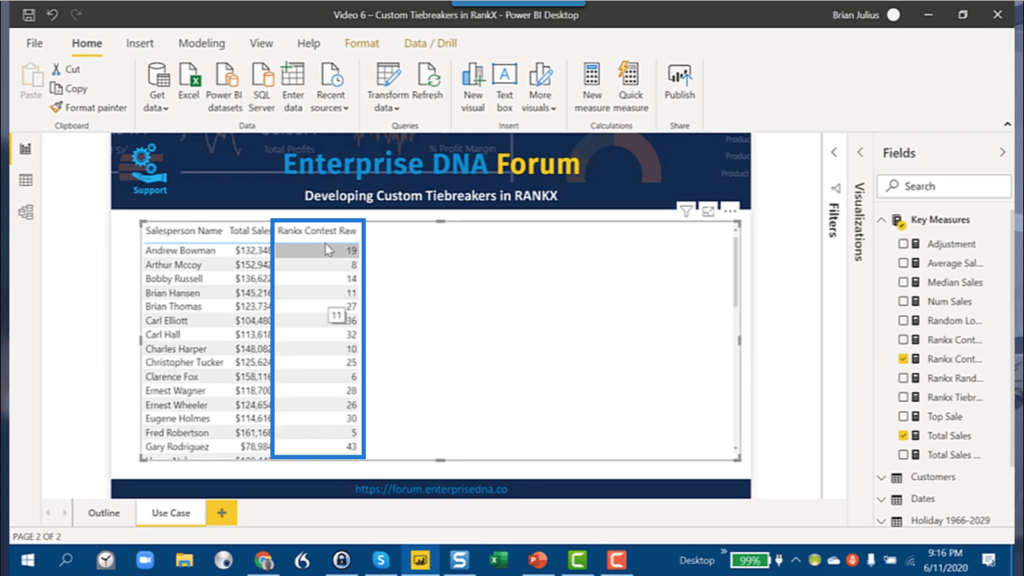
Then, I’m going to sort the data according to Rank.
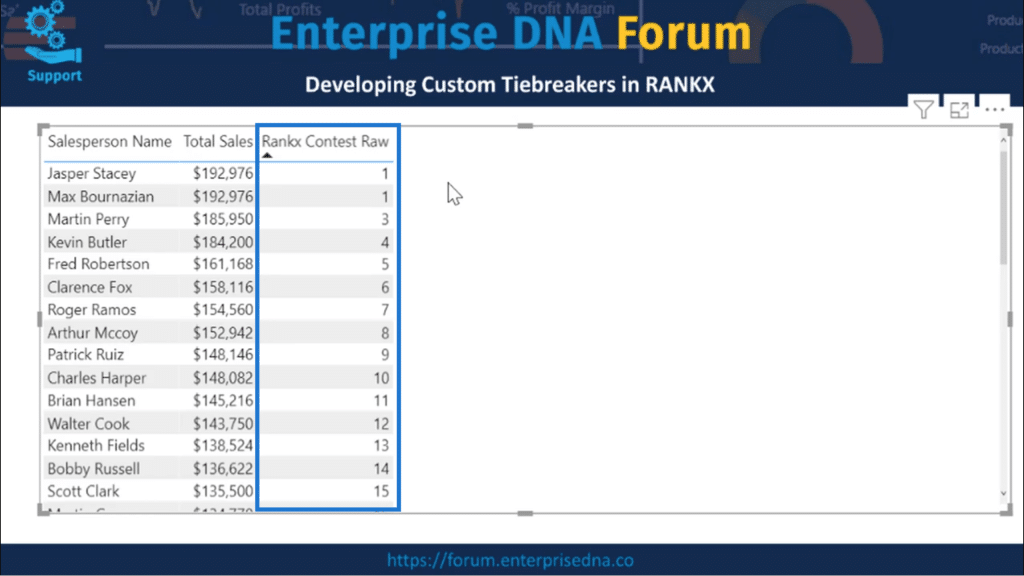
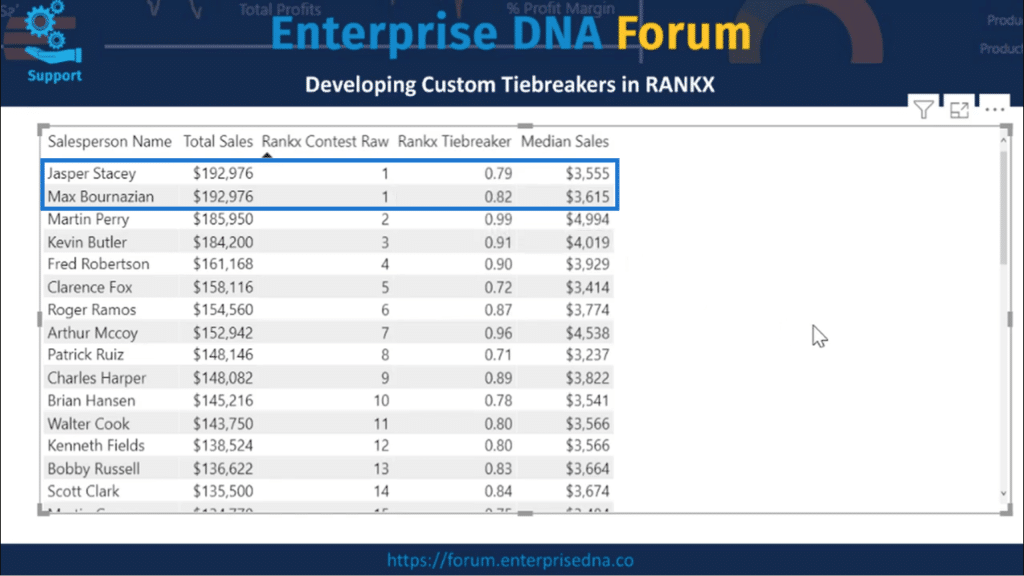
The table shows a tie for the number 1 spot. But it has not been a great month for the Sales team, so the manager can’t afford to give away 2 Cadillac El Dorados. This means I need to come up with a tiebreaker to decide who gets the car and who gets the steak knives.
Jasper and Max are on top, tied at number 1. Because I used Skip, you’ll see that the rank jumps to 3 after the two 1’s on top. This doesn’t work for me because it still leaves me with 2 winners.
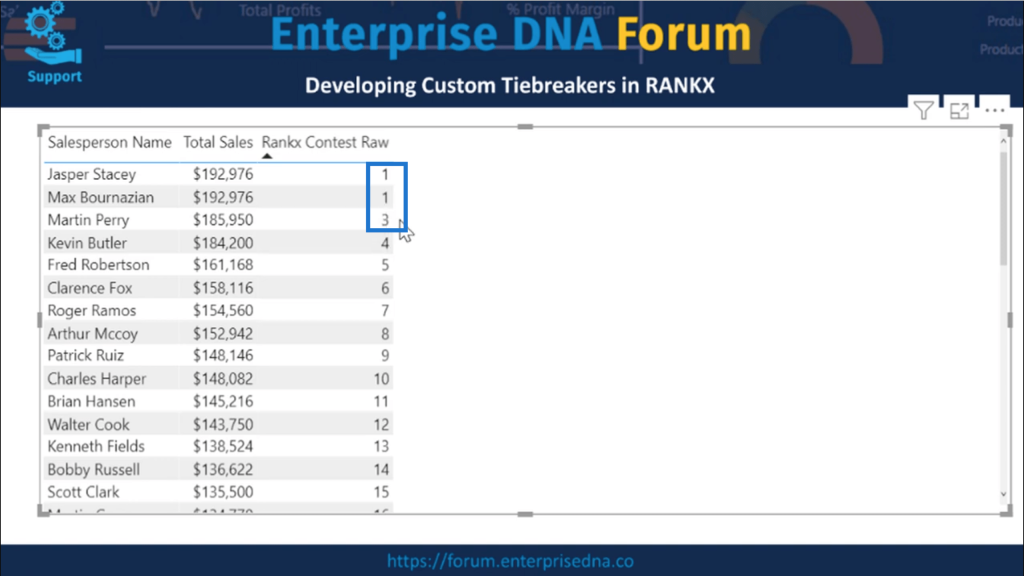
What happens if I use Dense instead of Skip?
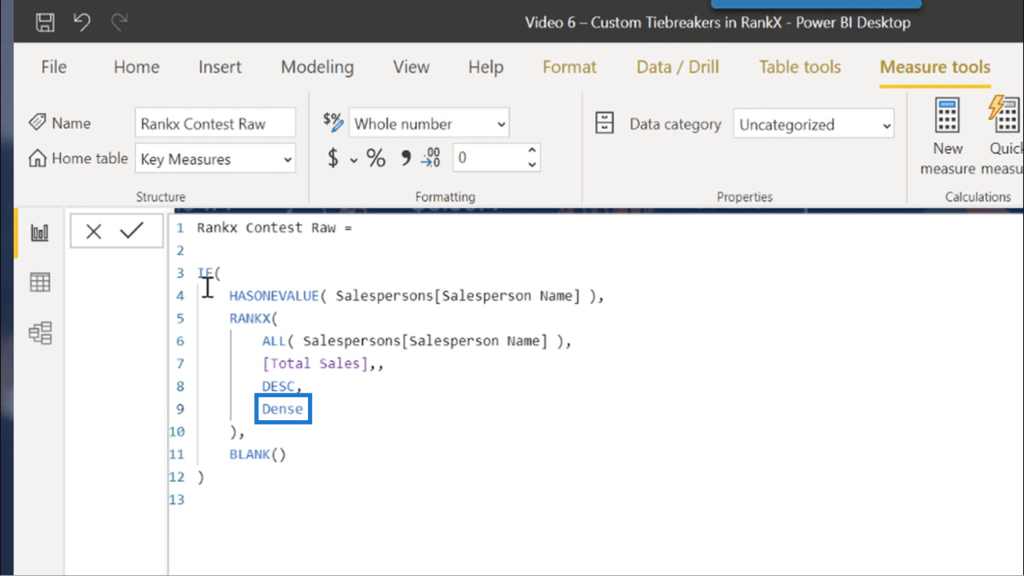
If I use Dense, the tie itself is not affected. But instead of number 3 after the tie, it shows the number 2.
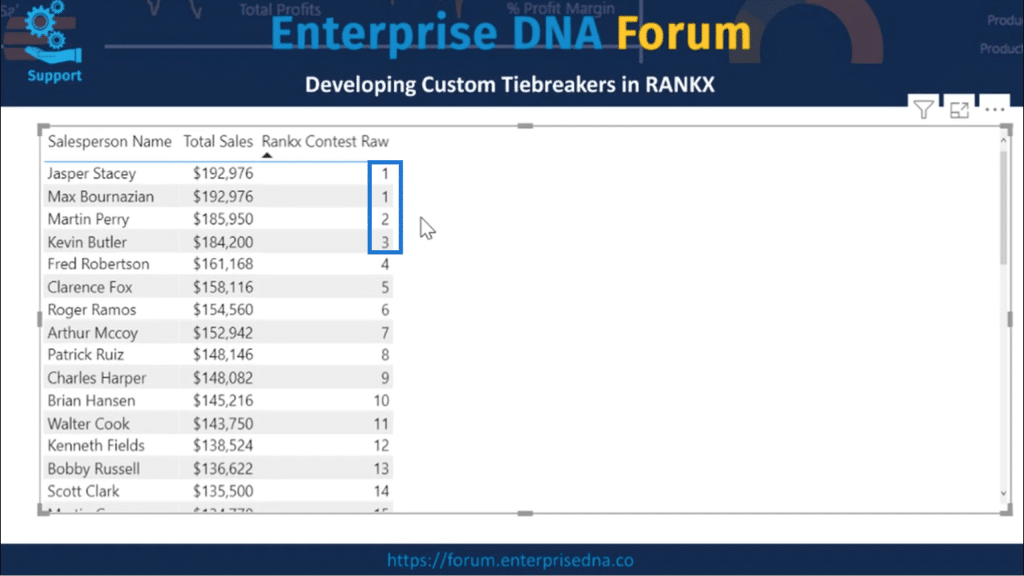
Evidently, Dense does not work in this case either. This means that I would need to apply a custom tiebreaker.
Choosing A Custom Tiebreaker
A good custom tiebreaker is defined by two main characteristics.
Firstly, it needs to meaningfully differentiate the tied elements. It has to be a factor that separates the two or more elements that are tied.
Secondly, it should not alter the rank or order of the elements that are not tied.
Thinking about these two aspects, it’s easy to come up with a number of tiebreakers.
Total Sales is our primary ranking factor.
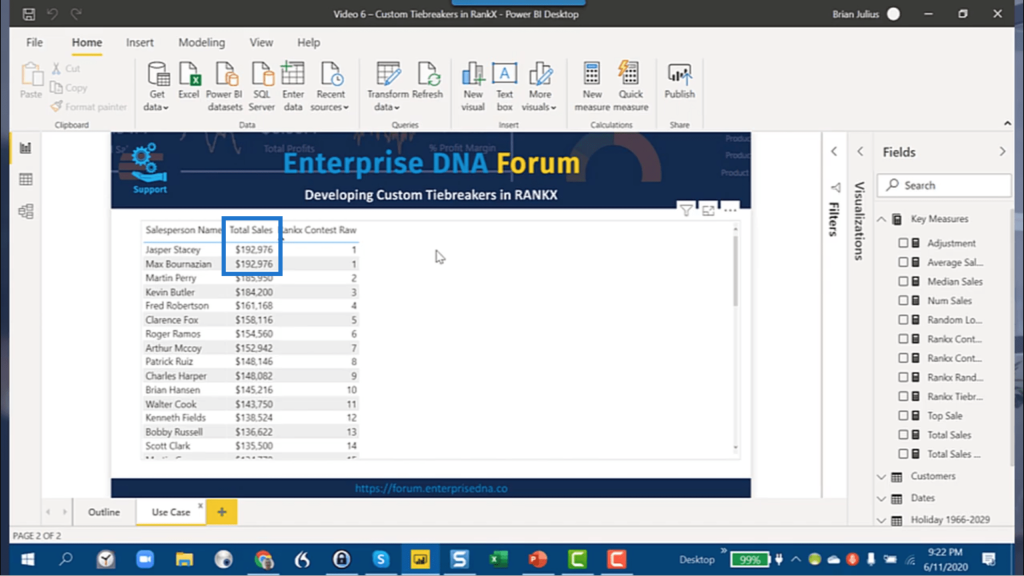
So I have to think about other factors that could be used to break the tie caused by the similar data on the top 2 rows.
The number of sales could be one. Who’s hustling the most? Who’s been getting the most number of customers?
It’s also possible to look at the maximum sale by checking who landed the biggest accounts.
I could also look at the average sales.
In this case, I decided to go with the Median Sales. It’s not as influenced by outliers coming from either the high or the low end. This means it can give a better measure of central tendency.
Creating A Custom Tiebreaker
There’s a fair amount of DAX in crafting the tiebreaker, but the concept is simple.
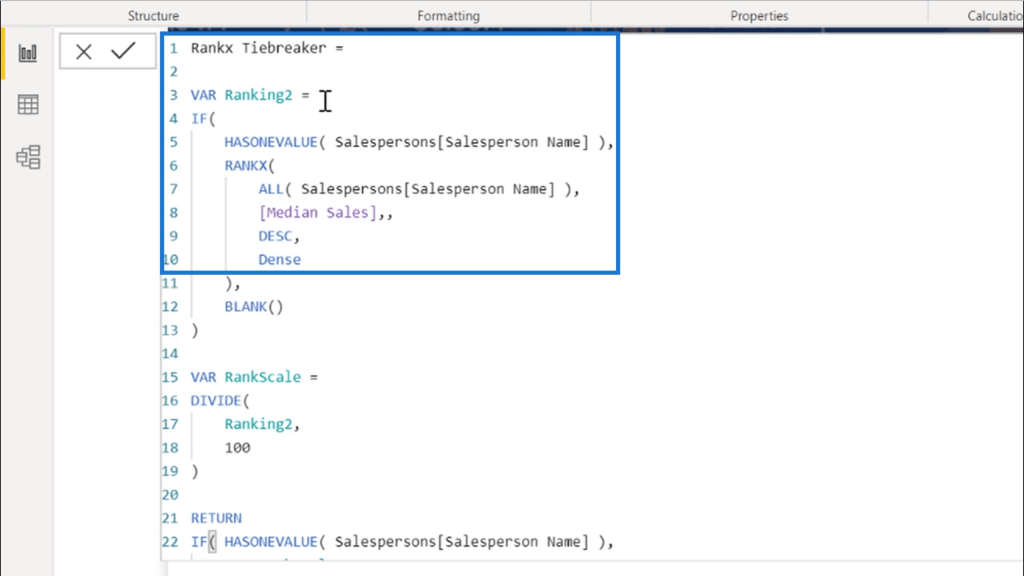
I have Ranking2 as the variable. I also used HASONEVALUE for the same reason I used it in the primary RANKX pattern earlier. The only difference here is that I’m using Median Sales this time instead of Total Sales.
Next, I’m taking the result of that variable and dividing it by 100.
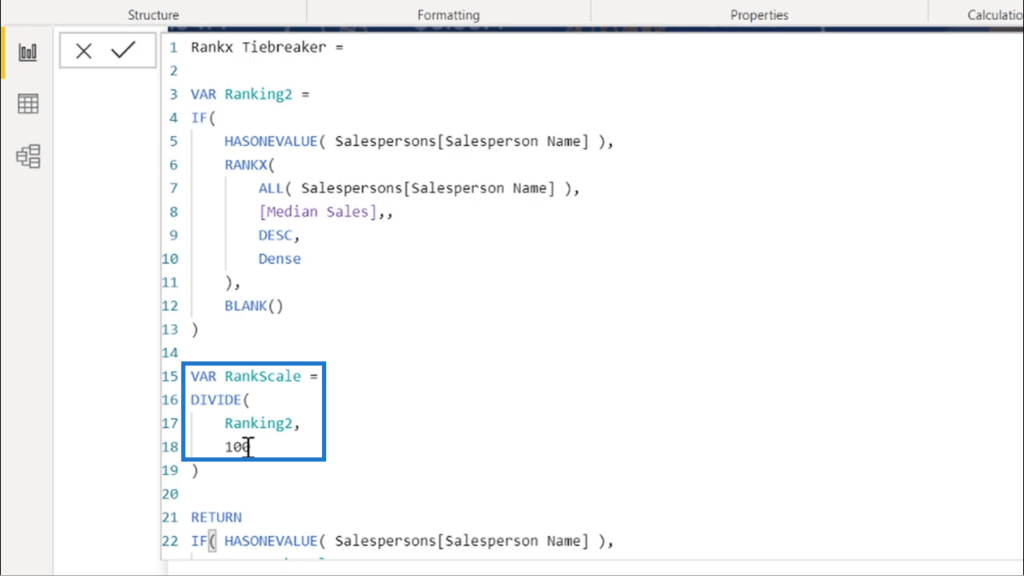
Because I have whole numbers in my Total Sales, I can play with the 1st and 2nd decimal places to break the tie. Dividing that by a hundred takes the numbers beyond the decimal point so that it differentiates the tied numbers on top without affecting the rest of the results.
This leaves us with the top ranks showing 0.01, 0.02, and so on. So I’m going to flip that around so that the top ranking gets the highest score on the tiebreaker.
So within HASONEVALUE, I’ll subtract the RankScale from 1.
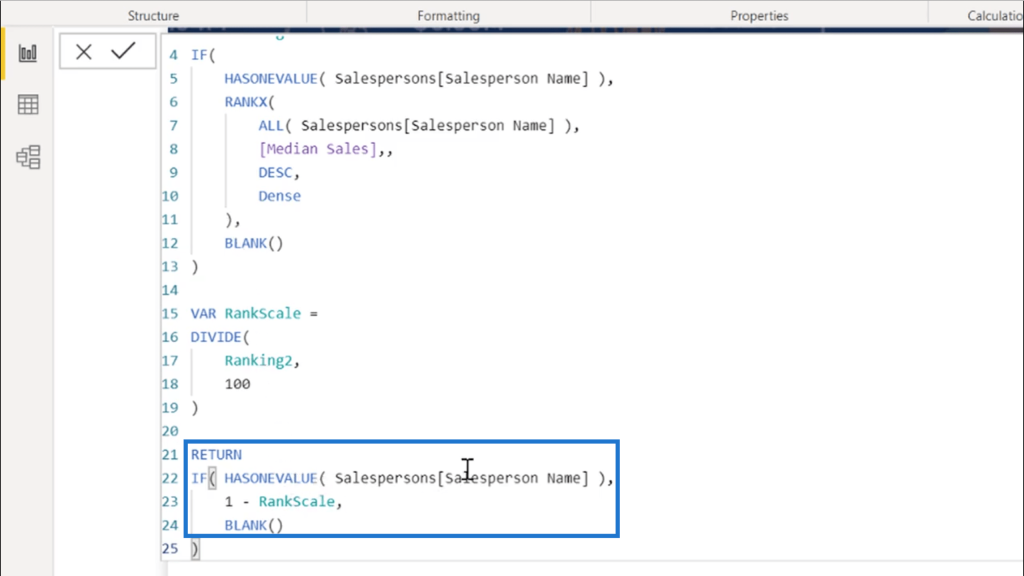
When I apply that to the table, you’ll see that I now have two decimal points under my RANKX Tiebreaker.
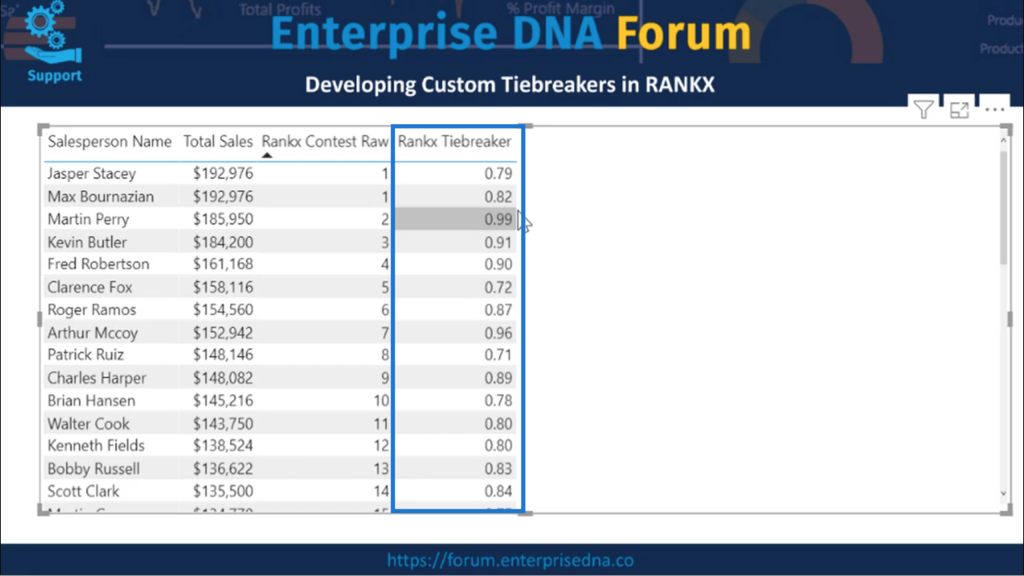
I’m also going to drag my Median Sales into the table to show you the impact of our tiebreaker more clearly.
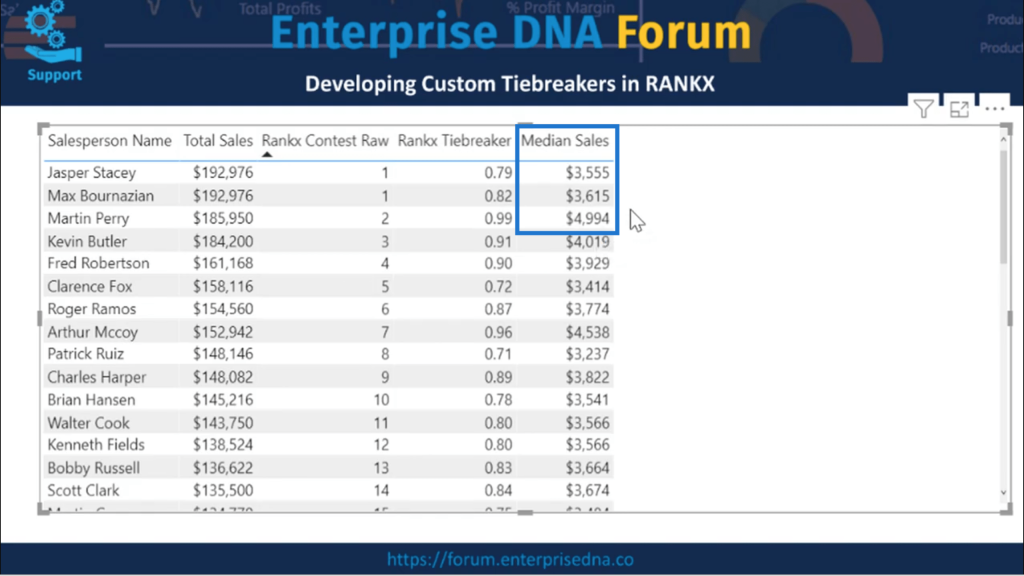
Looking at these numbers, it actually shows that neither Max nor Jasper got the highest scores. It was actually Martin Perry.
But remember that this is just a tiebreaker, and the Total Sales still remain as the primary ranking factor. This means that I should only be comparing the numbers for the tied rows.
So I’ll just add my Total Sales and the RANKX Tiebreaker to get the figures for the Total Sales Tiebreak column.
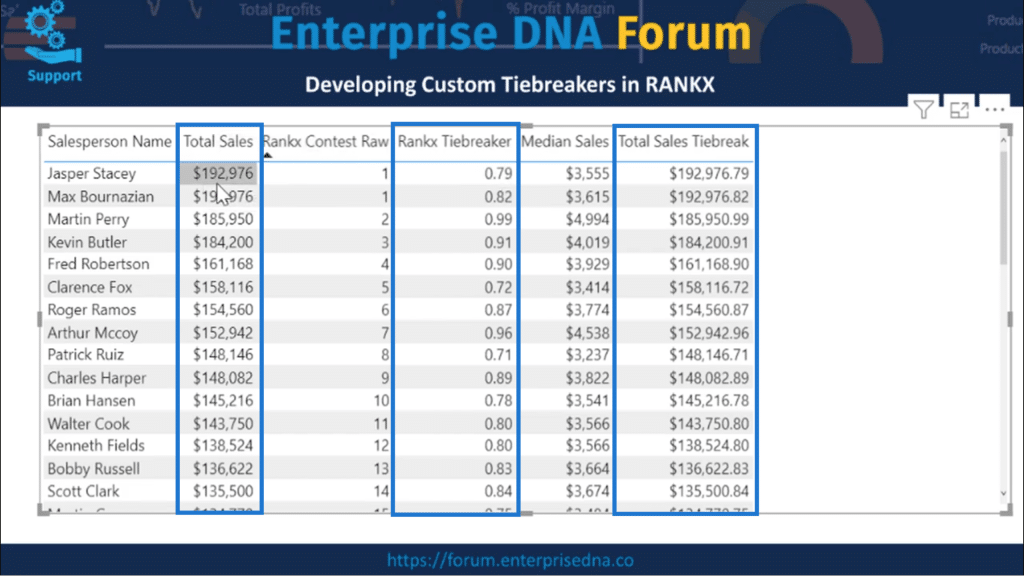
I’ll run RANKX on the new Total Sales with the tiebreaker applied and sort the data.
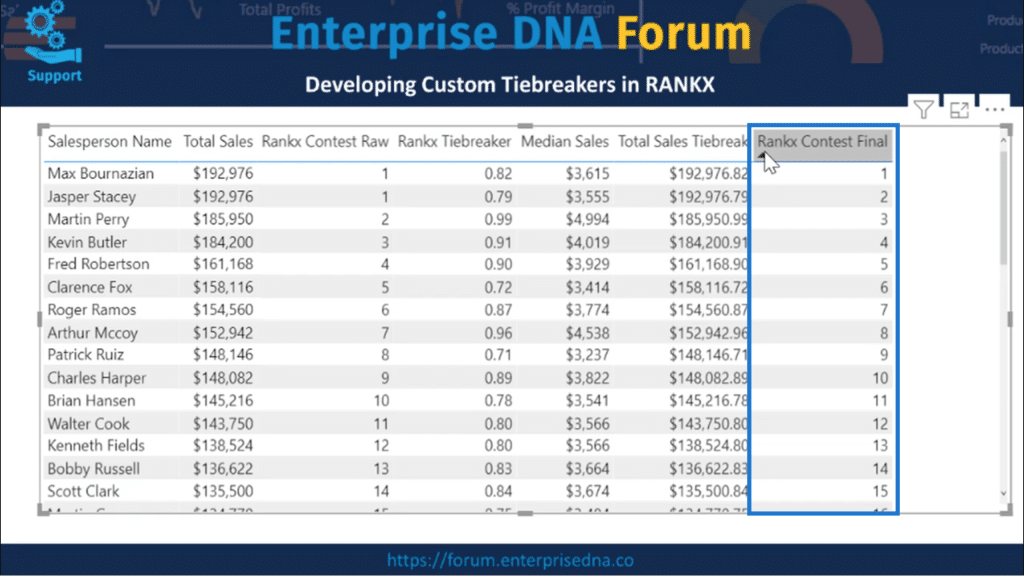
Now, it shows a full run from 1 through n with no tied elements.
Using The RAND Function To Break Ties
There may be cases where a random generated number can serve as a tiebreaker.
One example would be if you want a focus group that includes a random selection from the top 20 salespeople. If there are ties within the group, it’s reasonable to just use a random number as a tiebreaker.
But the problem with Power Query and DAX in general is that random functions behave differently. You will not get the results you’re expecting especially if you use RAND within an iterating function.
RAND returns a random number between 0 and 1. So if you do decide that the scenario you’re working on needs a randomly generated number to break the tie, it would ideally be done in this part of the measure.
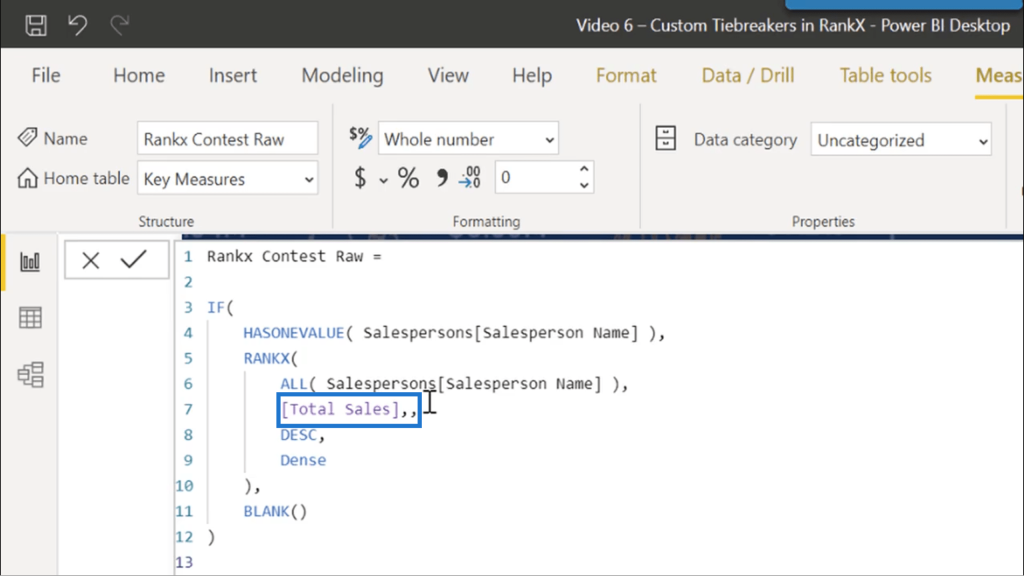
Instead of just Total Sales, this should show Total Sales plus RAND. But again, in this particular scenario, it will not give me the final ranking outcome I need.
***** Related Links *****
RANKX Considerations – Power BI And DAX Formula Concepts
A Deeper Understanding Of Advanced RANKX
Creating Dynamic Ranking Tables Using RANKX In Power BI
Conclusion
As you’ve seen in this example, breaking a tie when you’re using RANKX in Power BI is fairly easy. The trick is figuring out which custom tiebreaker gives the most logical results.
I’m going to do more tutorials on other tiebreakers in the future, especially on using RAND in a sampling scenario. I believe that it’s worth a deeper look.
In the meantime, I hope that using this approach works for you if you’re working on a similar scenario at the moment or if you encounter something like this in the future.
All the best
Brian
***** Learning Power BI? *****
FREE COURSE – Ultimate Beginners Guide To Power BI
FREE COURSE – Ultimate Beginners Guide To DAX
FREE – 60 Page DAX Reference Guide Download
FREE – Power BI Resources
Enterprise DNA Membership
Enterprise DNA Online
Enterprise DNA Events


