Today, we will dive deep into RANKX, a scalar DAX function in Power BI that allows you to return the ranking of a specific number in each table row that forms part of a list of numbers. You can watch the full video of this tutorial at the bottom of this blog.
Sample Scenarios
We’ll analyze some of the most important scenarios, including when to reference an entire table and field name inside the RANKX function.
We’ll also examine what happens when the level of granularity decreases and when a sort order is applied over a field. Lastly, we will take a closer look at the best practice in referencing a table name or a field name along the table and how the ranking is evaluated at the back end.
RANKX Scenario 1: Customer Ranking
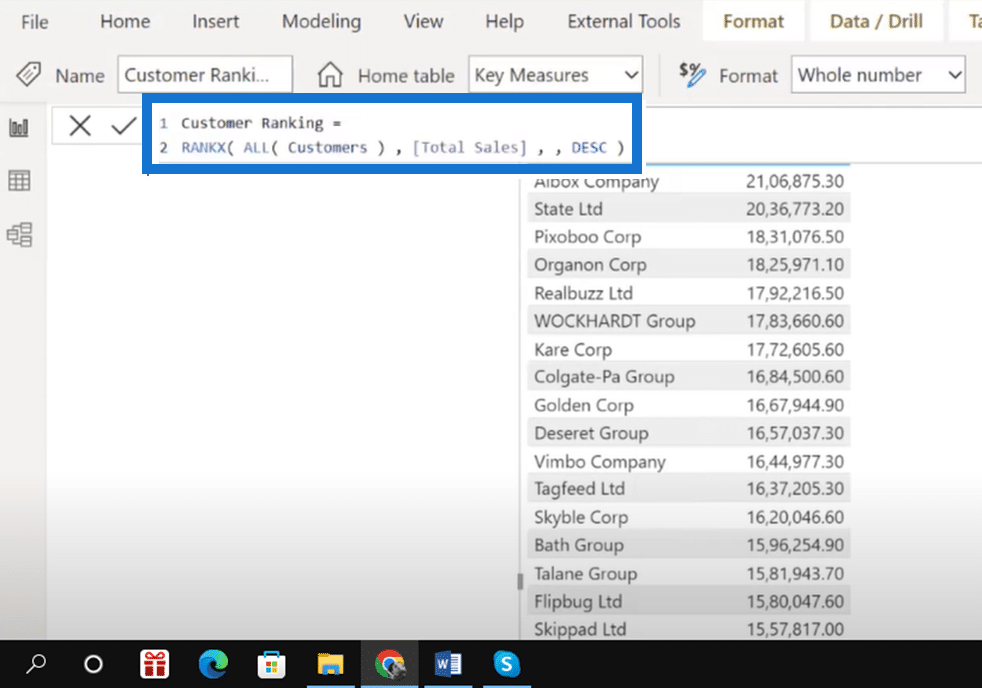
In our first scenario, we want to calculate the ranking of our customers and reference the entire customers’ table inside the RANKX function. Ultimately, we will find out how the results are evaluated.
So let’s begin by opening Power BI and clicking on the Total Sales options button under the Key Measures tab and then go to New Measure. Write a measure for the customer ranking (e.g., “Customer Ranking =”).
You can view the results by dragging the customer ranking measure inside the table.
But is this the best approach for every scenario? What if there are two persons with the same name but in different cities? Or what if we have two places with the same name but different territories?
RANKX Scenario 2: Cities Ranking V1
Now, let’s apply the same approach in the first scenario. This time, however, we will apply it over the regions table where we have two cities with the same name but in two different locations.
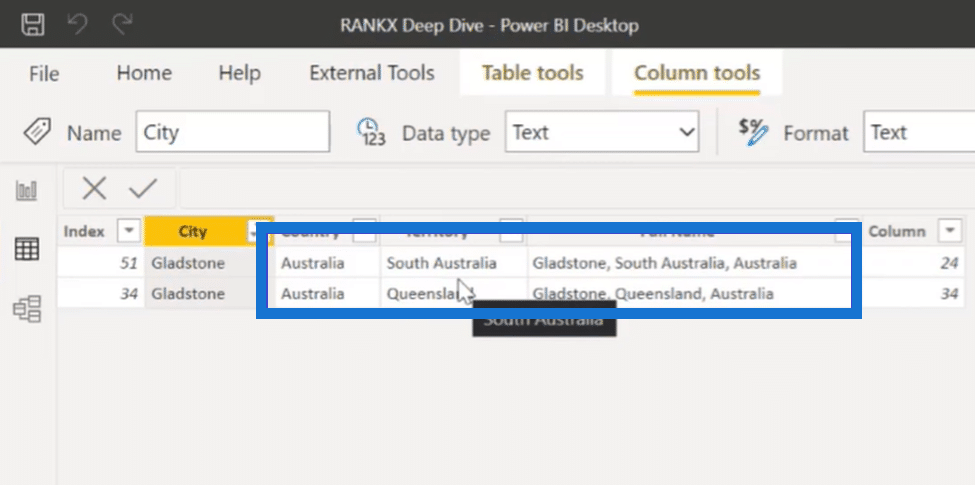
As you can see in the image above, inside the regions table, we have two cities with the same name, but they are available under two different territories. So what happens when we apply the same steps from our previous scenario?
The results will look something like this:
Now we start to see a problem with our ranking formula. Since the RANKX function is iterating over an entire set of tables, it cannot consolidate the results for the cities with the same name, which are available under two different territories. This ultimately results in an error.
To solve this problem, you need to reference the field name inside the RANKX function and the table name, just like in the image below.

So how did it fix the error? When we reference a field name inside the RANKX function, it will iterate it only through that column and not over the entire table.
It will remove the duplicates even though the two cities are available in two different territories, thereby consolidating them as one single city.
RANKX Scenario 3: Territories Ranking
So what happens when the level of granularity decreases?
In this case, you will see the error while calculating the ranking at a territorial level. The reason is when we reference only the table name and ignore the column name again, it iterates it over an entire table, thus, failing to consolidate the results at a territorial level.
To get the correct results at a territorial level, you need to reference the territories field inside the regions table. But when should you reference the entire table theme and include the field name along with the table?
When ranking is applied over the lowest level of granularity, we can refer to the table name and ignore the field name.
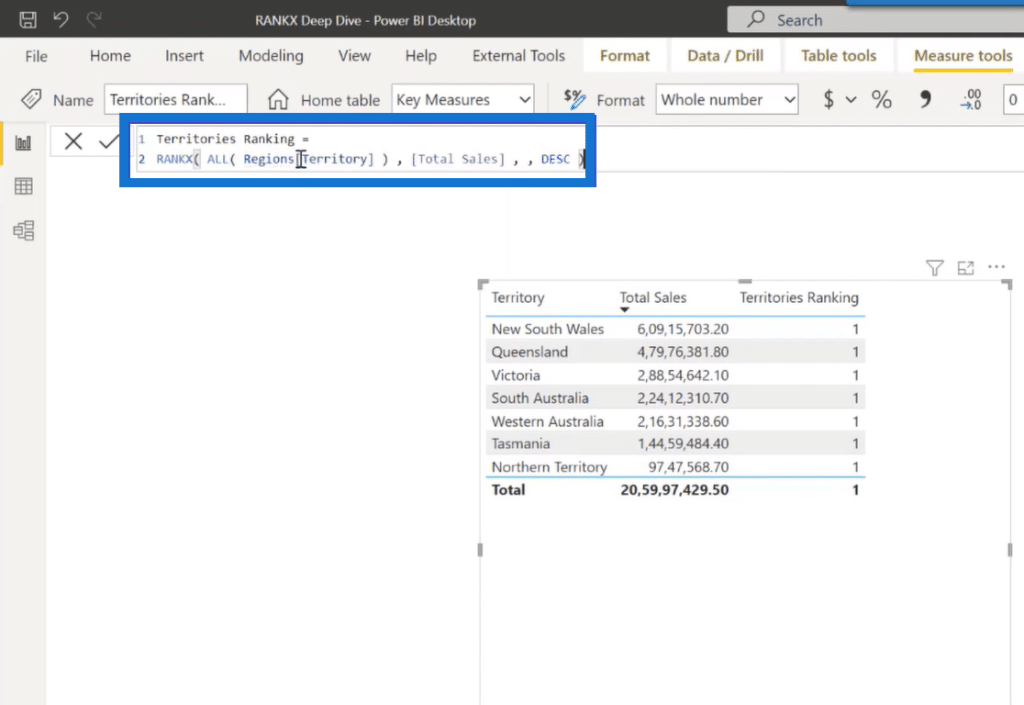
But when the level of granularity decreases, we will have to reference the column name along with the table name. So far, we are only analyzing the results in a single visual, that is, a table.
Cities RankingV2: The Better Approach Using Slicer
Let’s duplicate the second scenario where the left side of the visual will reference only a table name while the right side will reference the column name inside the RANKX function. We will then compare the results by bringing a slicer onto that page in the form of territories, which results in the image below.
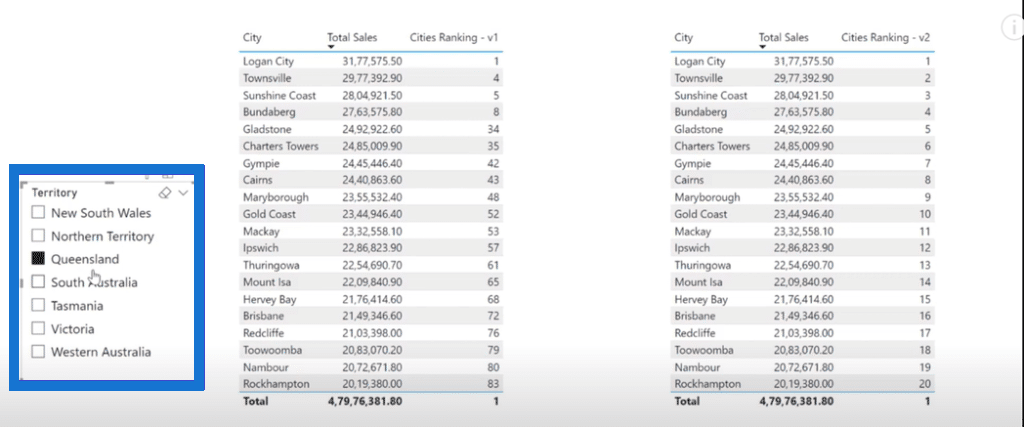
When we make a selection into the slicer, you will notice that on the left side of the table visual, it doesn’t provide the result in serial order since RANKX is iterating over the entire region’s table. On the right side of the table visual, however, you will see the results in a serial order.
The reason is that RANKX is iterating only over a specific table column, allowing it to filter out the results per the selection made into the slicer. It is also one of the most important things to remember.
If we want to see the overall ranking results, we can reference only the table name inside the RANKX function.
But if we want our results to be in serial order as per the selection made into the slicer, then we also need to reference a column name inside the function.
RANKX Scenario 4: Products Ranking
Lastly, let’s proceed with our final scenario. Let us examine what happens when we put a product order over a certain field and how the RANKX evaluates the ranking at the back end.
In this scenario, we are using products name from the products table to analyze which are our best-performing products.
So just like in the first scenario, you need to write a ranking measure for your products (in this case, well use products ranking). If you bring the products ranking measure inside the visual, you will see a result just like the image below:
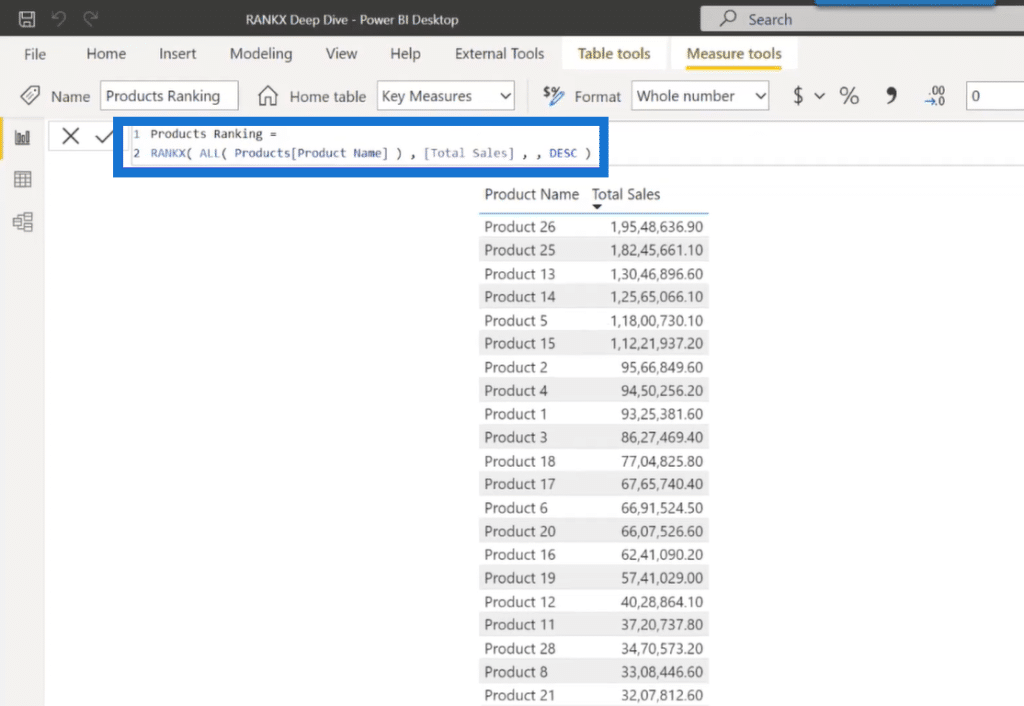
You can see that even though we have referenced our product name field inside the RANKX function, it’s not evaluating the results correctly. So why is this happening? To answer this question, we need to open DAX Studio.
RANKX Scenario 5: DAX Studio
So let’s open DAX studio and see how RANKX evaluates the ranking results at the back end.
In the image below, I’ve copied the query of the table visual via the Performance Analyzer and pasted it into DAX studio. As you can see in this query, there is also the product index, a sorting field inside the products table.
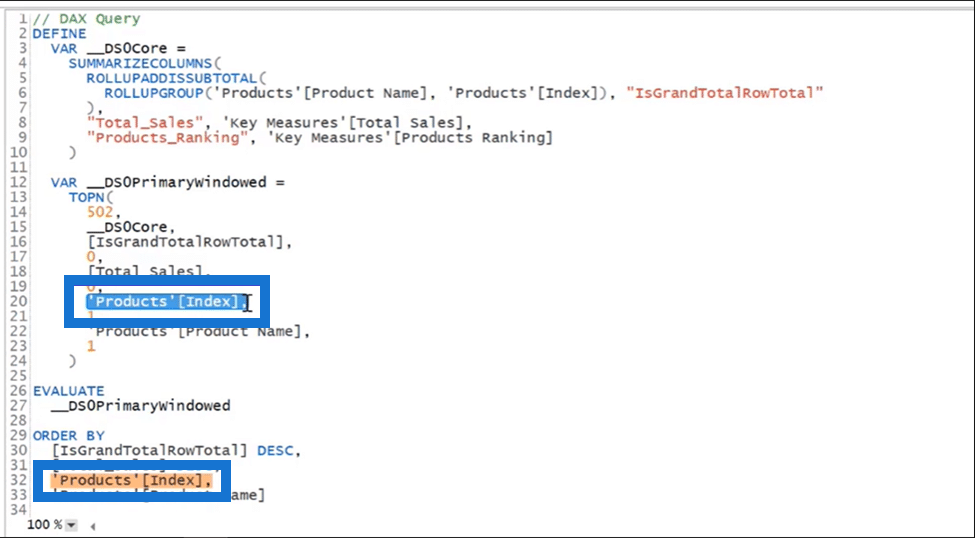
Thus, even though in our table visual we brought only product name, total sales, and ranking measure, this field is referenced by default at the back end of the ranking calculation.
So now, let’s fix our product ranking measure by referencing the sort field inside the RANKX function and see the results for the final time.
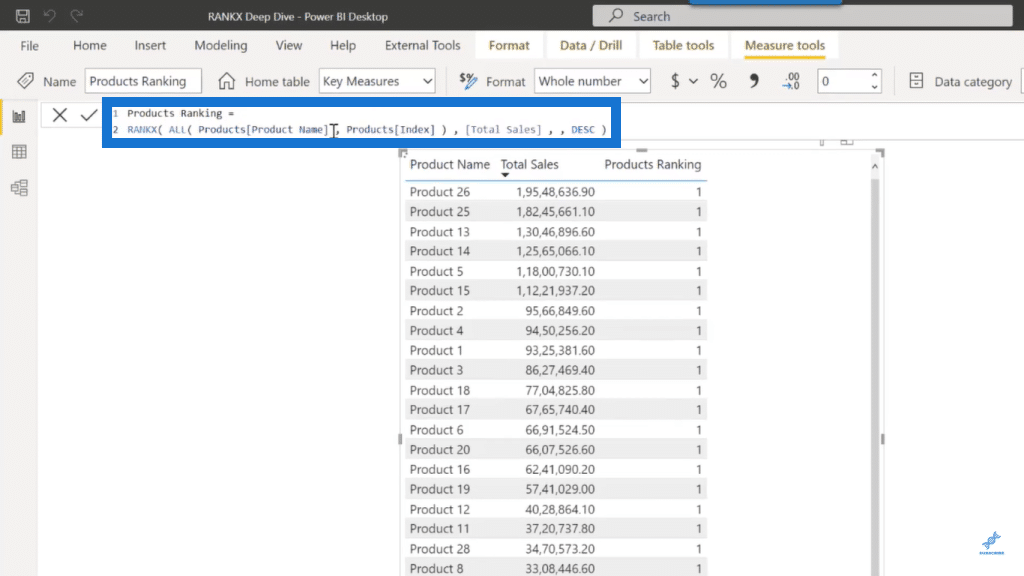
As you can see in the image above, the results for the product names are now getting correctly evaluated. Thus, whenever we have a field sorted by another field, we need to reference both fields inside the RANKX function based on all the scenarios we have discussed today.
***** Related Links *****
RANKX Considerations – Power BI And DAX Formula Concepts
RANKX In Power BI – Developing Custom Tiebreakers
Creating Dynamic Ranking Tables Using RANKX In Power BI
Conclusion
So those are some of the scenarios when using the RANKX function in DAX calculations. Overall, there are many more ways you can do it in an extensive array of functions.
The most important thing to remember is that you need to understand the context in which your RANKX function is being placed.
RANKX is exceptionally versatile at calculating any ranking type analysis inside Power BI. It also enables advanced insights that impress the consumers of your reports and visualizations.
All the best,
Harsh Anil Joshi


