In this blog post, we’ll look at communicating research and presenting those results using R notebooks. We’re hoping that what you’ll get out of this tutorial is a framework for you to report and communicate any kind of research findings using R notebooks.
There are some great advantages to doing this, particularly when it comes to the idea of reproducible research. We’ll discuss what this means and how to do it in R notebooks.

What Is Reproducibility?
The idea of reproducibility is that anybody can audit your findings and given the inputs and the processes that you used, they should be able to walk through the whole thing. There are a few ways that this comes into play for our data analytics needs: an environment that makes things reproducible, making sure that people can see what was contributed, being able to easily audit a file, and having a reproducible publisher.
Ideally, somebody can see exactly how you got to the report and how the plot or table that you used was generated so that everything is in a fully reproducible environment.
Now you may be wondering how does something like Power BI or Excel fit into this. I would say it’s midway in this reproducible workflow. When we think about power query in particular, it’s pretty good at reproducibility. Think of the Applied Steps where it’s very obvious to see the processes involved.
When it comes to visualizations and reports, this is where things get a little hairier. R Notebooks are part of RStudio. We have a course at the Enterprise DNA portal to get you up and running. This course in particular is talks about R Markdown and R Notebooks in particular.
So if you’re familiar with a Jupyter notebook, the idea is that we’re able to intersperse text and code to create a storytelling document for our research.
We’ll be able to render those results in a bunch of different outputs. Whether you need to create a PDF or render it to HTML, R Notebooks can be used for different file formats.
To start, open up your R notebook and go to File, New File, then R Notebook in RStudio. We’ll be working with an older dataset in the resources, with this really simple research question:
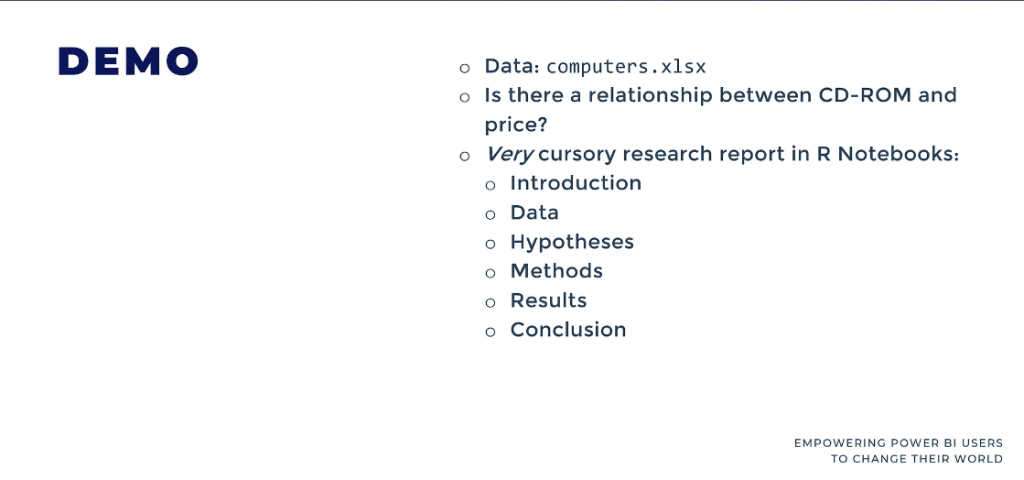
Is the price of a computer dependent at all on whether or not it has a CD-ROM?
This question is outdated, but we all have to start somewhere. We’ll also be putting the skeleton of a research report and present the research findings using this basic framework.
We’ll see something like this in RStudio, and this is what’s called an .rmd file, which is an R markdown file extension. This can be a little jarring, especially if you’re not used to it, but there is a way to preview the polished final product.

This part of the notebook is the metadata called the YAML file.
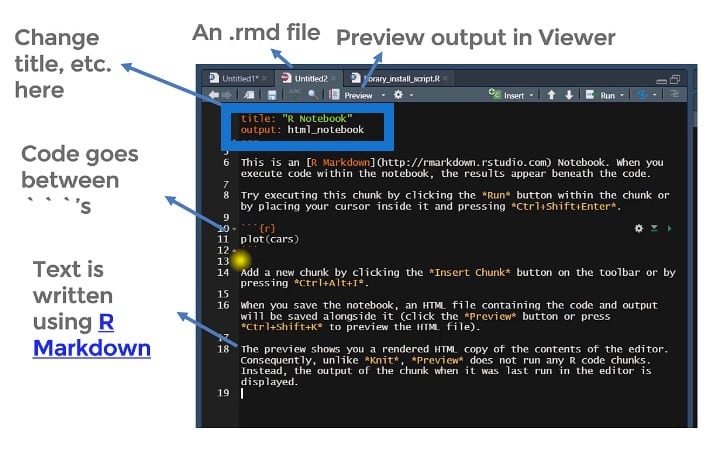
After that section are these back texts where your codes will go. Then there’s the text part of the document using R Markdown. If you’ve used Markdown before, R markdown is pretty similar. We can use things like asterisks and hash signs to mark up and render our texts.
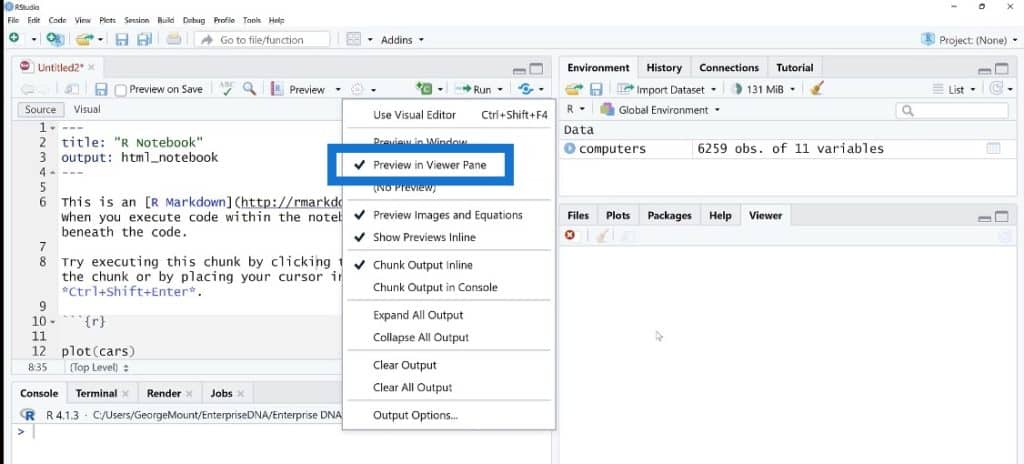
Let’s go to R Studio and R Notebooks, then walk through this analysis together. Click on the gear wheel and make sure that this says Preview in Viewer Pane.
Starting An R Notebook
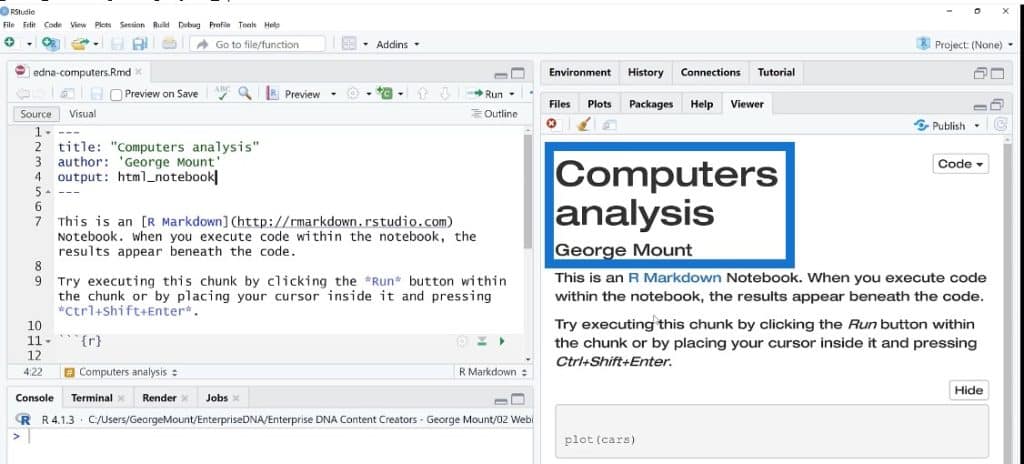
We’ll click the Preview button and it will ask us to save it. Again, this is an RMD file so we will need to save it first. Over on the left pane, we’ll see the rendered output. Now, if we were to change anything here and say something like Computers analysis and add an author name like George Mount, it will need to go in quotes.
Once we click on Save, it will automatically update to this.
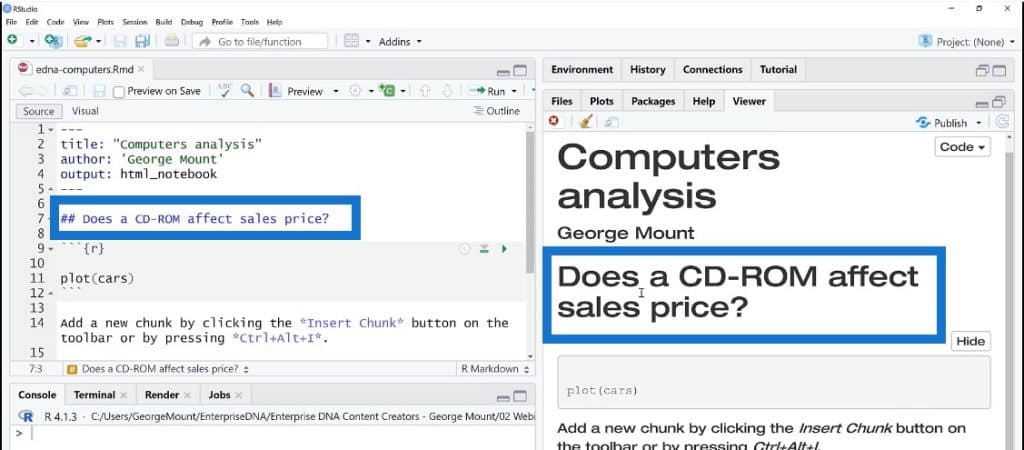
So let’s play around with this. There are already a couple placeholders here, which is fine. The first thing we’ll do is to type “Does a CD-ROM affect sales price?” When we save this, it will be Header1. But if we are to turn this into two hash marks, it will turn into Header2 and it will be smaller.
The next step is to do an Introduction, where we can input why this stuff matters. For example, we can say that CD-ROM is the next best thing or something like that. If you’re working on consumer reports or working at a marketing department, you’re trying to get a sense of what features are really important or what consumers are looking for.
We’ll call on R packages and get started. The one nice thing that I love here is that we can actually use HTML in R Notebook. For example, if we want to leave a comment to ourselves, we can do something like this.
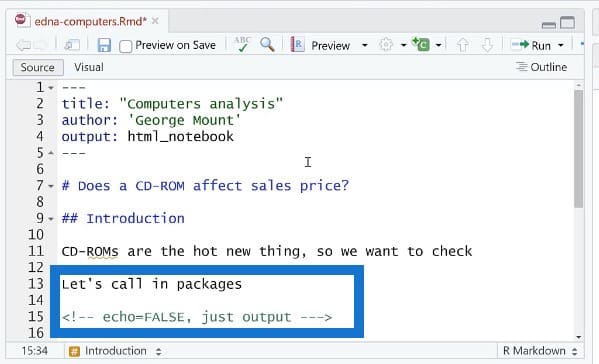
When we save this, it is not showing up at all. So we’re just leaving this as a comment to ourselves in the text. This is something that I wish we could do in places like MS Word.
Introducing The Packages In R Notebooks
The next step is to use this code plot here and add a couple of settings. We can use Python and SQL, but we’re using R for this example.
We’ll read all of the packages that we need. If you don’t have these on your computer, you may need to install them.
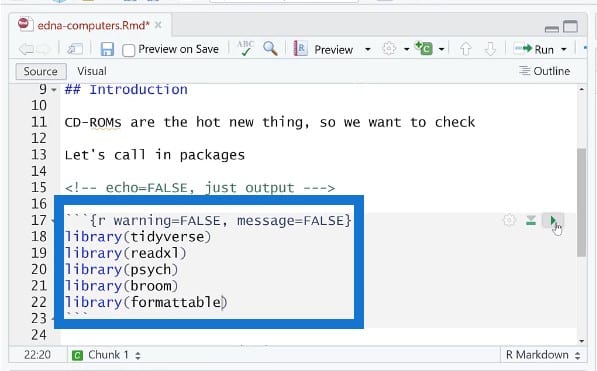
Again, this is not a full report. We’ll walk through a skeleton to show you a couple of things to know about R Markdown.
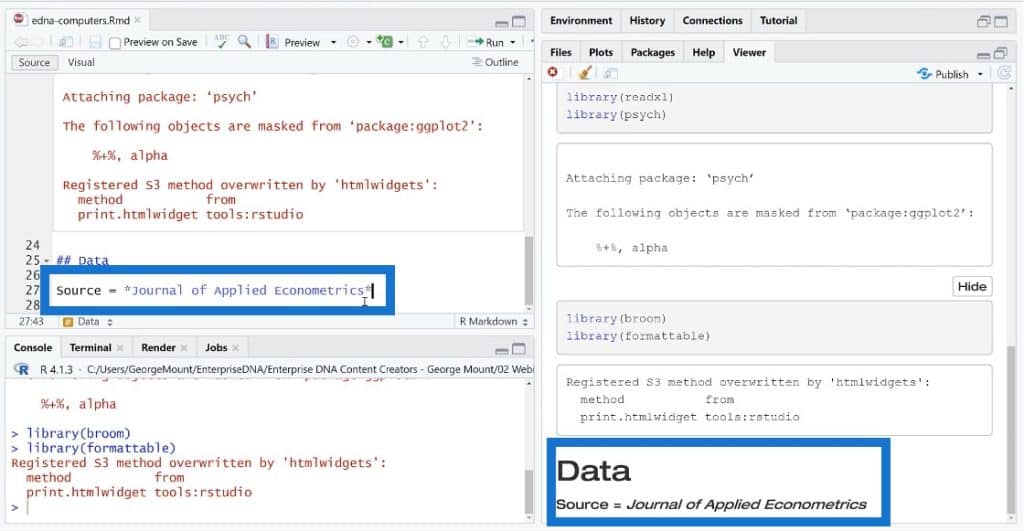
So now we’re going to introduce where we get our data, and what makes it important. In this case, we could say that our source is the Journal of Applied Econometrics. When we do this asterisk thing, it will turn it into italics.
Then we’ll read a file in Excel and use R to bring it in. As you can see, the data already looks pretty good, which is another cool thing about R Notebooks.

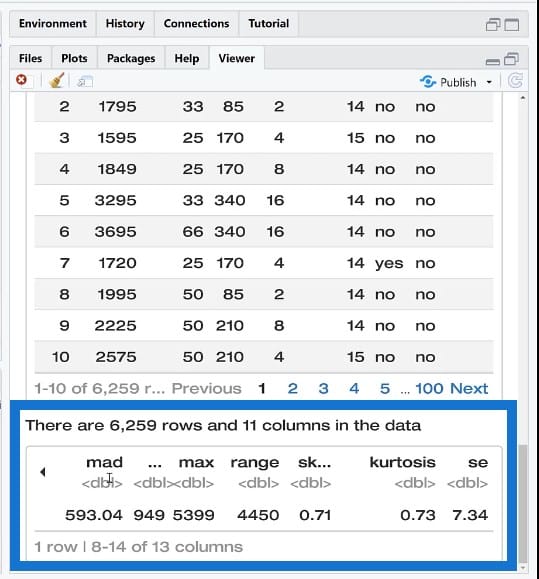
Depending on the output format, this could even show up. If you’re using HTML, your user could actually thumb through the data and do some basic interaction. It’s great that we’re really able to do these in live documents.

Adding A Dynamic Reference In R Notebooks
Now let’s say that we want to include a dynamic reference in the text of the data. We want this to update regularly because this might not be the same every time we’re on the report, right? So we’ll make a dynamic reference here in line, right in the text.
There is a cheat sheet and reference guide for all of these codes. Go to Help and select the one for R Markdown so you can look up all the different settings. It’s probably not worth trying to memorize them because there are a lot and you can just use this instead.

We’ll insert the R chunk again and include FALSE, nrows, and ncols.
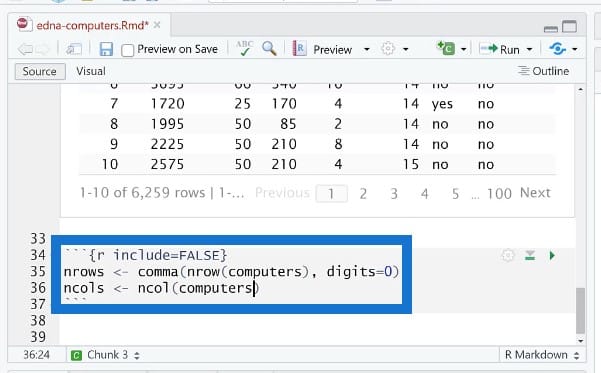
Once this has been run and executed, we could even go to the R environment to see that if it has been turned into objects.

Another thing that’s nice is if you’re just throwing around ideas and you want to know what it will actually look like, you can just use the console down at the bottom. We can run it at the console and see what the output looks like.

We’ll go back to our viewer pane. Now this section here is not showing up in the report at all. This is nice if you want to use some object, but don’t want to show any of the code.
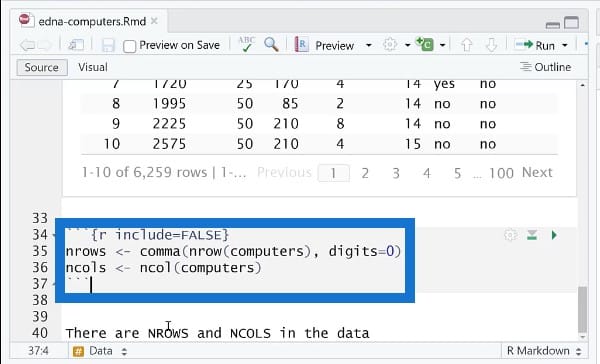
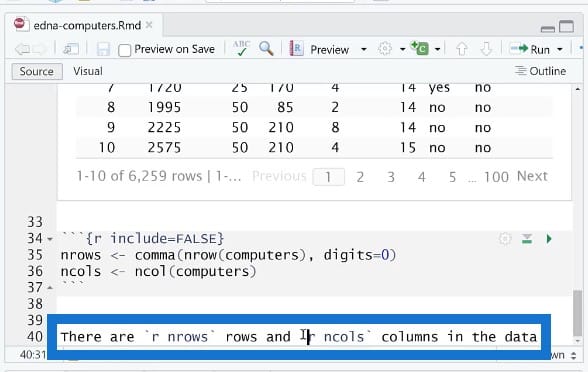
We use these back texts on nrows and ncols to keep things dynamic. If you have a PDF report and you need to automatically change these numbers, instead of hard coding them week after week, you can use these inline references.
We’re in the process of exploring the data again and checking on the computers’ price.
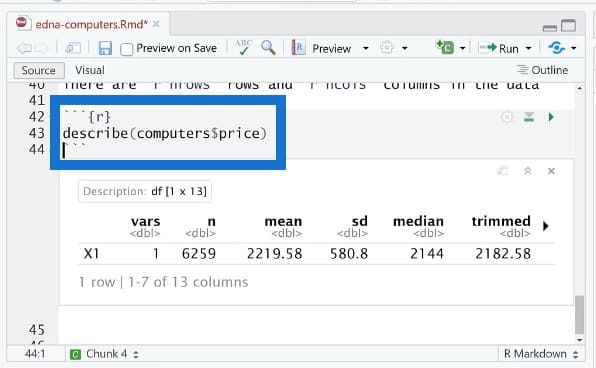
Once we run this code, we can see the descriptive statistics which are all nicely formatted. Depending on the size of the data, it’s pretty responsive and reactive to the size of the file.
***** Related Links *****
Upcoming Course: Basics Of R For Power BI Users (Part 1)
Power BI With Python Scripting To Create Date Tables
Python In Power BI: How To Install And Set Up
Conclusion
For this tutorial, we’ve discussed the importance of developing reproducible research and streamlining the process of communicating research results through the use of R Notebooks. This way, we can quickly and easily reproduce the original results and trace back to determine how they were derived.
Please watch out for the continuation of this tutorial in part 2 of this series.
George Mount


