This blog will examine the Stacked to Ordered Data Challenge from Excel BI, involving the Power Query transform column to table functions. The task is to turn a single column of data into a proper table where each type of data has its column and subsequently will add a rank on population. You can watch the full video of this tutorial at the bottom of this blog.
This Excel BI challenge is a great opportunity to practice and hone your skills in Power BI and using Power Query tools. There are also plenty of great techniques used by experts in the field that you can learn and discover. So let’s start and give it a go!

Creating Lists
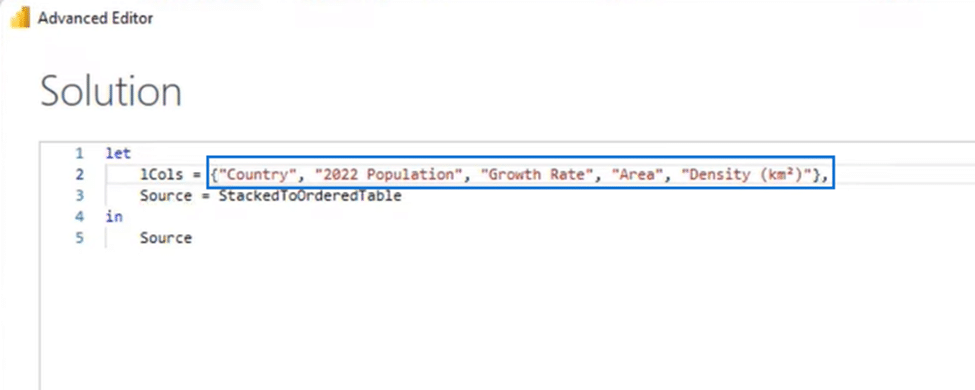
The columns we’re going to create will need names, so we’ll create a list for that. Let’s start by opening the Advanced Editor window and at the top, we’ll add a variable called list columns (lCols =). After that, we’ll enter a list with all the values for this variable, as highlighted below, and press Done.
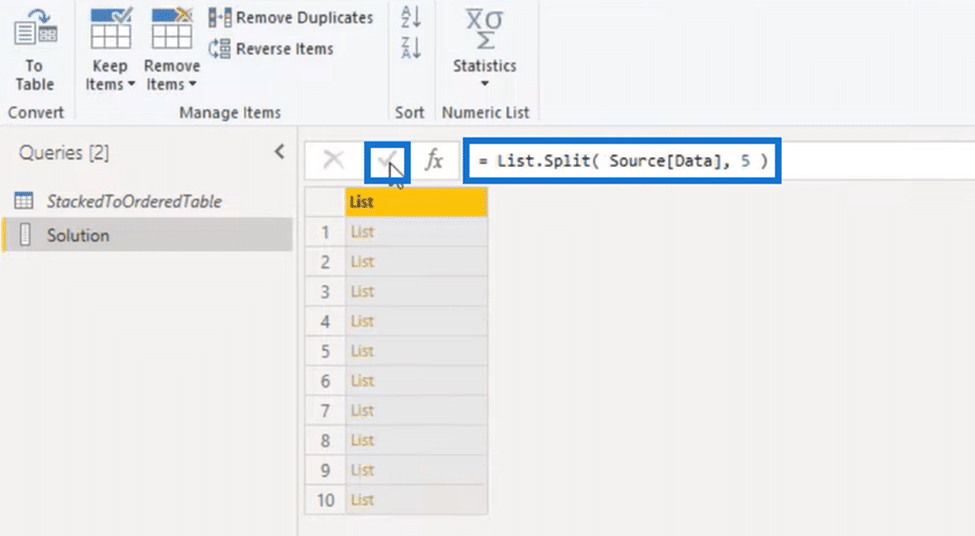
There are five values for each row of data. We are going to split that out by entering List.Split in the formula bar followed by 5 for the page size. We then press that check mark, which returns a list with nested lists.
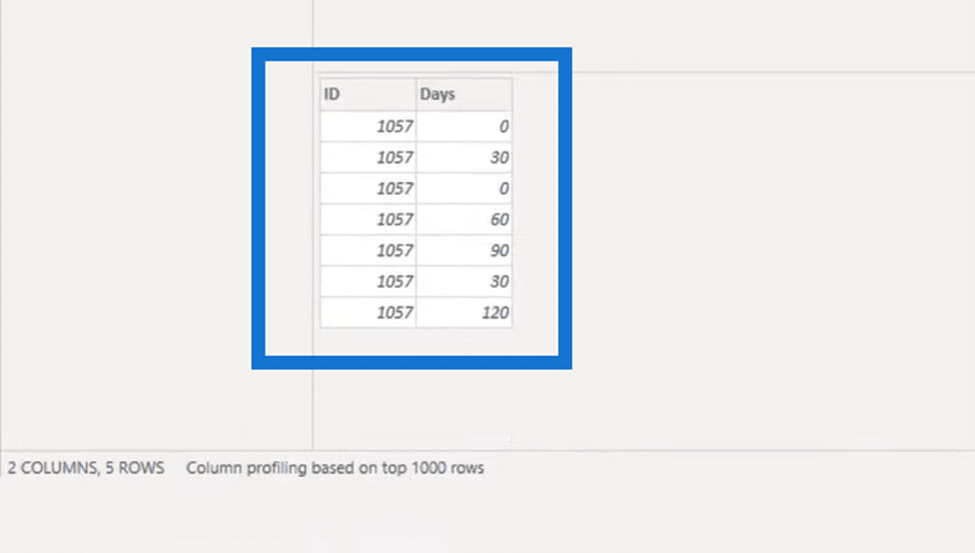
And when we click off to the side in the white space to see a preview below the table, like this:
Assigning Field Names
So for each row in our table, we now have a list with all of the values that are associated with it. But let’s turn this into a record so we can assign field names to each value.
Inside the formula bar, we’ll add List.Transform at the beginning and each Record.FromList at the end. We can use the underscore to refer to the List and Fields inside the parenthesis of Record.FromList.
So we’ll call in our list columns variable Record.FromList( _, lCols )).
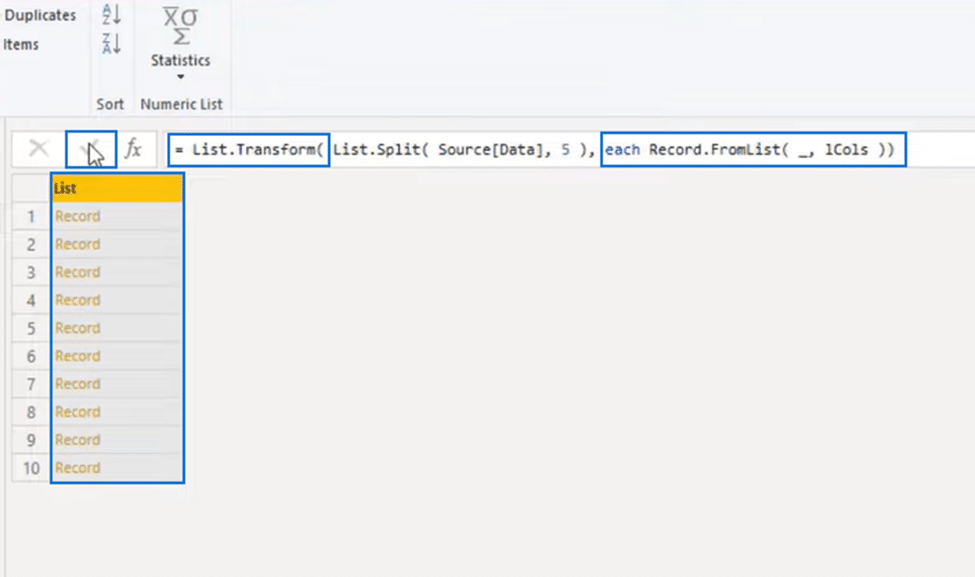
So instead of a list with lists, we now have a list with records. Let’s press off to the side in the white space again to see the result.

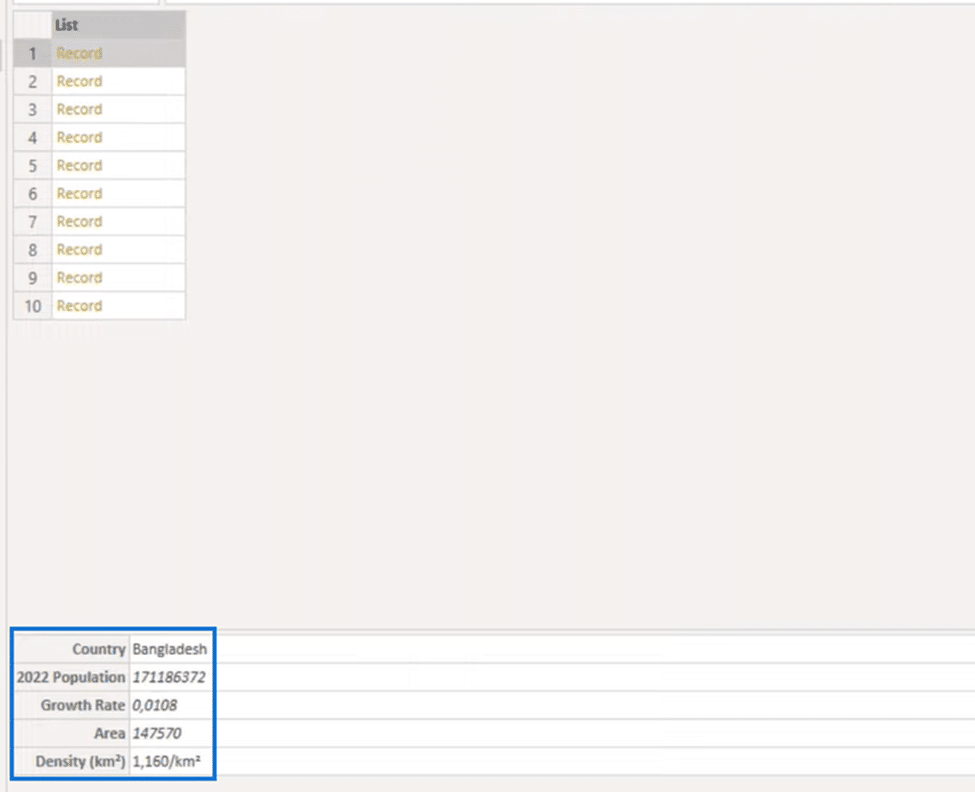
And we can see above that each item now has a field name assigned to it. We’ll continue by turning this into a table.
Power Query Transform Column into Table
To transform our list into a table, we’ll type in at the beginning of our formula bar Table.FromRecords and wrap it around the formula with an open and closed parenthesis. After pressing that check mark, we get the result below.
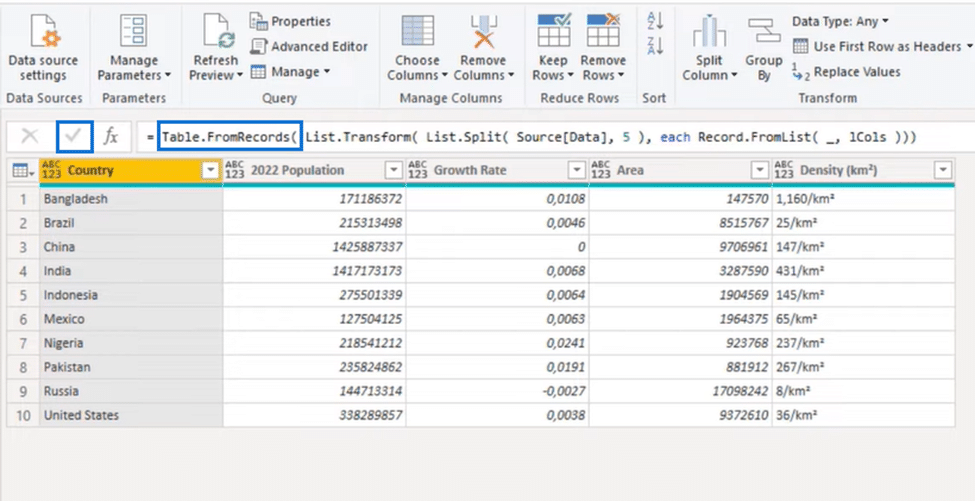
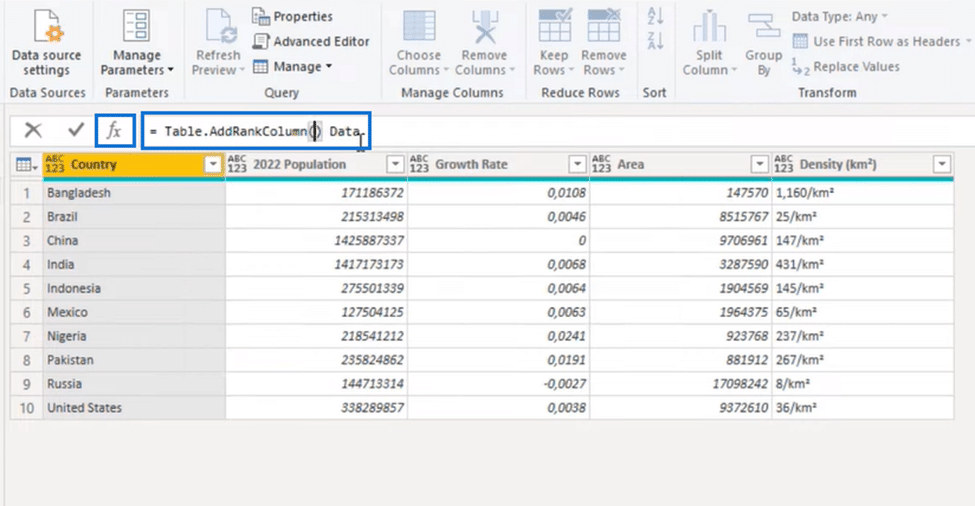
Table.AddRankColumn
For the ranking of the population, we’ll use the relatively new M function called Table.AddRankColumn. So we’ll press the fx beside the check mark and enter this function.
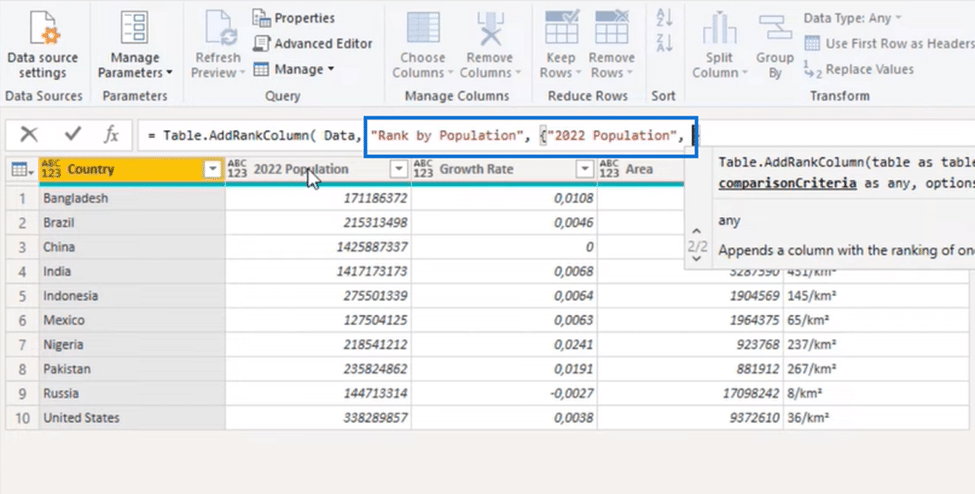
We continue building our function by entering inside the parenthesis the text value that we’ll call Rank by Population. We follow that up with a comma and enter our comparison criteria, which is the column 2022 Population.
Power Query Transform Column into Reordered Table
Because we need that in descending order, we’ll enter Order.Descending and close that with parenthesis. Now that our function is complete, we press that check mark again and get the result below.
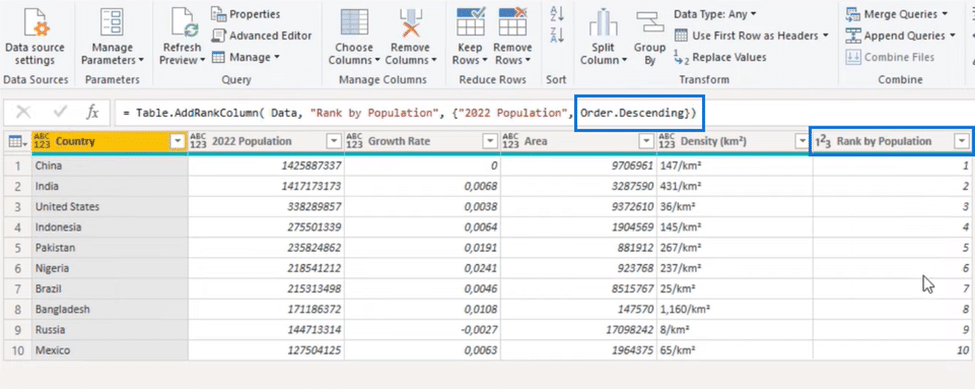
As you can see, it has added the ranking column (Rank by Population) and has also sorted out the table in descending order.
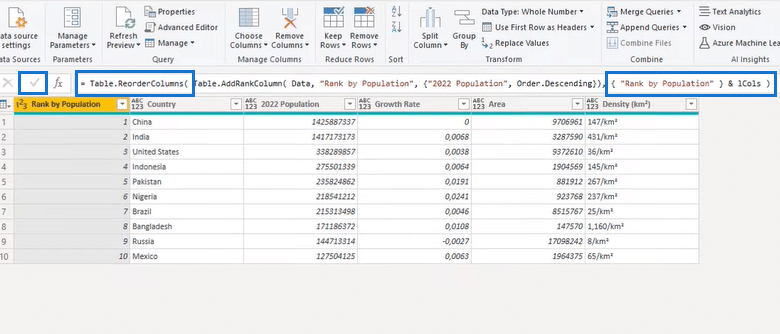
We’ll copy the new column name (Rank by Population), and at the beginning of the formula, add Table.ReorderColumns. It will need a table and a column order, so we’ll create a list at the end of our formula and paste the new column name we copied.
We’ll then append it with our list columns (lCols) and close it with parenthesis. And finally, we press that check mark one final time.
We have successfully completed the Excel BI’s stacked to ordered Power Query challenge!
***** Related Links *****
Power BI Column Split Power Query Tutorial: How To Split Multi-Lined Excel Cells In Power BI
Export Share Point Lists To Excel Or CSV File
Appending Several Sheets In Excel To Power BI
Conclusion
We have successfully completed the Stacked Data to Ordered Challenge from Excel BI. We turned a single column of data into a proper table where each type of data has its column and subsequently will add a rank on population.
First, we created a set of lists using the Advanced Editor. We drilled down our column, split the lists, and assigned field names. Then we transformed our data into tabular form and recorded the columns using a function.
Everything you learned in this blog will surely be useful to your future Power BI and Power Query transform column endeavors!