
For today’s blog post, I want to talk about a technique that we can use to simulate dynamic theming in a Power BI report. We’ve recently had a few posts on the Enterprise DNA support forum asking how to change the theme of a Power BI report dynamically. In one case, the user sought to have a single content page reflect the theme of multiple departments or categories. You can watch the full video of this tutorial at the bottom of this blog.
As of May 2021, only a single theme JSON file can be used in a Power BI report and a page can have only one background. This is why another technique is needed to accomplish the stated goal.
I thought about using bookmarks (instead of page navigation) and images (instead of page backgrounds) to simulate a dynamic theme and decided to give it a try.

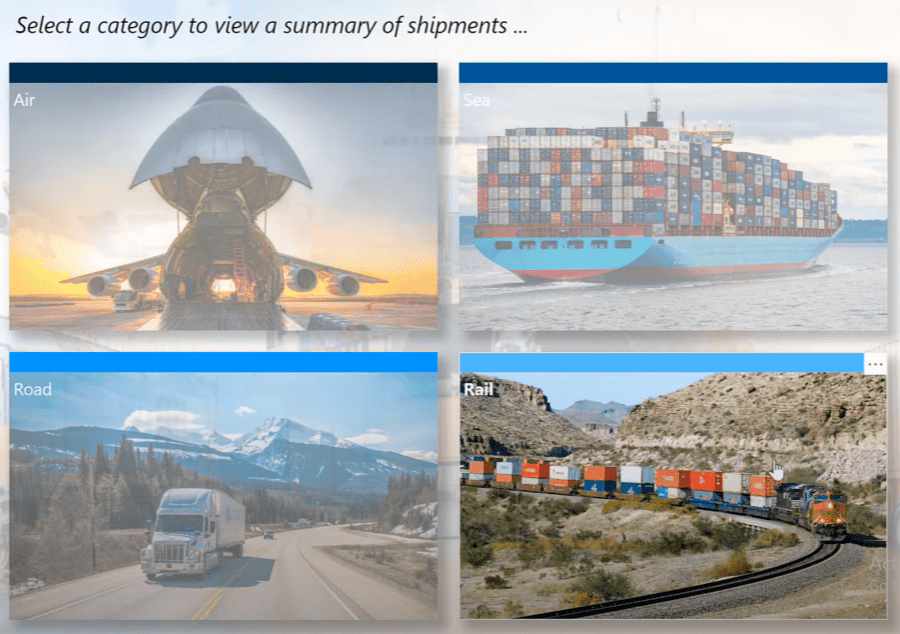
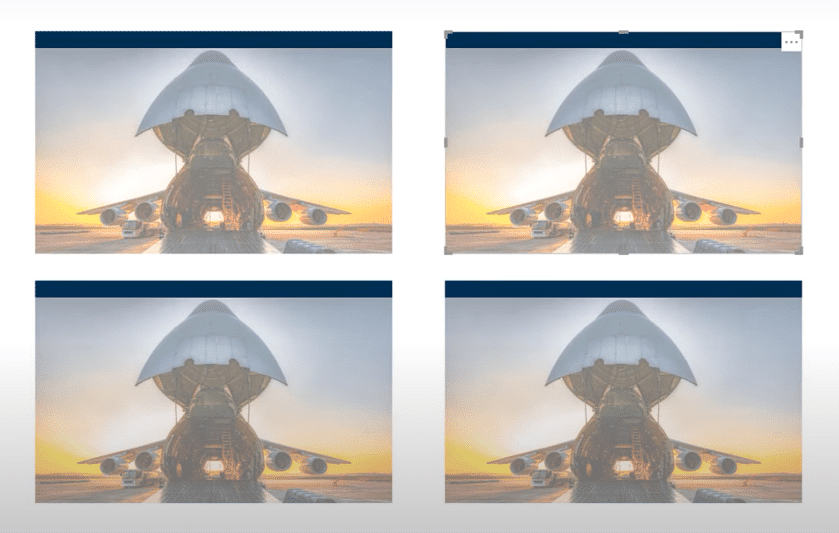
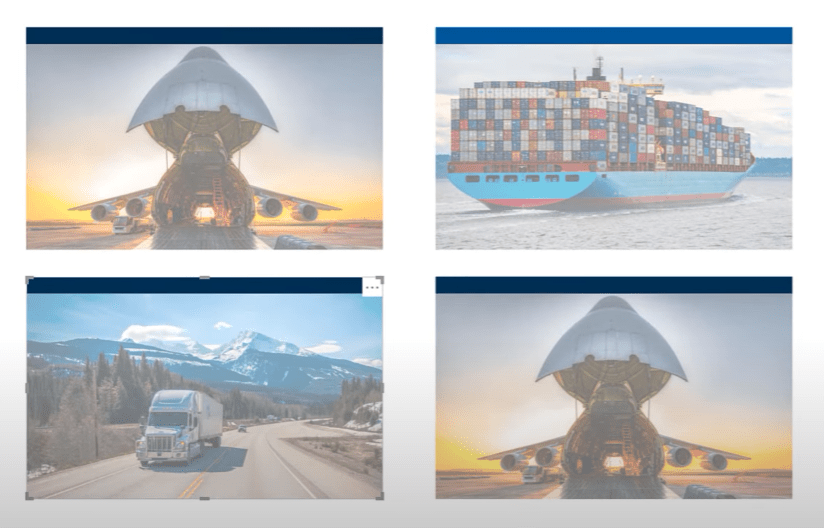
Here’s what I’ve come up with so far. This is a homepage that has four buttons on it.
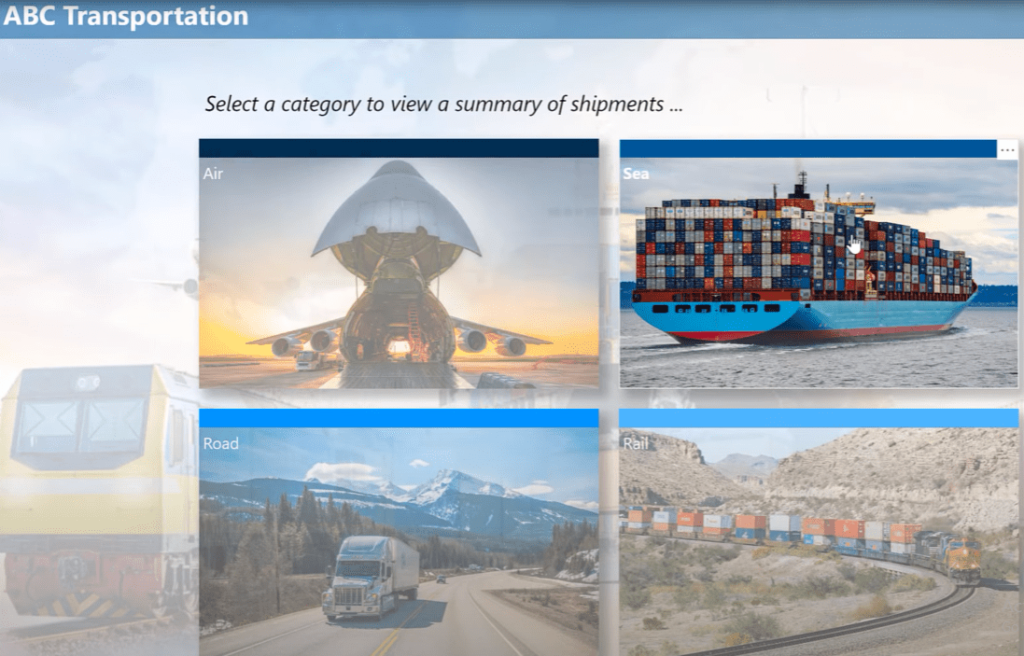
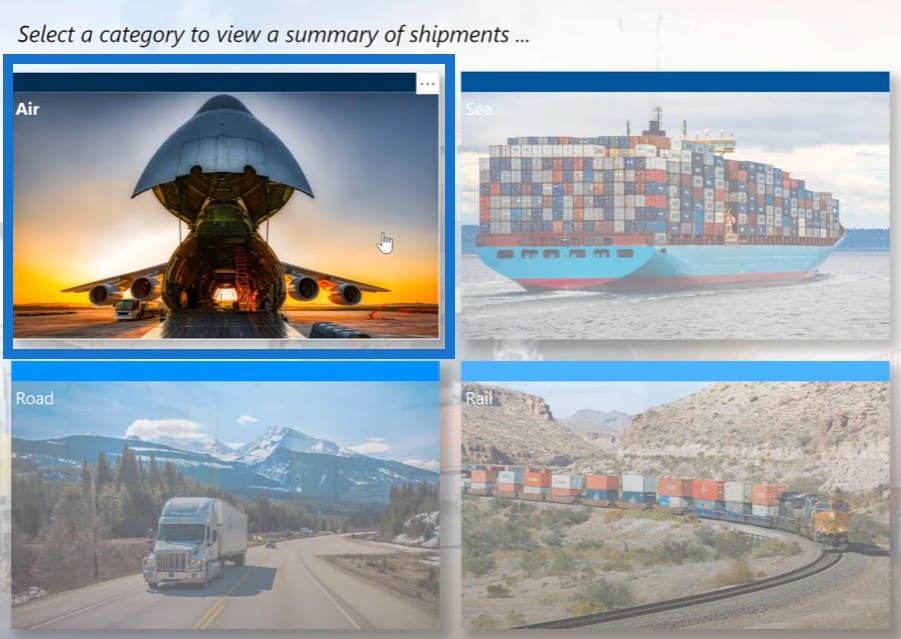
There’s one for each category of shipment. If you hover over each category, you can see that the hover behavior is changing its transparency.
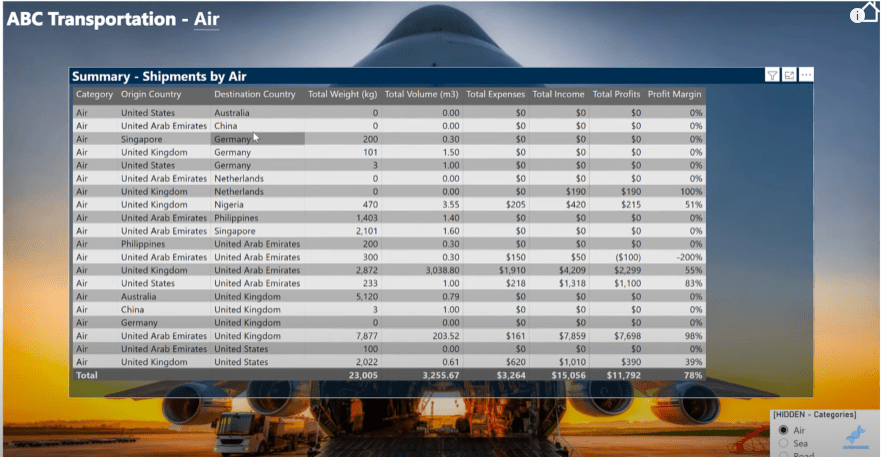
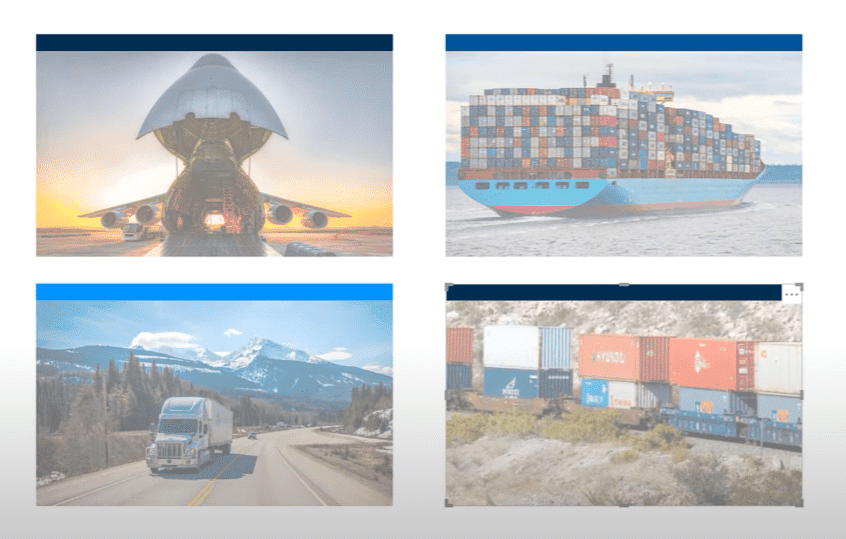
If I click on the Air button, it will take me to a category page that has the same theme (airplane as background) as that of the Air button.
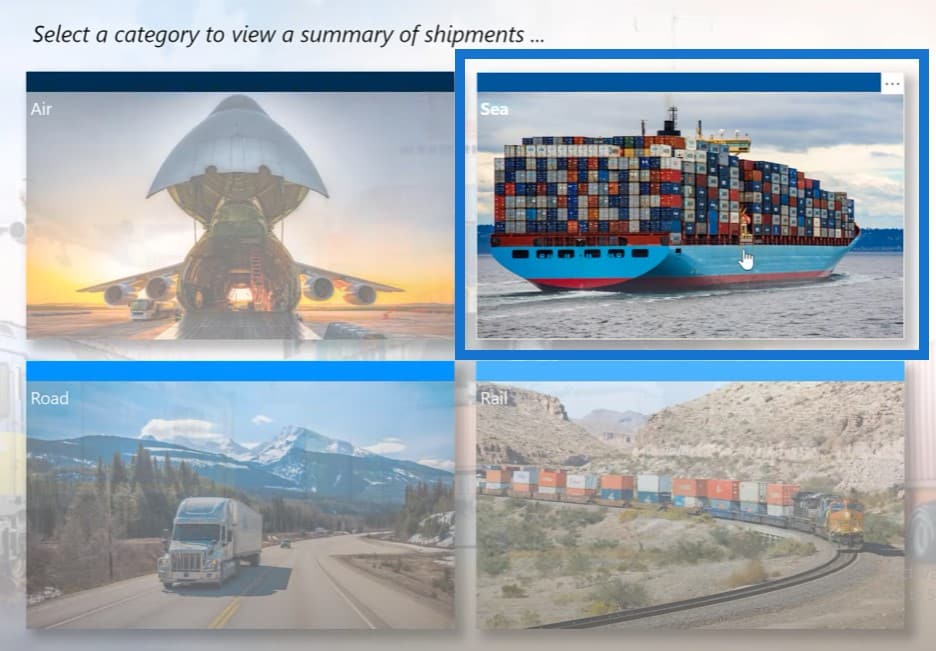
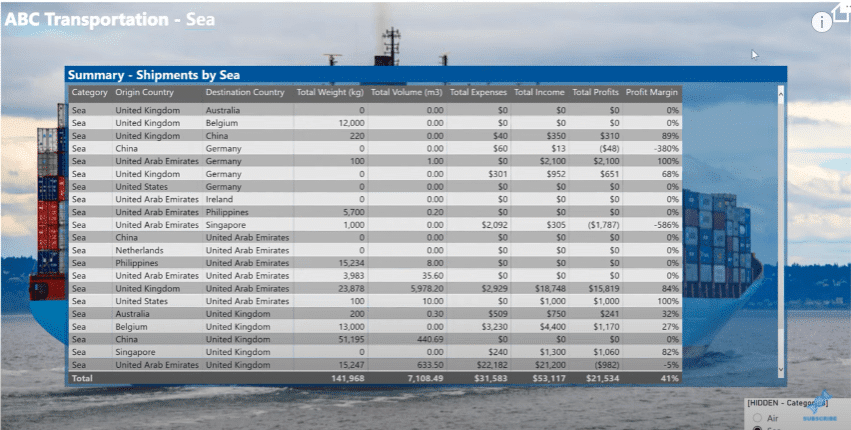
If I click on the Sea button, it will go to the Sea category page with the same theme (ship with cargo as background).
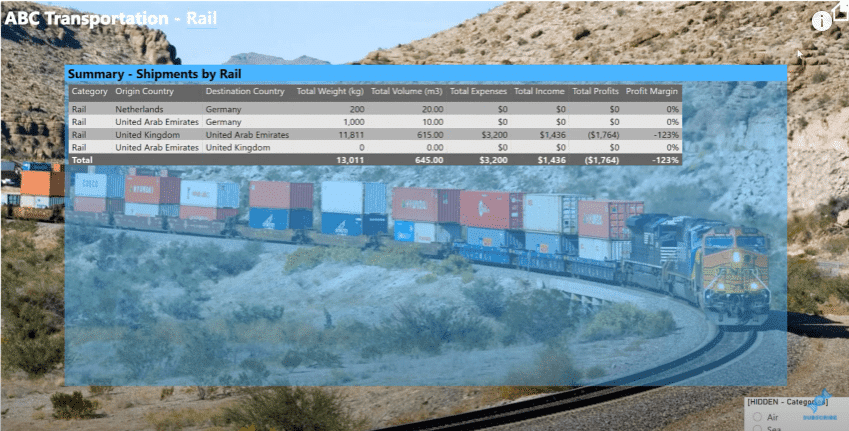
Again, if I click on the other button for Rail, it displays another theme (railway as background).
You can see that there are only two pages involved in this report. To build the solution, I started with a blank PBIX, then I added a small shipping data set based on the one we used in the recent Enterprise DNA challenge #12.

Setting Up The Power BI Report
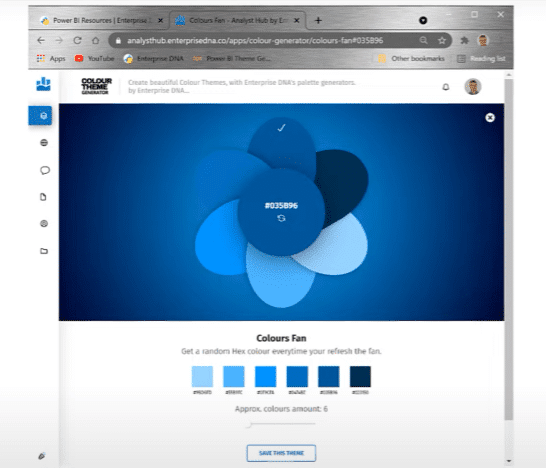
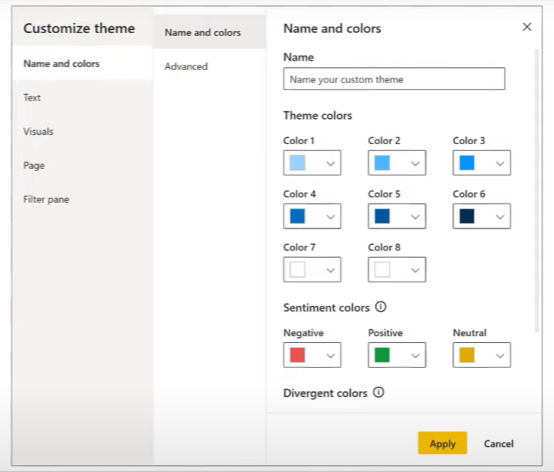
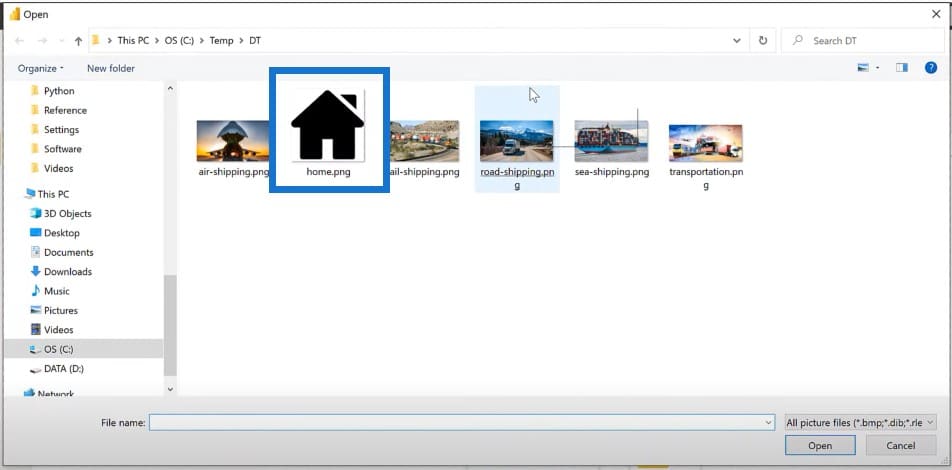
Then I searched online and found some images that represented the different shipping modes or categories. Then I followed it up by generating a basic color theme using the color theme generator in the Enterprise DNA Analyst Hub.
I chose medium dark blue as a starting point, then used the colors fan function to generate a six-color theme, which I then used to customize the theme of this Power BI report.
Finally, I developed a few DAX measures to return the text and background or font color using the themes desired. Let’s take a quick look.
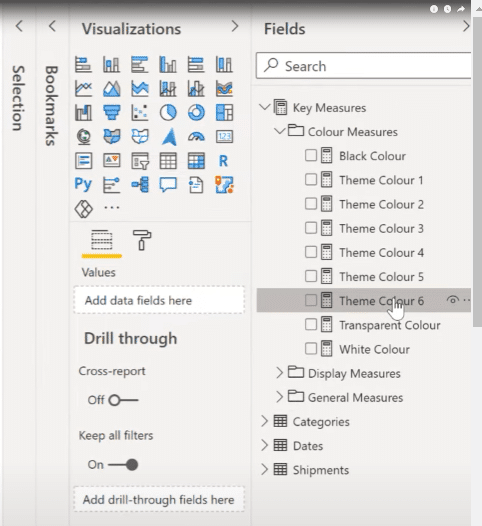
We’ll open up our Key Measures, then go through our Color Measures folder. Theme Color 6 is just a hex code for one of my themes while Theme Color 5 is my medium blue starting color.
Creating Display Measures
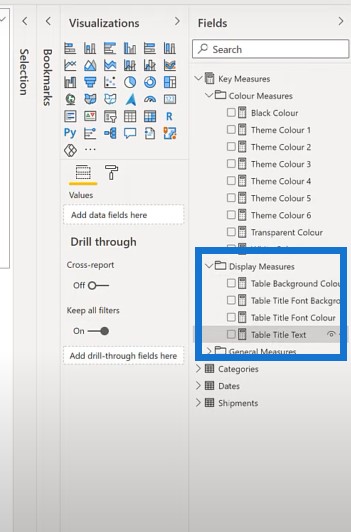
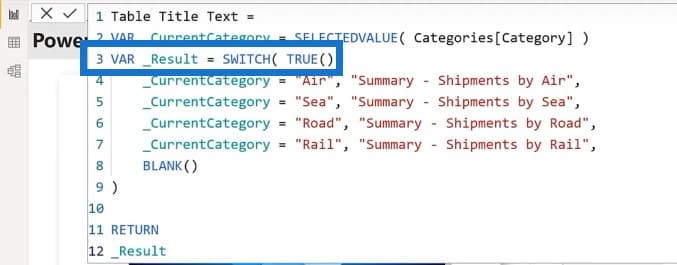
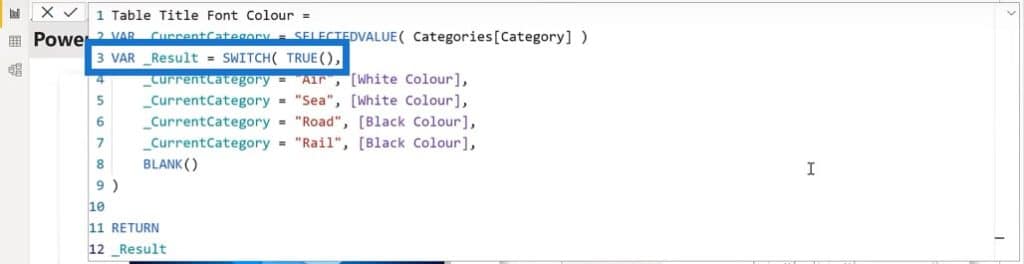
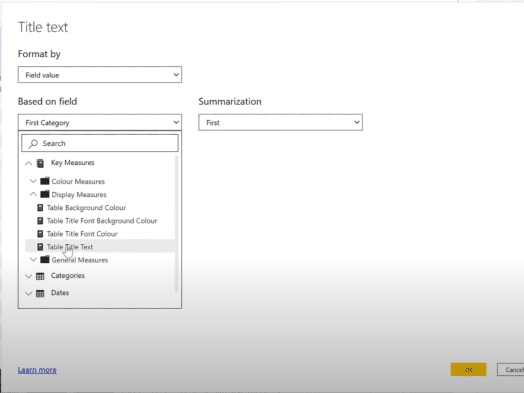
Then we’ll go to the Display Measures and then click on the Table Title Text measure.
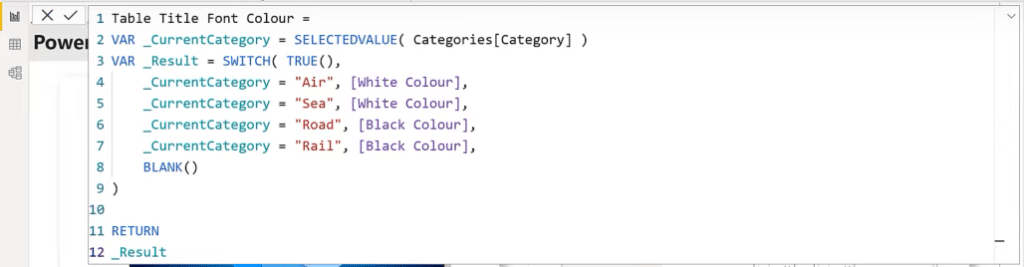
This has a value that is determined by the current category and created using a SWITCH TRUE statement.
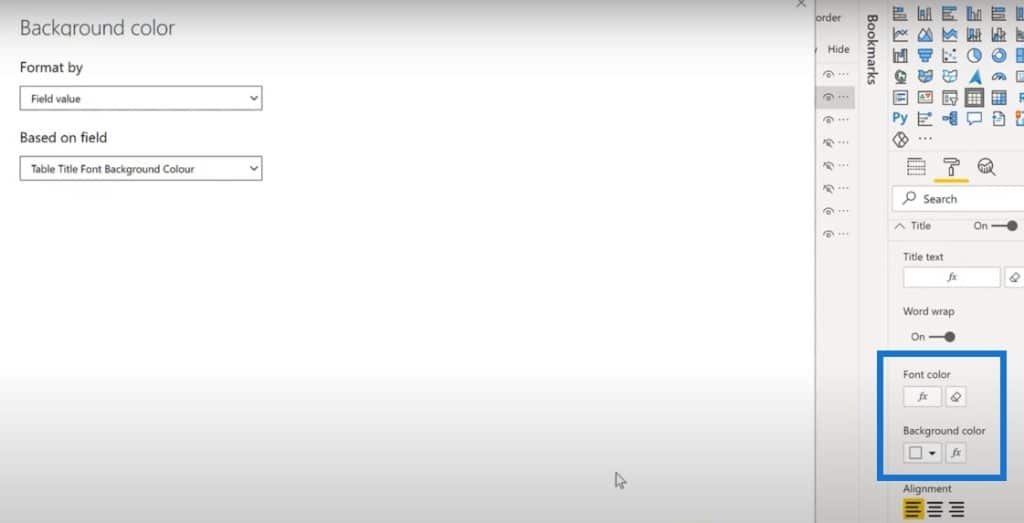
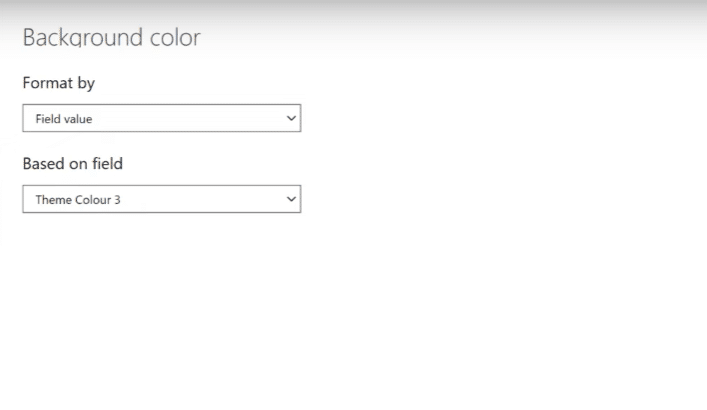
If we look at the Table Title Font Background Colour measure, it uses exactly the same SWITCH TRUE statement based on category; but this time, it returns a color theme measure.
I have a similar measure for the color of the font, called Table Title Font Colour, which returns a wider black that contrasts well with the theme color.
And lastly, I have a Table Background Colour measure, which is a duplicate of my Table Title Font Background Colour measure but with a different name to make it easier to set up.
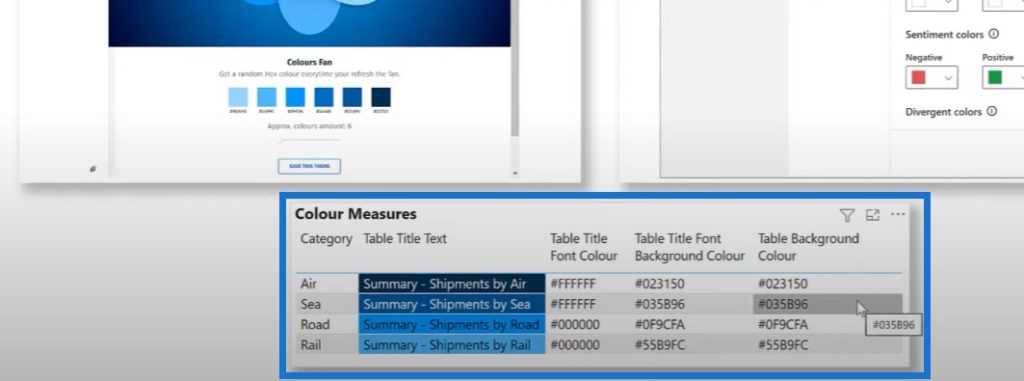
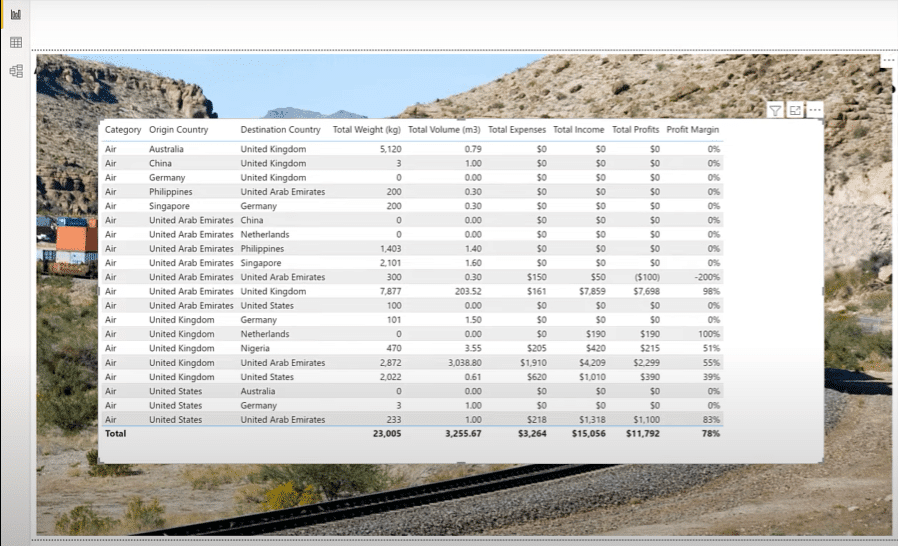
We also have a small table down at the bottom so we can see what the results of those measures are.
That’s it for the setup. Now let’s build the solution together and start with a Home page so that we’ve got something to navigate to.
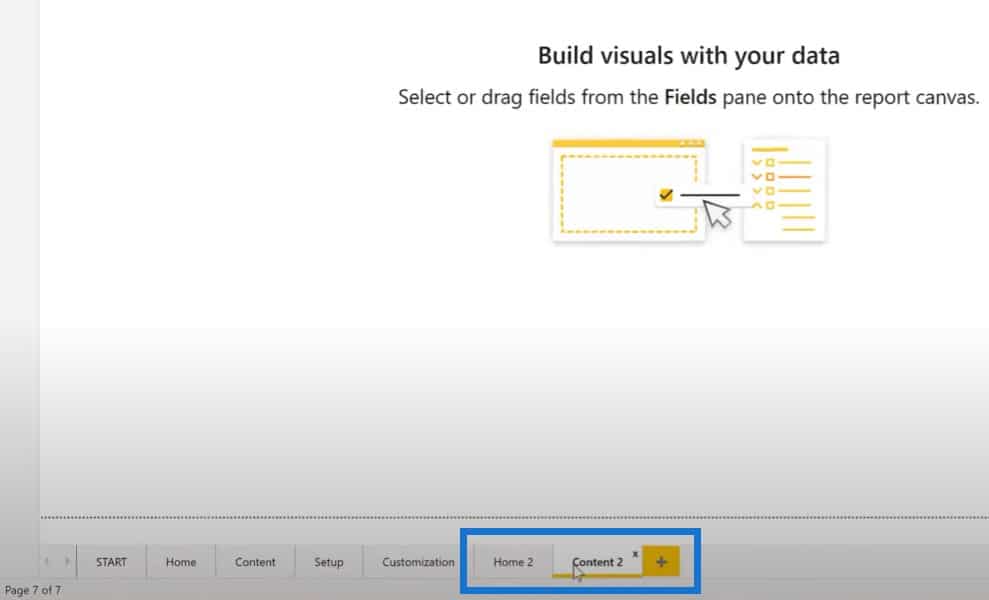
Creating A Home Button
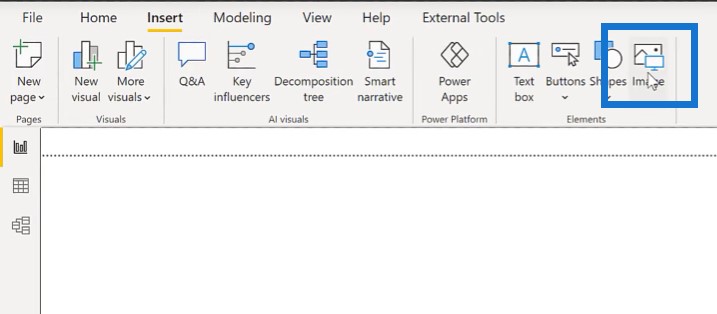
We’ll create a Content 2 page and add an image for Home.
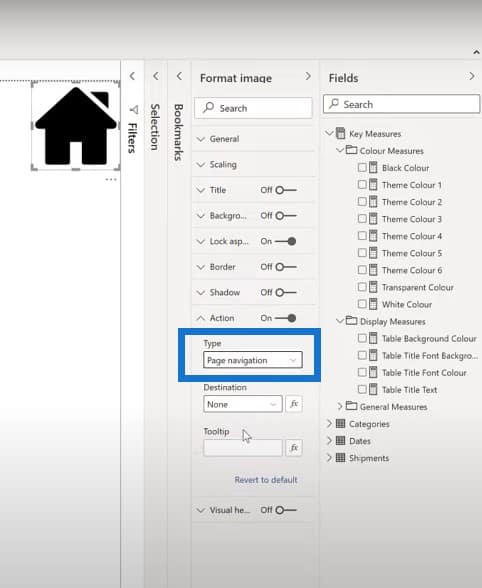
Bring the image into a corner, make it a bit smaller, and set its action to navigate to the home page.
Making A Slicer For The Categories
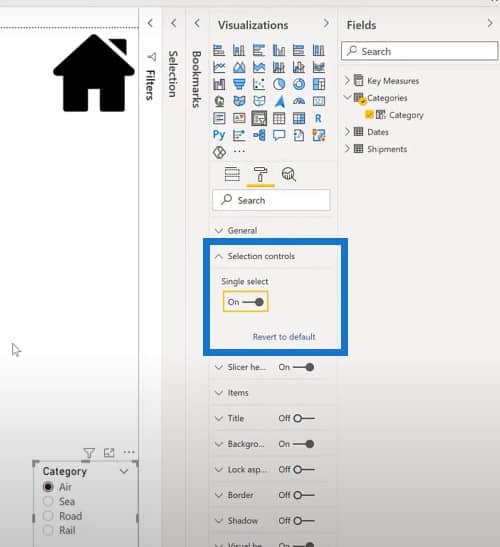
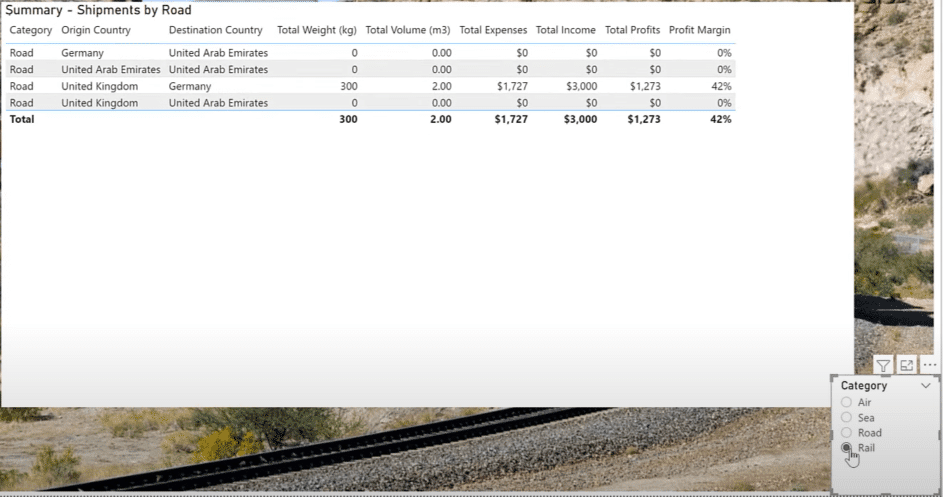
Then we’ll add a slicer for categories and make the slicer single select.
Adding The Title
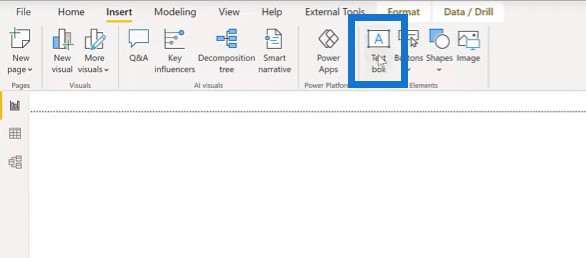
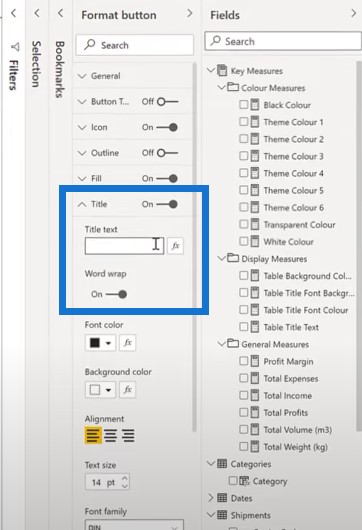
The next step is to add a text box in the top left corner for the title. Let’s call it ABC Transportation and add a measure to our category.

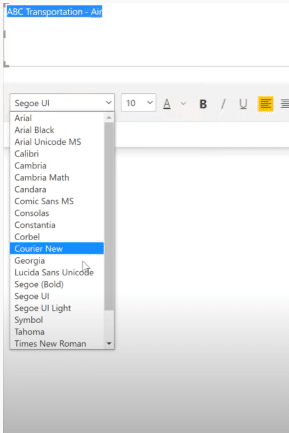
The title changes when we make different selections on our slicer. We can also change the font color and size.
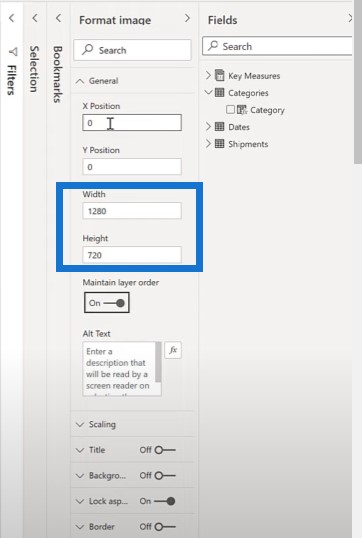
The next thing to do is add an image for each category. Let’s add the first image for air shipping. We’ll set it to size 1280 and 720 for full size. We’re going to name this in the selection pane.
Creating And Formatting The Table
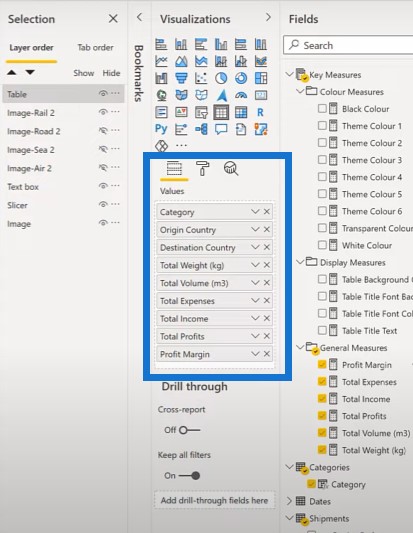
We’ll do the same steps for the additional images and then add a table. Let’s add a new table to this table. We’ll put it in the category for us to be able to see from our shipments table, as well as the origin country and destination country. From our key measures category, we’re also going to add in the measures we’ve already calculated.
The next thing to do is to format the table. We will set the title text first to the measure that we have already calculated.
Once we click on the slicer, we can see that the title of the table changes based on the selection we make on the slicer.
We can also change the table font color, table background, and transparency.
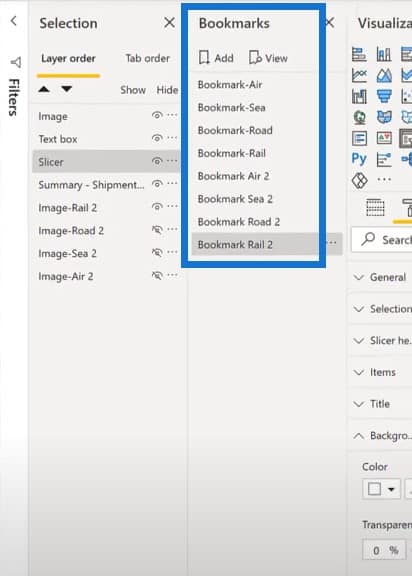
The next step is to add a bookmark for each image.
Making The Homepage
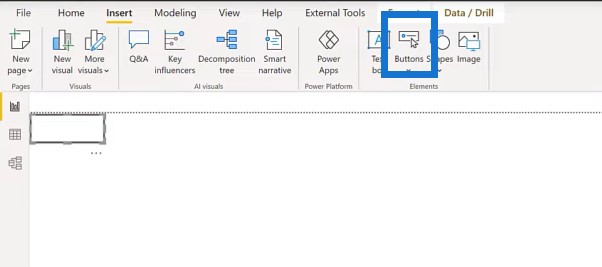
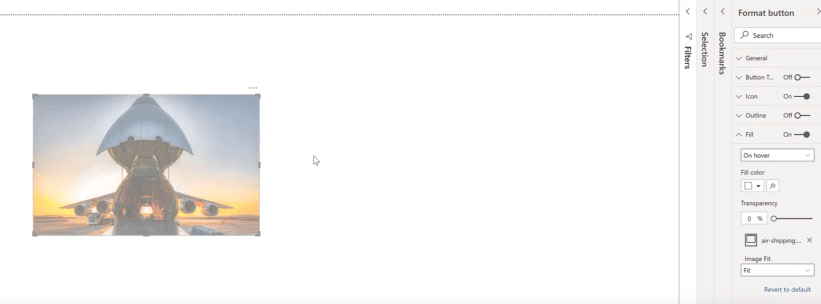
That’s it for the content page. Let’s move on to the homepage. To start, we’ll add a blank button here.
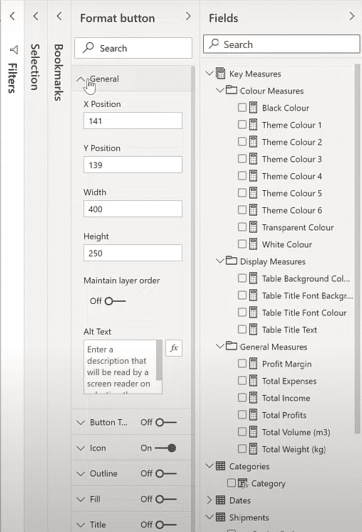
We’re going to turn off the outline and size it to 400 and 250.
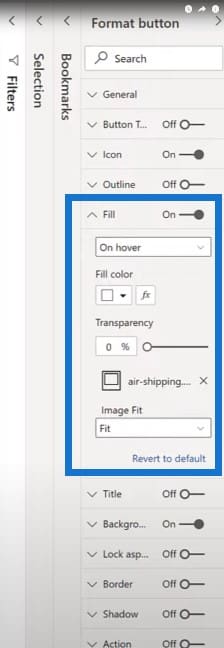
Then we’re going to fill in an image for this button.
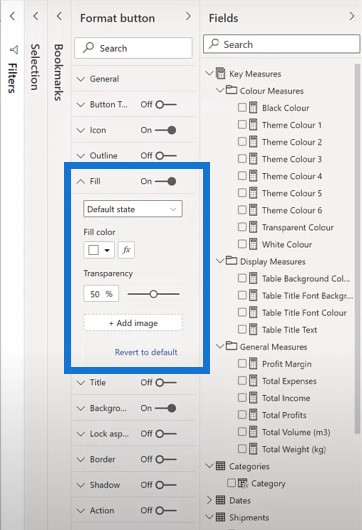
We’ll set the image fit to fit and the transparency to 0% for On hover so we can see that the button becomes transparent when not selected.
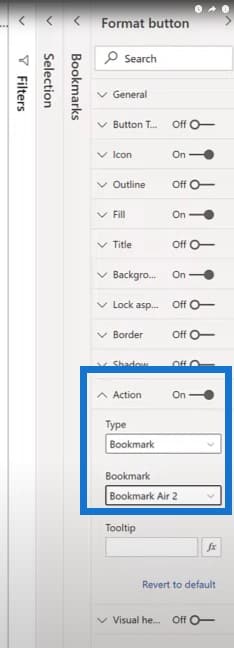
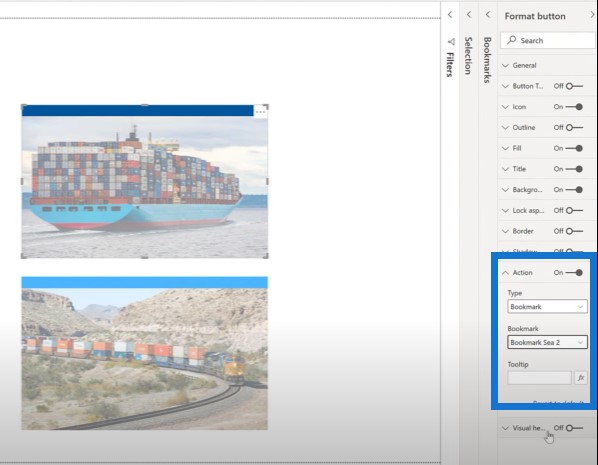
The next thing to do is to add a bookmark action into it. Turn the Action slider button on and change it to Bookmark. Select the Air 2 page.
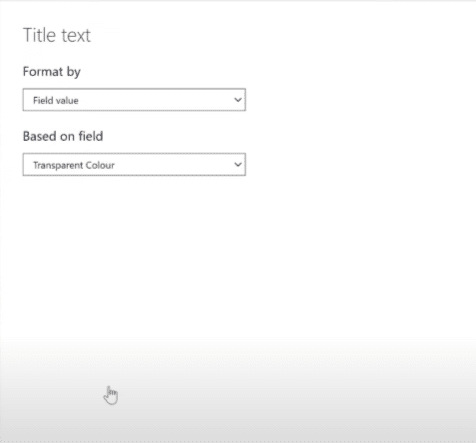
The next step is to set the title. We can make it into a transparent color so we actually can’t see it.
We’ll do this for three more times by copying and pasting the image. Then we’ll adjust these to represent each category.
For the second button, we’re going to change the fill from air shipping to sea shipping.
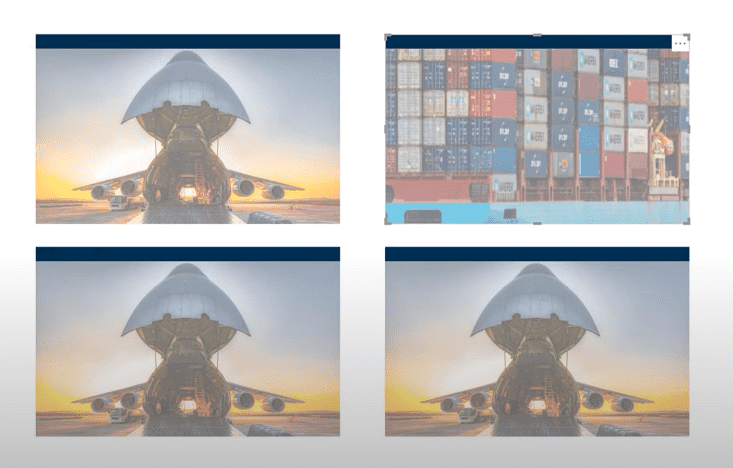
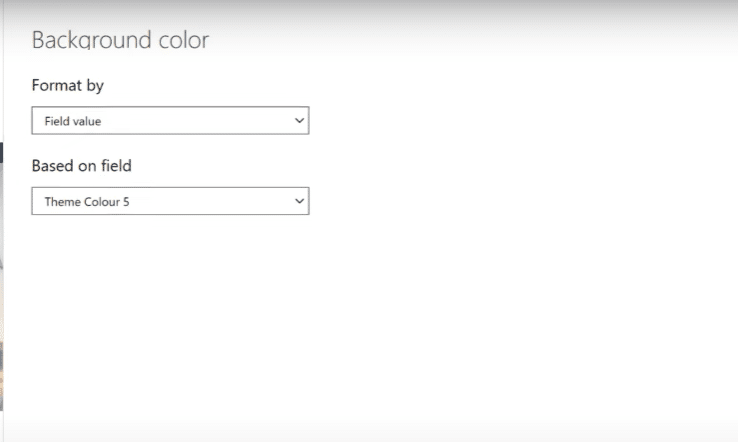
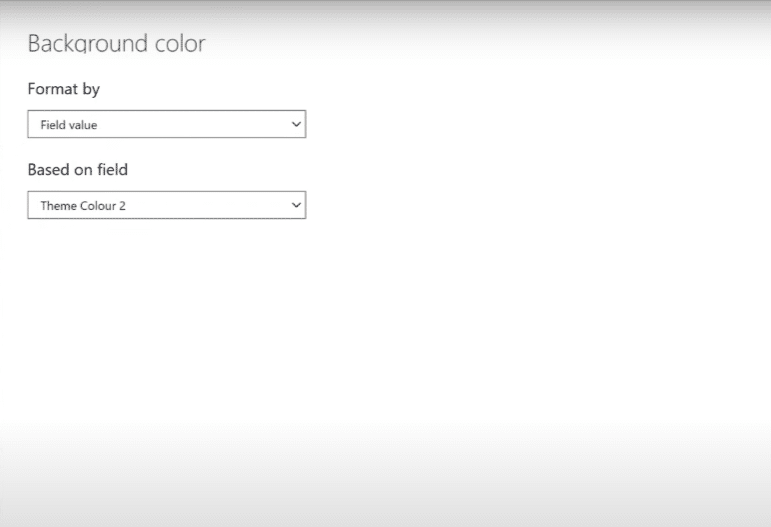
Then change the image fit to fit and change the name. We’ll then change this background color to a different theme.
For the third button, we’ll change the fill from air shipping to road shipping.
Again, we’ll change the Image Fit to fit and change the title background color.
And for our final button, we will change the fill from air shipping to rail shipping.

And again, we need to set the image fit to fit and change the color of the background to a different theme.
On the air button page, we had the action selected as Bookmark Air 2. For the other three buttons, we need to change the action selected. For example, on the sea button page, we need to bookmark it to Bookmark Sea 2.
***** Related Links *****
Power BI Report Development: Creating Themes, Company Logos, Icons and Backgrounds
Table Visual In Power BI | Dynamic Subsetting
Data Visualization Technique | Power BI Dynamic Visuals
Conclusion
So now we have our newly-built solution. When we press control and click on the home page, we are taken to the content 2 page where the appropriate, full screen image of the background is displayed for the selected category. We can use the home button to navigate back to the home 2 page.
As of May 2021, the current release of Power BI desktop allows the following properties to be set for the table:
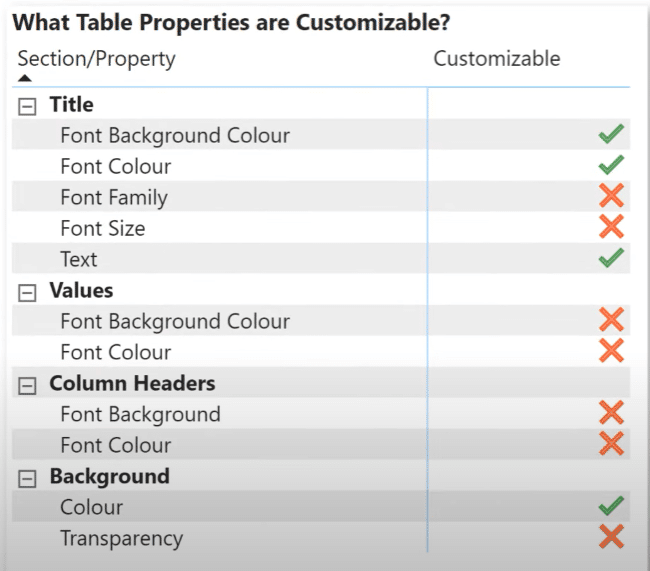
The remaining properties cannot be programmatically set at this time. But if needed, one can leverage a solution using multiple table visuals, one for each category and then adjust the product properties and visibility individually as desired.
This can be a bit more complicated, but additional flexibility is possible. Experience shows that additional properties will become customizable in future releases of the Power BI desktop.
Hopefully, the Power BI team will add the ability to use multiple themes in a report. But for now, here’s one technique that allows you to simulate different themes.
Thanks for watching and I wish you all the best on your Power BI journey.
Greg


