
In this blog, I’ll show you how to remove duplicate rows in the Power BI Power Query based on conditions. You may watch the full video of this tutorial at the bottom of this blog.
This example is from a question that was raised on the Enterprise DNA Forum. The member has transactional data and wants to remove rows that cancel each other out.
There are two distinct transactional types, one for incoming, and one for outgoing. She’s also added movement count. And based on that, she formulated three scenarios.

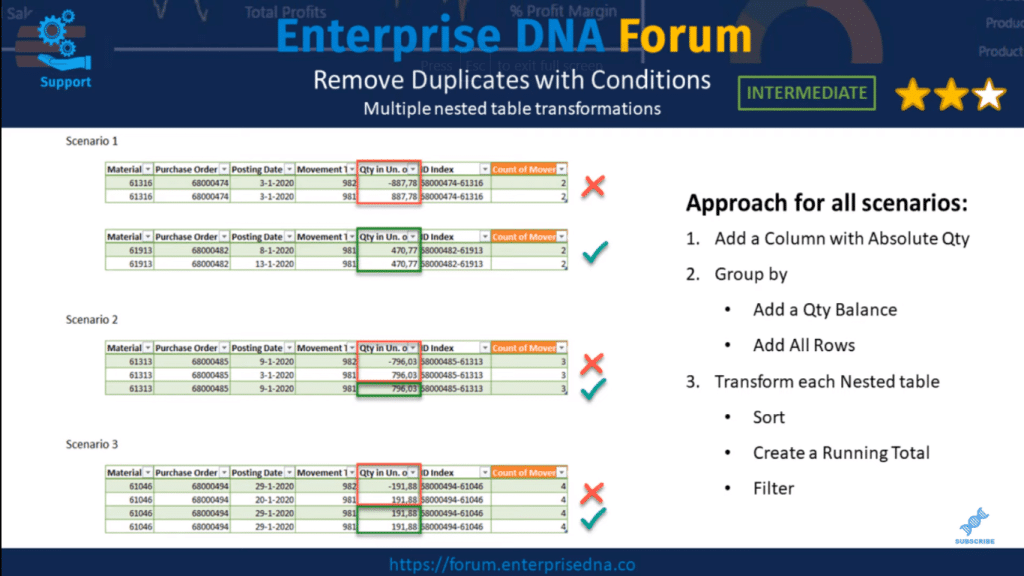
Scenario one is based on two rows. If they cancel each other out, both rows should be removed. If that’s not the case, then both rows should be kept.
Scenarios two and three are based on a combination of rows, in part cancelling each other out. Those rows should be removed on a first-in-first-out basis so that only the latest incoming transactions are kept.
Basically, we’re repeating the same logic over and over again. We should be able to design a single approach to fit all these scenarios.
Some of the things we’re going to do are add a column with absolute quantities and group by “add a quantity balance column” and a nested table using the “all rows” option. We’ll also transform those nested tables, sort the movement type and posting date, create a running total, and only keep rows based on a condition.
I’ve rated this at an intermediate level because most of the transformations that we can do here is by using the user interface. With that said, let’s go over to the Power BI Power Query.
Adding Column With Absolute Quantities In The Power Query
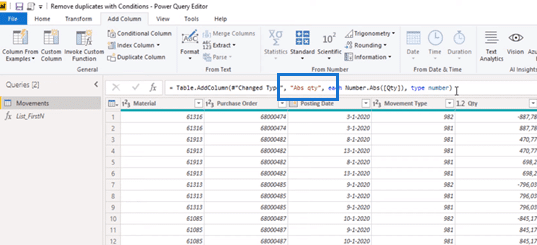
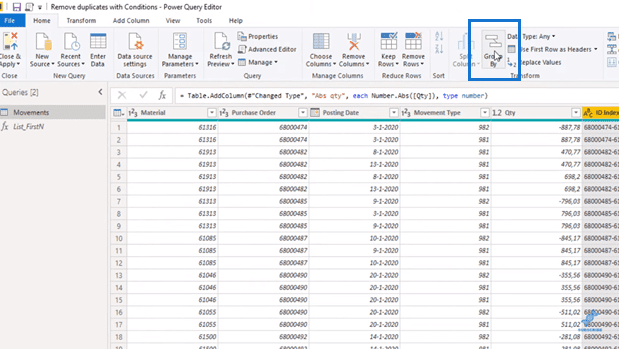
We’ll start by adding a column with absolute quantities. Select the Quantity column, then on the Add Column ribbon or tab, go to Scientific, then click on Absolute Value.


I’m going to rename this column in the formula bar.
Group By ID Index & Absolute Quantity
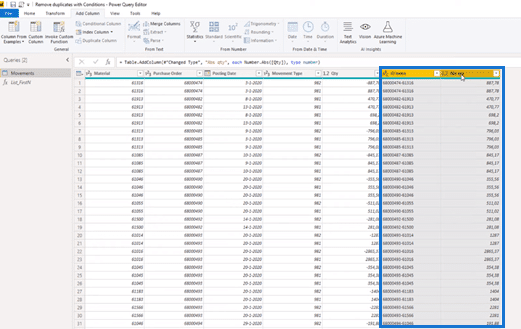
We can now group by ID Index and Absolute Quantity. Select ID Index, then hold down shift or control to multi-select, and then click on Abs qty (absolute quantity).
You’ll find Group by on the Transform tab.
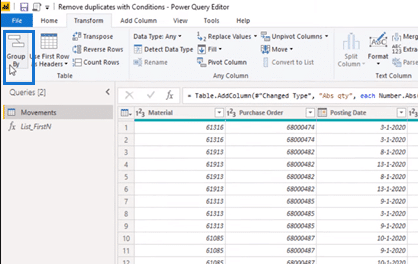
But, you can also find it on the Home tab.
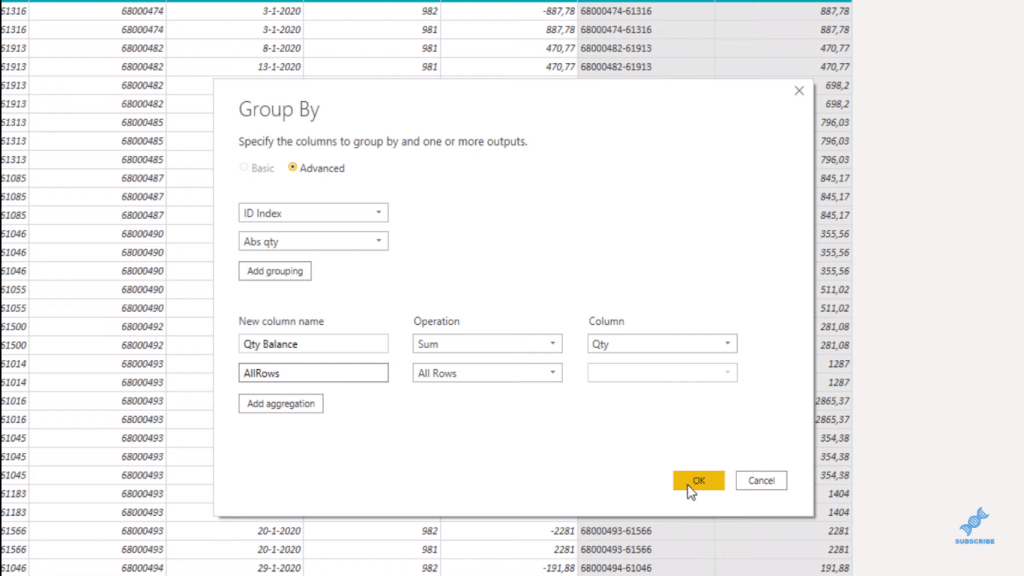
Click on it and now, we’re going to add a new column. It’s not a “count”, but it’s going to be the “sum” of the quantity. So, let’s rename it to Qty (quantity) Balance. It’s going to be a sum of the quantity column. And then, we’ll add another aggregation, but it’s going to be a special one, so we’ll select All Rows. Let’s also give this column a name (AllRows). Then, press OK.
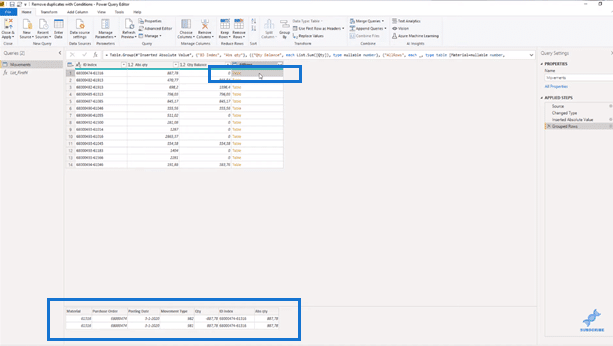
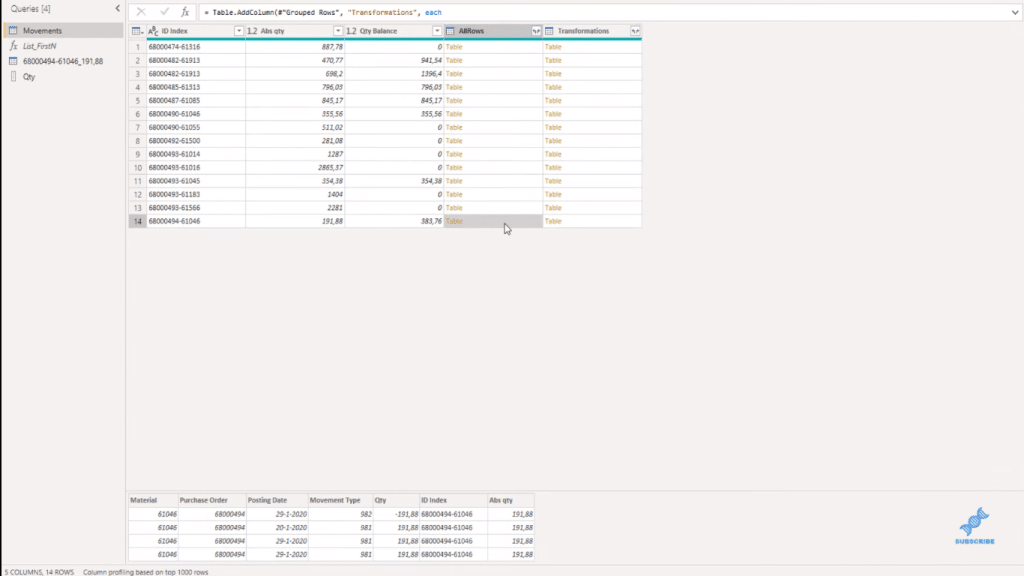
If we click in the white space in the table, we see a preview of the nested table down below. We see that the quantities for this nested table cancel each other out and the quantity balance is zero.
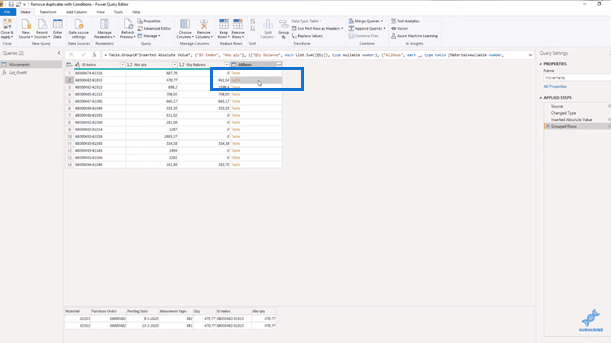
If we look at the next nested table (so click off to side in the white space of the next row), we see that the quantity column doesn’t cancel each other out and a quantity balance is greater than zero.
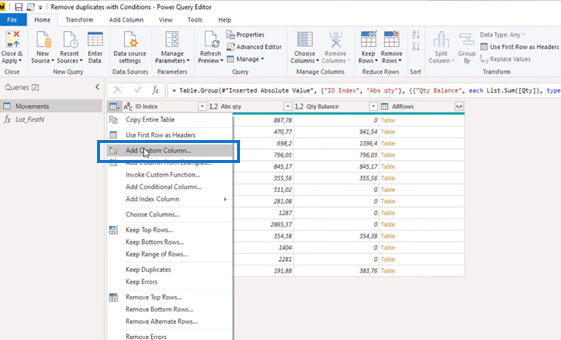
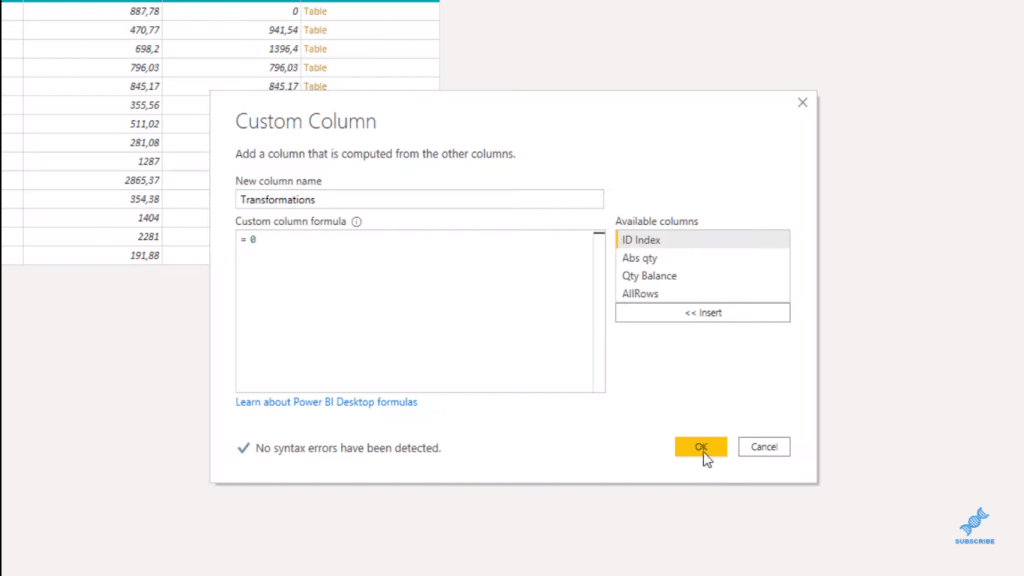
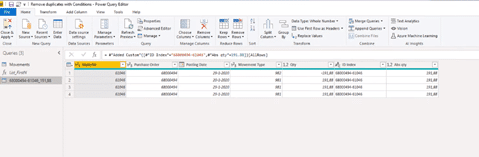
Let’s add a custom column so we can use that for our nested table transformations later on. So, select Add Custom Column.
Let’s rename that column to Transformations and we’ll add zero (0) as a placeholder. Then, click OK.
Transforming Nested Tables In Power BI Power Query
We’re now ready to create the logic for transforming those nested tables. But we don’t want to write a bunch of them, and we don’t need to.
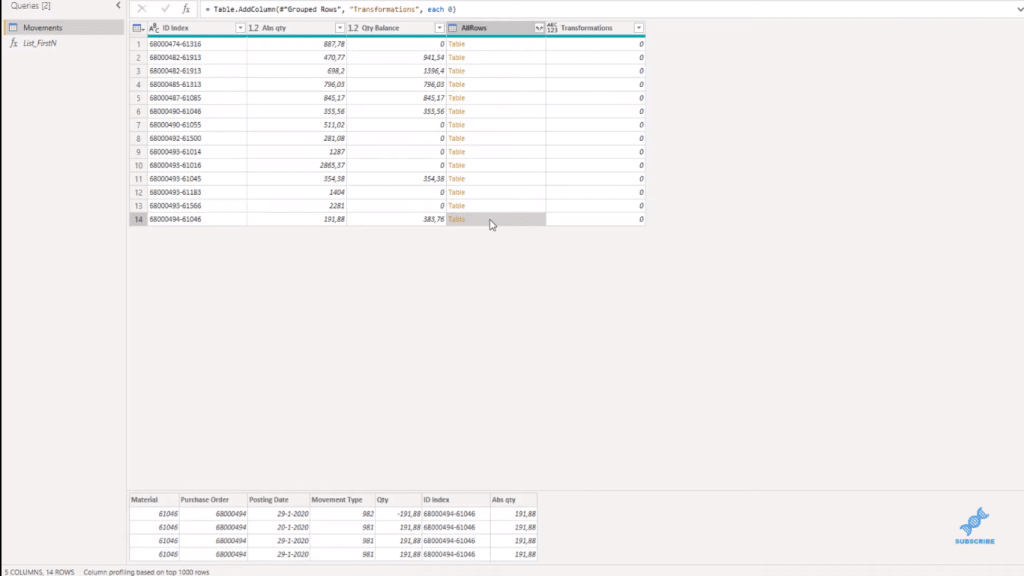
We can use the user interface for the most part. If we build the logic for those transformations in a separate query, the most elaborate scenario that we had was the one with either three or four rows.
Now, if I click on the right side in the last row, I see that this table has four rows. So, we can use this to build our transformations.
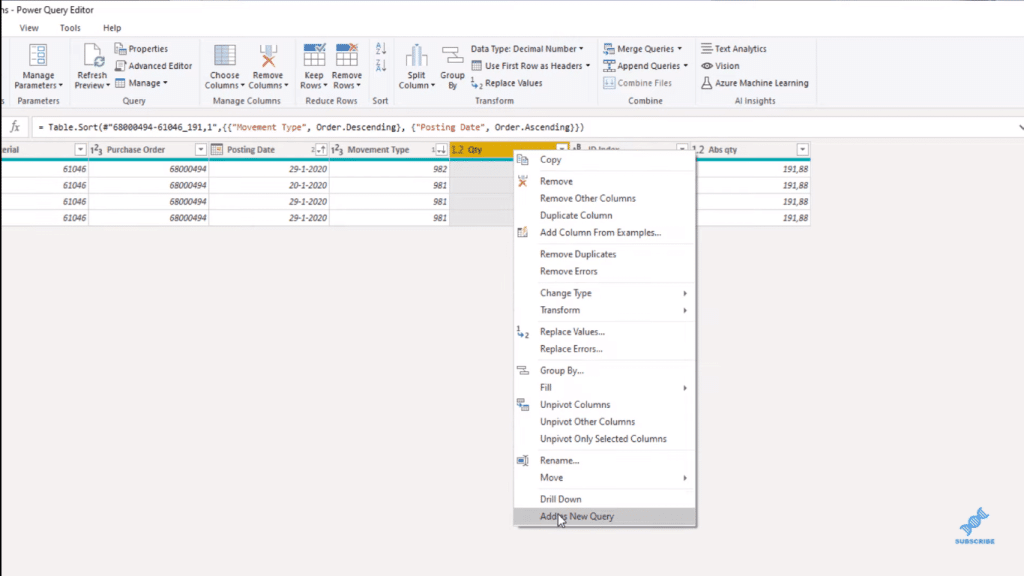
Right-click on the side in the white space and select Add as New Query.
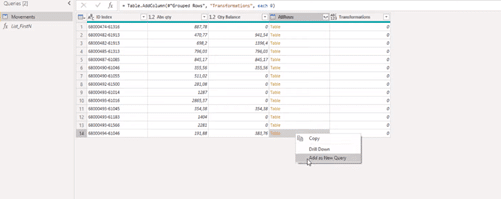
We see that the nested table has now expanded and been added as a new query and we can use this to build the logic that we need.
Sorting Movement Type & Posting Date
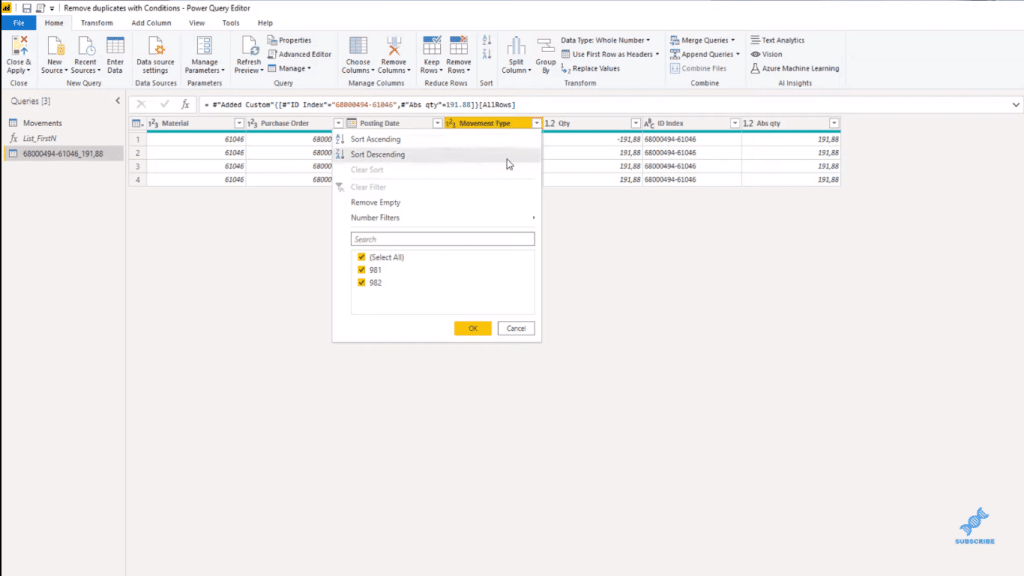
Now, first thing we need to do is sort on Movement Type. Let’s choose descending. This way, the outgoing transactions will always be on the top.

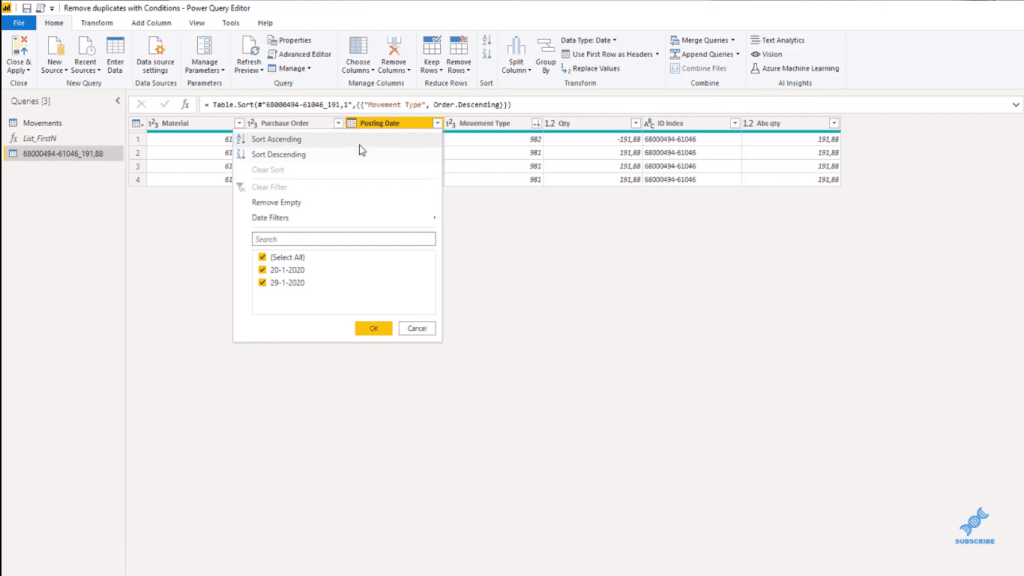
Next, we’ll sort the Posting Date as ascending, making sure that if we omit rows, it will always be done according to the FIFO principle (first in first out).
Creating A Running Total
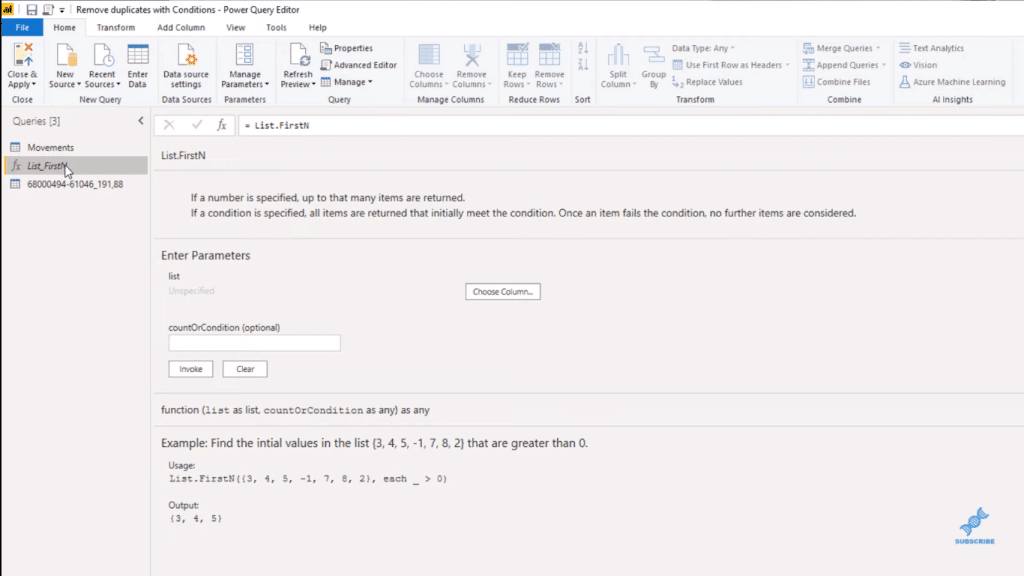
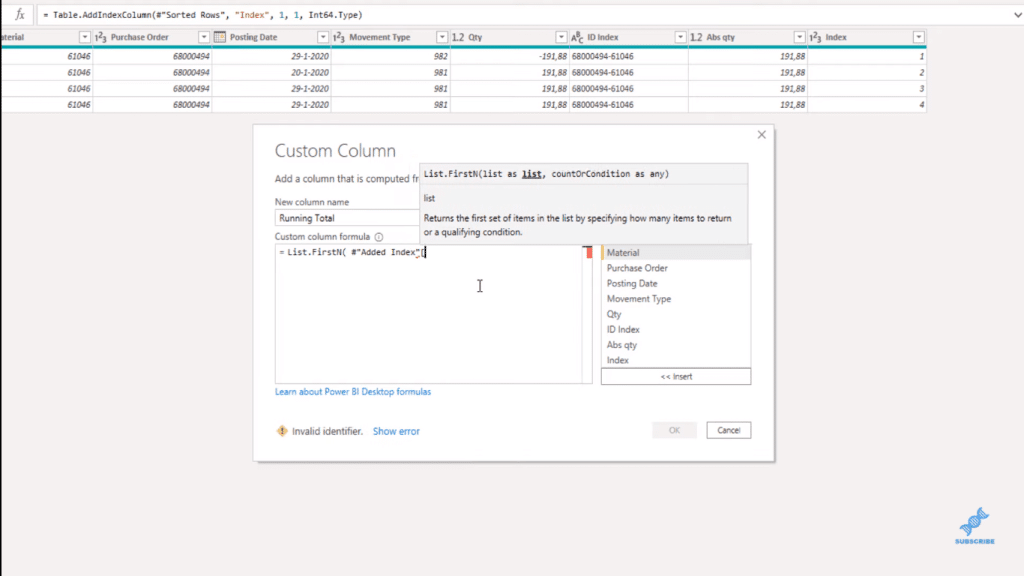
To identify the rows that we’re going to remove, I’m going to add a running total to disable, and we can use a List.FirstN for that task. This function creates a list based on another list, where the top items are kept based on a specific number or on a criteria.
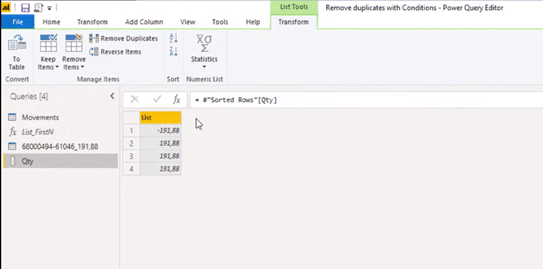
Let’s go back to our query. We need two things for List.FirstN. First, we need that list, and that list is our Quantity column. If I right click on the Quantity column header, we get the option to Add as NewQuery.
And here, we see the code that we need to generate that list. In the applied step, you can see that it points to the last step and then identifies the column in those brackets.
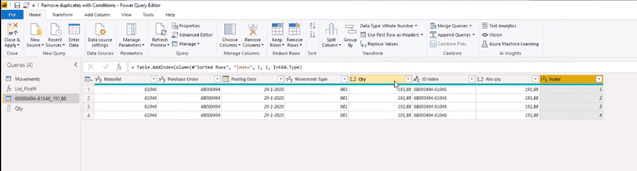
The second part that we need for List.FirstN is a number to identify how many numbers to keep from that list. We can use the index for that, so I’m going to go add an index column from one (1) for this row.
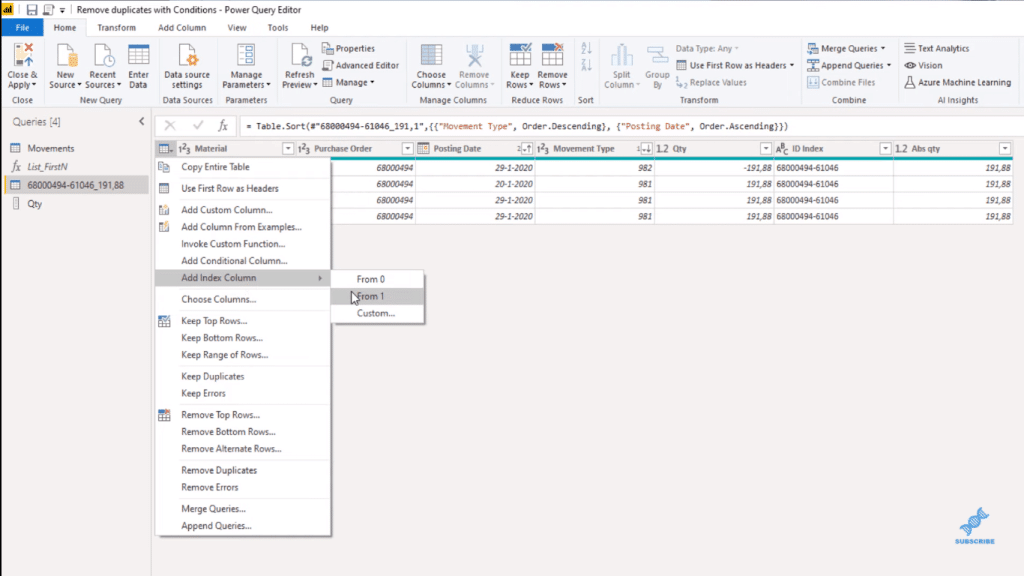
So for number 1, it will keep the number on the first row in the Quantity column, and so on. And we can now sum that up.
Let’s add a custom column, and call it Running Total. We use List.FirstN here, and we can see that the first parameter was that list, the Quantity column. We need to point to the last step, and that last step is the Added Index.
We identified the column that we want, and that is our Quantity column. Our count is in the Index column.
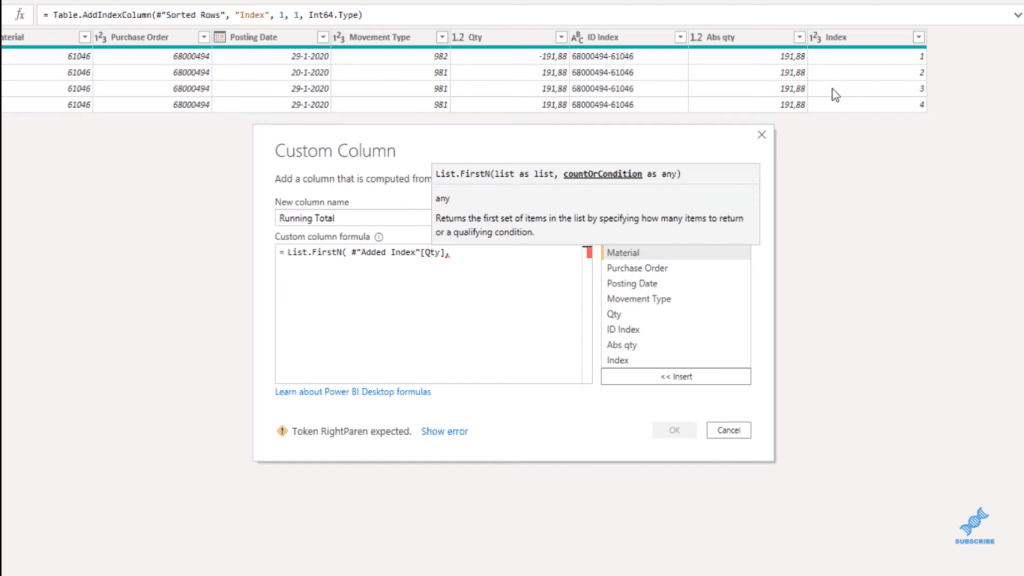
Now it returns a list. If we click on to the side in the white space, we can see the contents of that list. For the first record, it only kept the top row from that list. For the second record, it kept the top two rows.
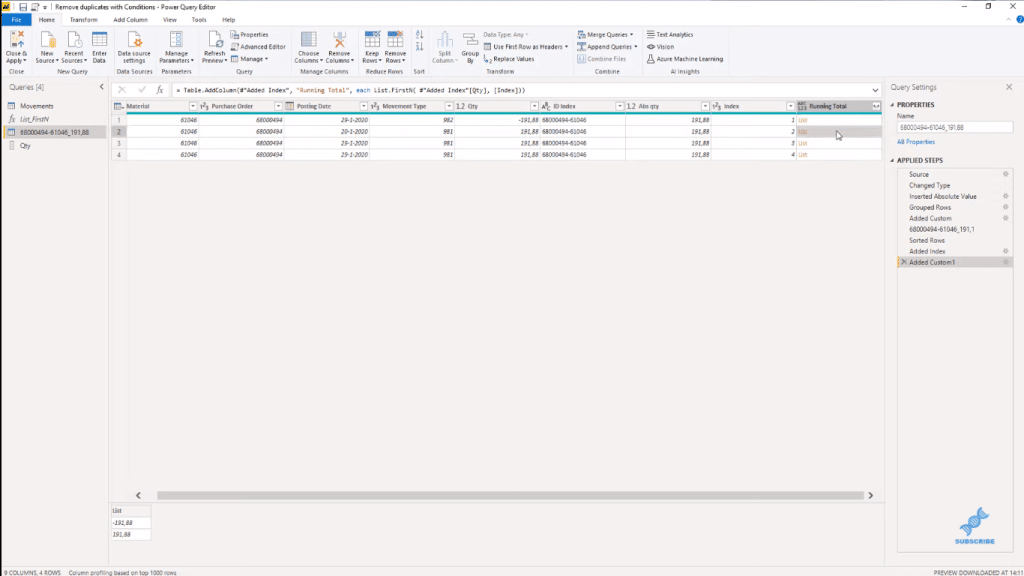
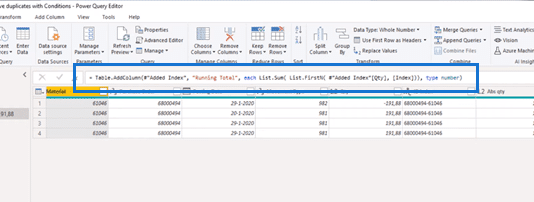
Now all we need to do is sum up these quantities and we can use Lists.Sum to do that. So, I’m going to add that in the formula bar. And I’m also going to put Type.
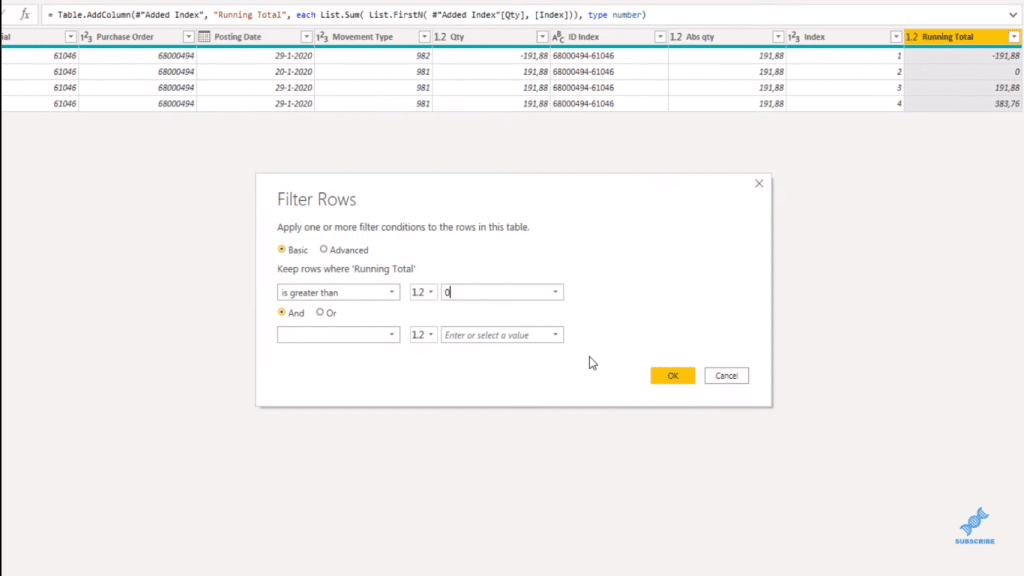
Filtering Rows Based On A Condition
With this running total, we can identify the rows that we want to keep. We only want to keep rows that are greater than zero, so let’s add a filter condition.
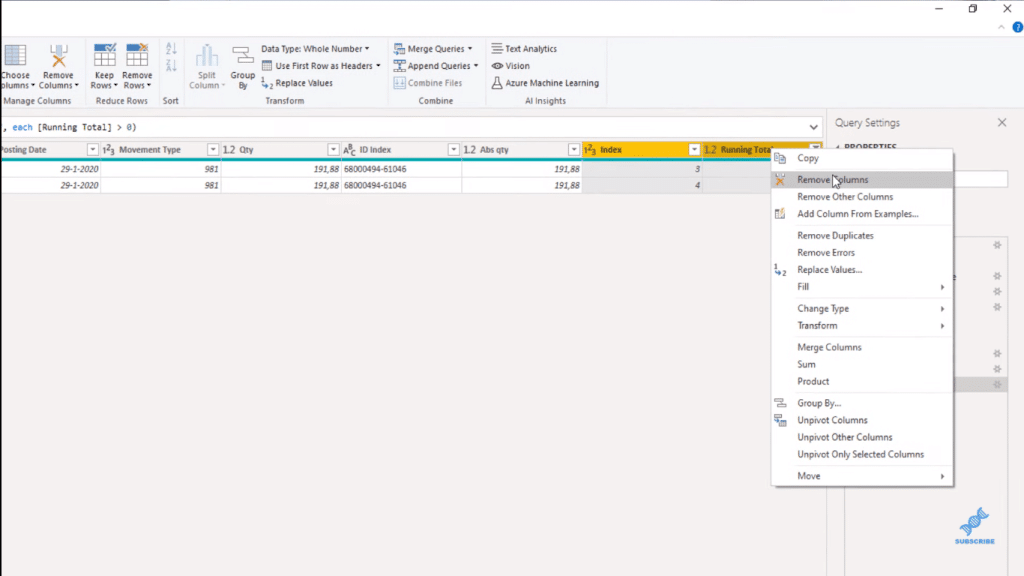
We can now remove our helper columns. Select Index and Running Total, then click Remove Columns.
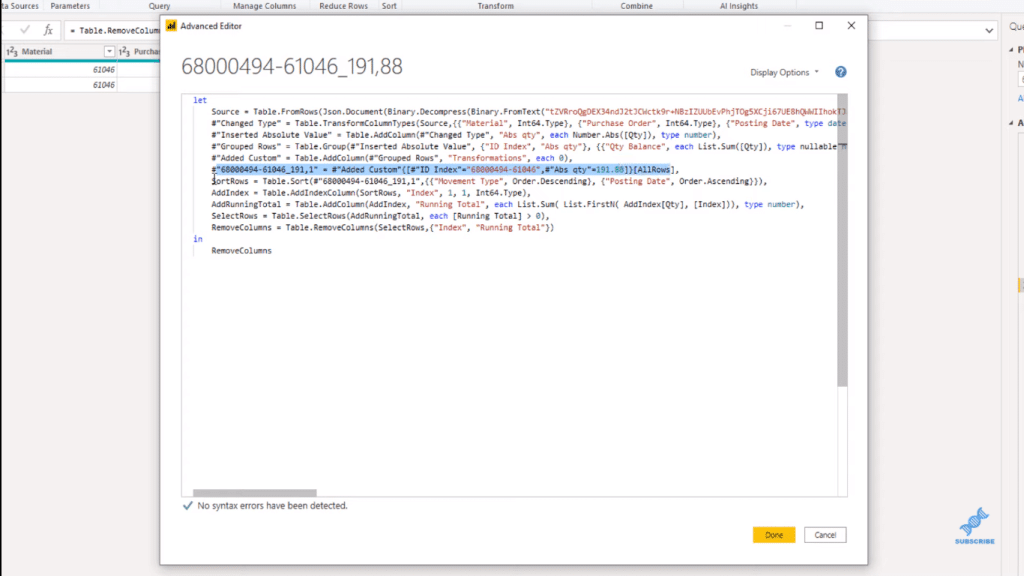
In the Advanced Editor, we can now copy the code that we’ve created. I’ll open the Advanced Editor, and we can see that this is our split step. So, we can select and copy everything below that.
Now let’s move back to our original query. Again, open the Advanced Editor. And instead of the placeholder, let’s move to a new line. I’m going to use the “let” expression because that can capture values from intermediate calculations in variables. So, “let” and then go to a new line and paste my transformations. Also I’ll declare Type.
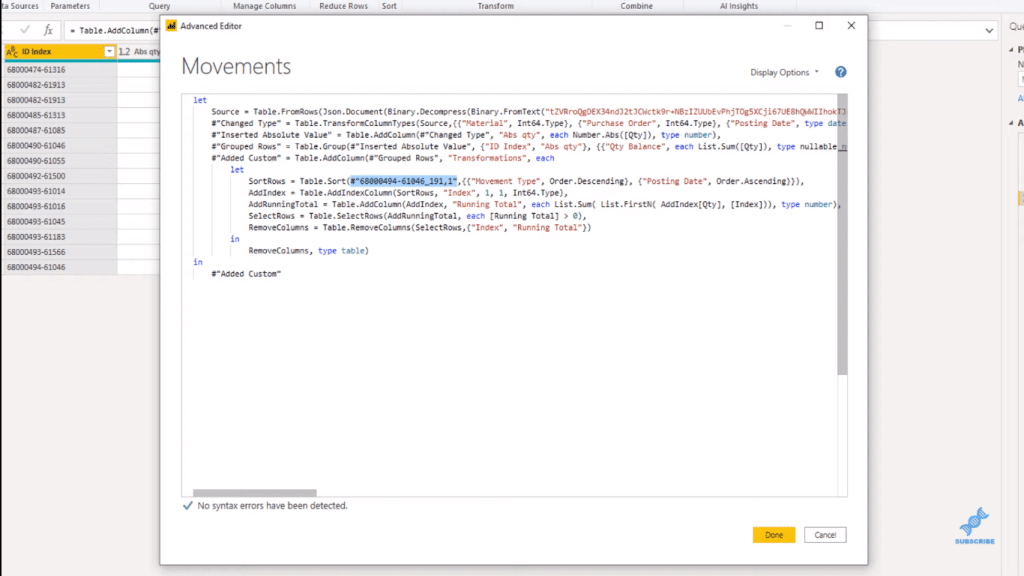
The highlighted code above points to our expanded nested table, which are placed within the All Rows column. So, I’m going to point to that, by replacing this highlighted code to AllRows.
So our transformation column now has nested tables. We build our query based on the last row, right? And that contained four rows when we started and only contained two. We also have those quantity balanced zero, right? And now it has an empty table.
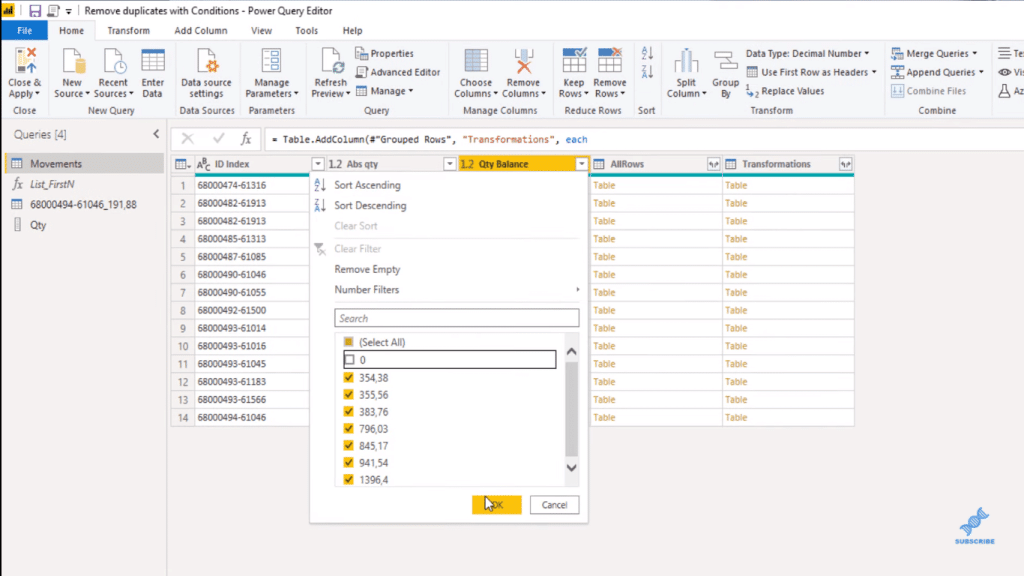
We can remove those by filtering on the Quantity Balance column. We don’t want the quantity balance equal to zero.
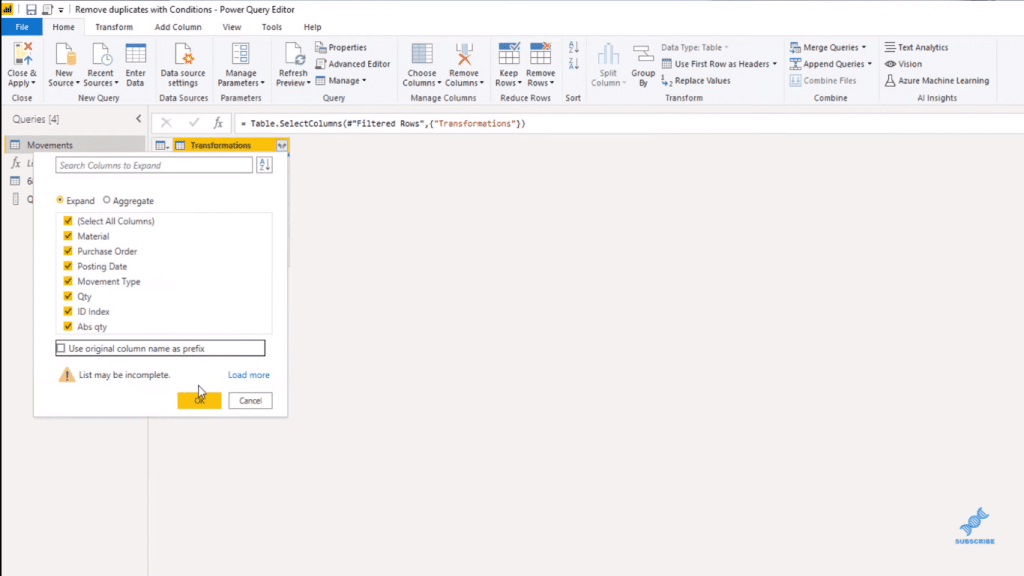
And then, I’m going to select my transformation column and remove other columns. I can now expand my transformation nested tables. Don’t use the original column name as a prefix and press okay.
On the Transform tab, select Data Type, and we’re all done. And that’s how you clean up transactional data.
***** Related Links *****
Unpivot And Pivot Basics In Power BI – Query Editor Review
My Practice Tips When Using The Power BI Advanced Editor
Advanced Transformations In Power BI

Conclusion
In this tutorial, I showed you how to clean up transactional data, specifically removing duplicate rows. This is a great technique you can use when utilizing the Power BI Power Query.
I hope you enjoyed this one. Watch the full video tutorial below for more details. Check out the links as well down below for more related content around Power BI Power Query Editor.
Cheers!
Melissa


