We’re going to explore a really unique Power BI grouping or segmentation example in this tutorial. You may watch the full video of this tutorial at the bottom of this blog.
We’ll create an aged trial balance grouping inside Power BI. This technique involves re-using many of the grouping and segmentation patterns that we already learned. Utilizing Power BI grouping patterns for this unique example is no different.
The idea behind this tutorial is to show you how you can utilize some common grouping or segmentation patterns in Power BI.
This tutorial actually came out from a question in the Enterprise DNA Support Forum, which is based on accounting reporting requirements and aged trial balances.
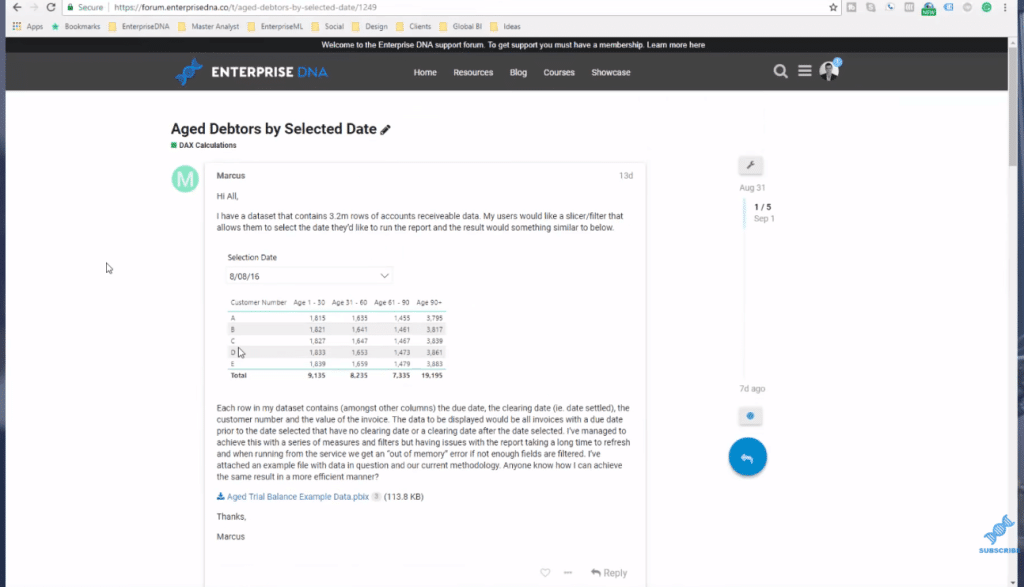
Age trial balances, in accounting, gives us a breakdown of our receivables with outstanding balances and shows us how far out they are. And so, through time, we can see whether we have a lot of receivables due in 60, 90, 120 days or in the next month, etc.
With this kind of analysis, we want to group the data and simplify the report. We’ll use some advanced DAX calculations to achieve this. Before we get to the formula, let’s have a quick look at the sample data I made for this tutorial.
Sample Data Set And Model Set Up
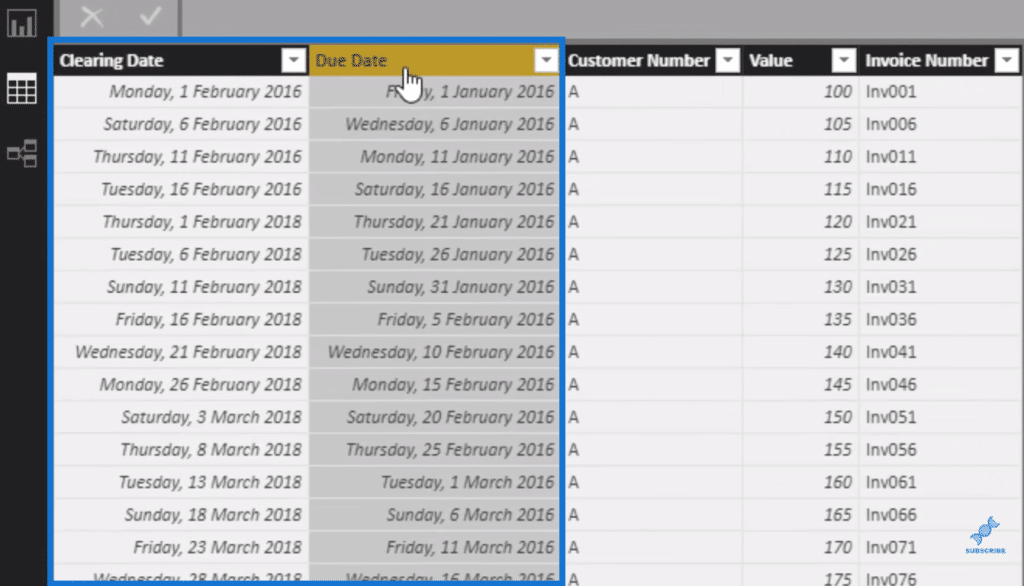
In this table, we have Clearing Date and Due Date columns and we want to work out the difference between these two dates. Then, we’ll group or segment those date differences based on whatever group we select and we’ll do it dynamically.
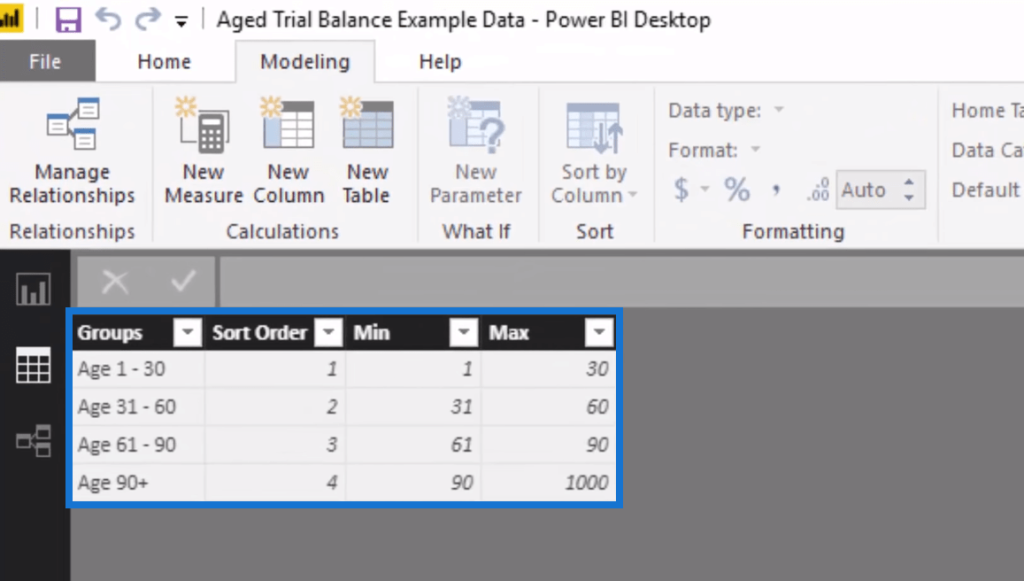
This is the Grouping table that I created for the solution. We have our Groups (age brackets), Sort Order, Min, and Max columns. I just made up the numbers here, but you could rearrange or customize this yourself for your own reports.
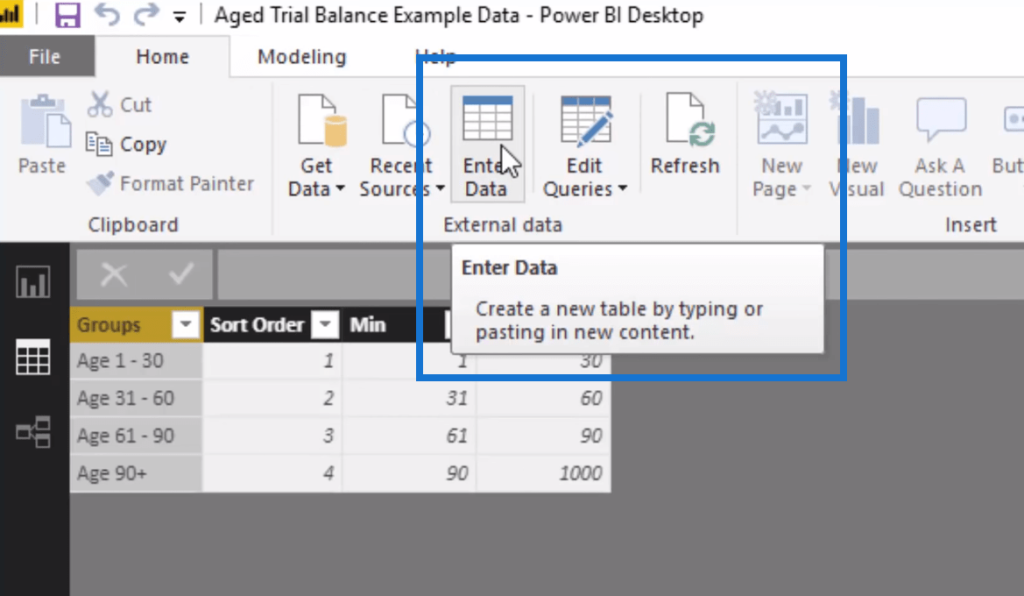
I used the Enter Data to create this table.
The Sort Order column is key when we have text value. We have to make sure that we can sort by something so that the values go on the correct order if we’re showing them in a visualization.
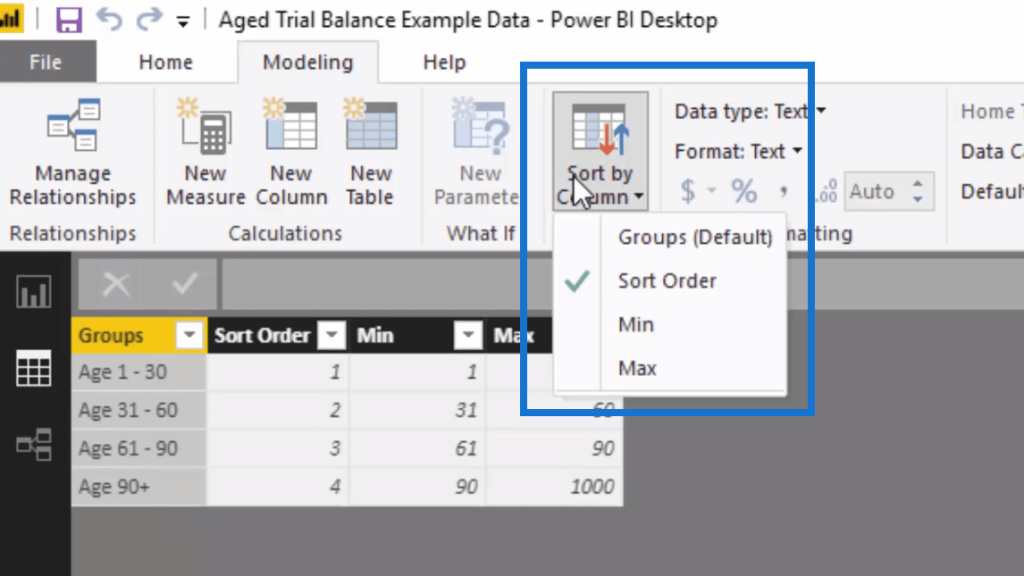
This table has no relationship to anything in the data model. I call tables like this as supporting or secondary tables. We then iterate through this table and run logic through it.
Working Out The DAX Calculation
The first thing we need to do is something really simple, which is to sum up the Value column.

This will give us a core measure that generates some value for us. We can’t actually use this because there’s no relationship between our Transaction table and our Group table. We’ll have to do the filtering within a formula.
So this is the formula that we utilize. I call it Values Per Group and it contains several DAX functions.

This calculation will ultimately return the Total Value, but we need to iterate through each row in the Transaction Table. At every single row, we need to work out the difference (DATEDIFF) in those dates (Due Date and Clearing Date).
In other words, in every row, we’re working out the date differences between those two columns. At the same time, we’re also going through every row in the Aged Debtors Group table. If this logic equals true, the COUNTROWS logic will also be true. In this case, it will return Total Value.
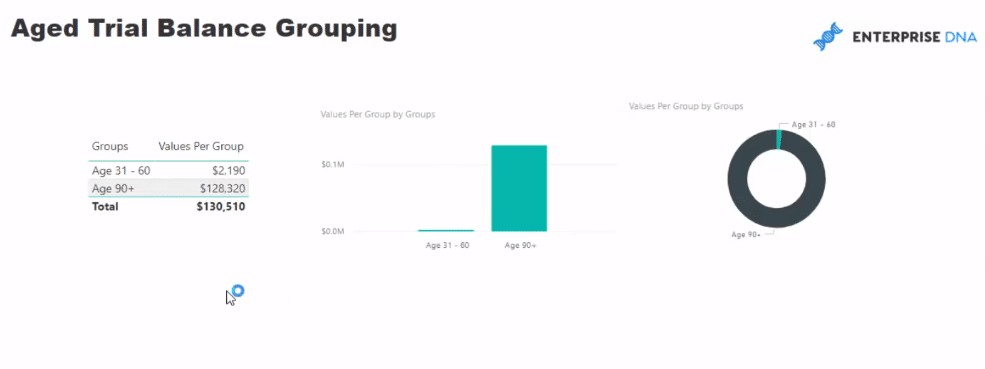
We can then turn this calculations into visualizations.
***** Related Links *****
Use DAX To Segment & Group Data In Power BI
Segmentation Example Using Advanced DAX In Power BI
Power BI Advanced Analytics: Secondary Table Logic Techniques
Conclusion
This tutorial is a unique example of how you can utilize some of the Power BI grouping and segmenting techniques inside your models. It’s a great application, both from an accounting perspective and financial analysis perspective.
We created a supporting table and used some advanced DAX formulas to get the insights we’re looking for. This type of analysis is really good from a cash management perspective and businesses.
All the best!
Sam


