
Forecasting is an important aspect of data analysis, as it allows businesses to make informed decisions about the future based on historical data. One efficient way to perform this task is by utilizing Power BI forecasting model using Python. Power BI is a popular business intelligence tool that allows users to create interactive data visualizations, reports, and dashboards.
In this tutorial, we learn how to create a forecast model in Power BI using Python. We will use Python in Power Query to create forecasted values and bring those into the visualizations of Power BI. You can watch the full video of this tutorial at the bottom of this blog.

Power BI Forecasting Model Samples
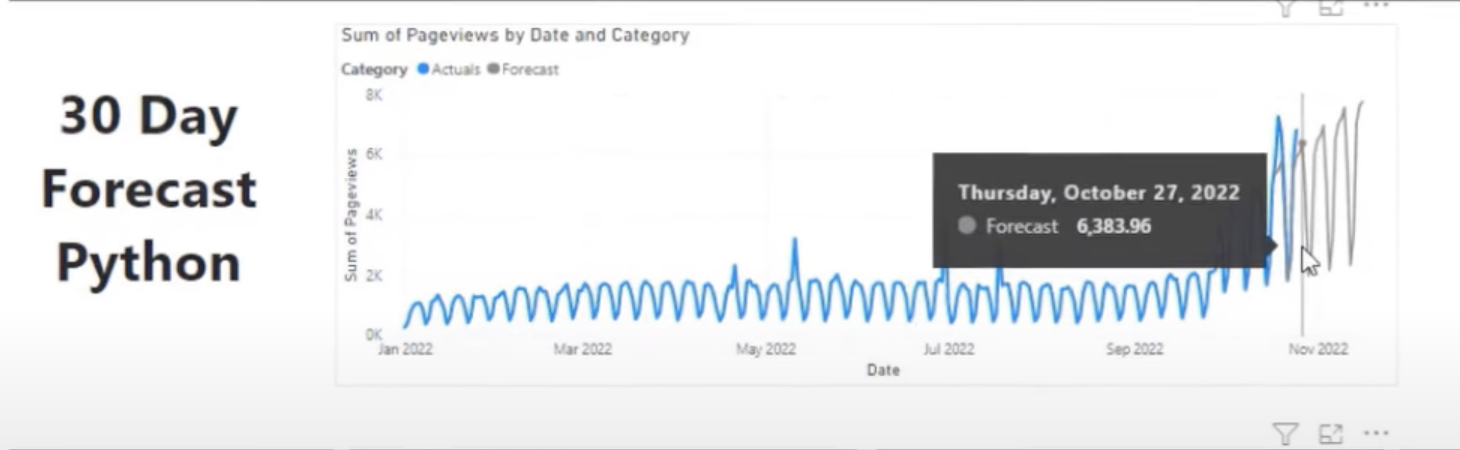
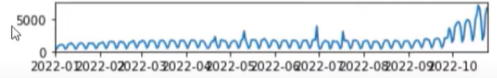
Below are some Power BI forecasting models to show you what we want to achieve in this tutorial. These are actual page views revealing weekly seasonality and some seasonal peaks in the data.
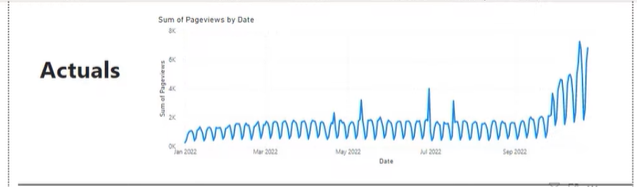
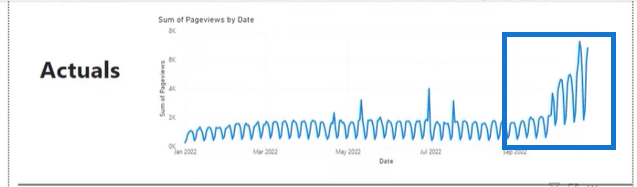
Towards the end, we can see the increasing trend in our data which we want to pick up on in our model.
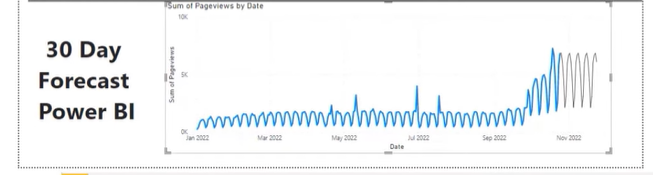
Power BI Forecasting Model: Controls and Limitations
Below is the model for the 30-day forecast created using Power BI. It has the same seasonality as the actual page views, and in Power BI, we also have the options to control some of the data.
We can do that by opening Analytics in the Visualizations pane. Then, hover down to Forecast > Options.
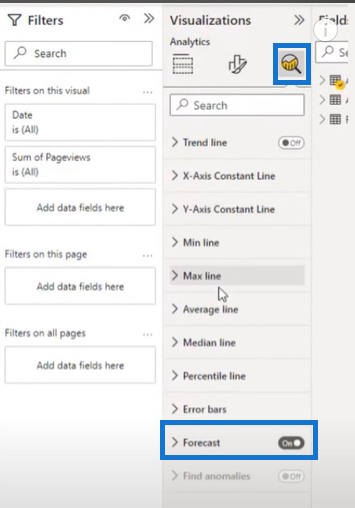
Put 30 days in the Forecast length and set the Confidence interval at 95%. The system can predict the Seasonality with its default setting, but we can also add 7 to represent weekly seasonality.
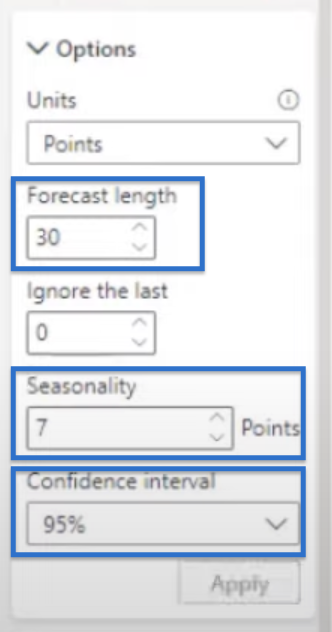
Click Apply and we should get a model similar to the one above.
Trend Analysis For Python And Power BI Forecasting Models
Power BI does a great job of modelling seasonality. However, its trendline does not perform the same.

To start the trend analysis, turn on the Trend line in the Visualizations pane.
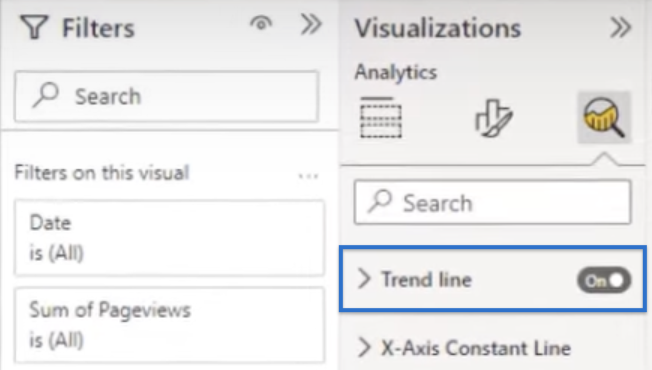
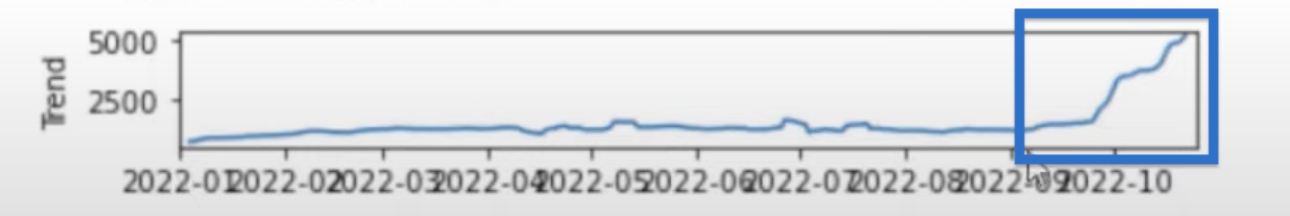
Once on, we can see an upward trend. We should be able to add that trend into our data which will then influence the forecast.

We can do that with our Python model. As we see in the model below, the trend picked up seasonality instead of staying flat.
Using Python Code For Forecasting
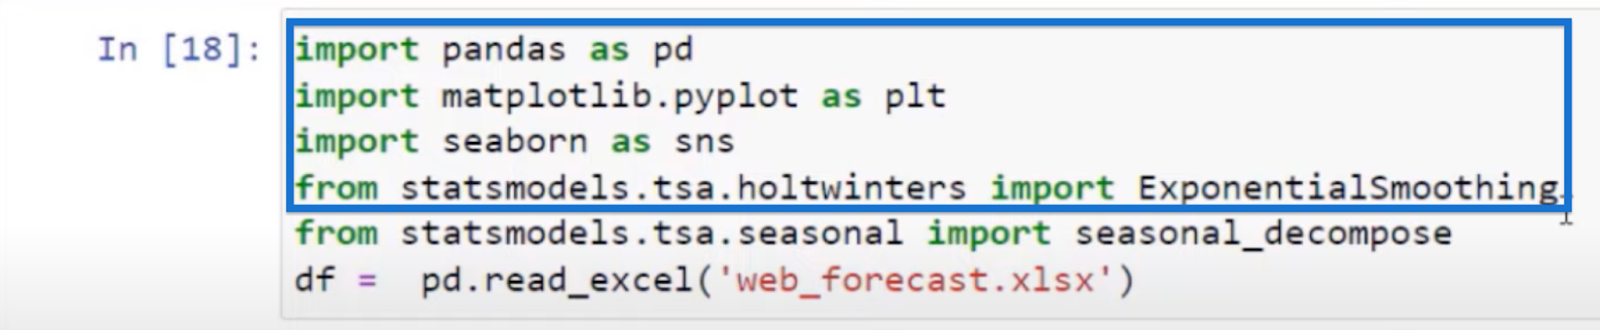
Using Python to achieve our goal is not a difficult task. To start, open your Jupyter Notebook.

Bring in the data that we need: pandas, matplotlib.pyplot, seaborn, and the ExponentialSmoothing.
There are other models that will probably be more accurate, but they will require more optimization.
We will also bring in seasonal_decompose to see the seasonality and trend. Then, use the web forecast web_forecast.xlsx to read our data.
Then, switch the date using the code below.

Set the index of our dataset to Date and call it ts. Then, set the frequency of the dataset. We know that we have daily data, so let’s set the frequency as d as in day and save it as ts.

Finally, plot using ts.plot ( ).

After plotting, we should see exactly what we saw in our Power BI notebook.

To get a better idea of the components in our actual trend, we can use the following code.

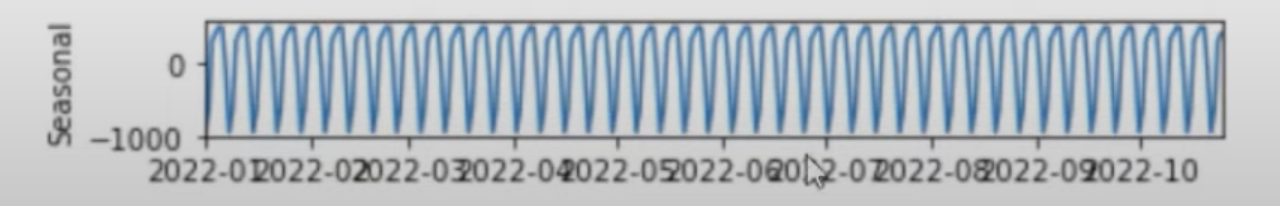
The first model is our Actuals. Next to it is the trend line which we pick up with seasonal_decompose(ts).plot();.
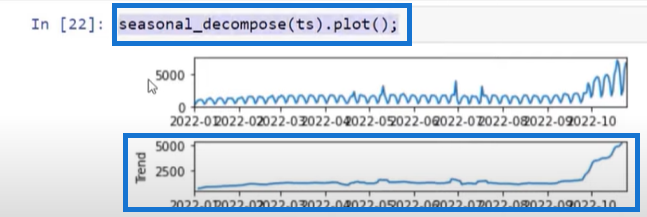
This is the trend that we need to add to the model.
We also have the seasonality that we can add to both the Power BI and the Exponential Smoothing model.

Our last model shows the Residuals or those that are unexpected in the data which are represented by points. Notice that as we move toward the end of our data, we can see that there are a lot more events happening.

Training The Model
With our model, we need to train our data which is typically followed by testing. However, in this case, we won’t be testing our model because we’ll just use what the model gives us.

There are 298 days in our dataset, but in this example, we only need the model to remember 290 of those days. This is because we don’t want to give the model all the data that it can’t learn and will eventually just copy.
Basically, we have this training set of 290 days out of 298.

Next, use ExponentialSmoothing for our model. Then, pass in the training dataset which is 290 days, and use add (additive) for our trend, mul (multiplicative) for our season, and 7 for the seasonal periods. Then, fit that data into the model.

Additive & Multiplicative Trends
Let’s have a quick overview of what the additive and multiplicative trends are.
In an additive model, the trend slowly adds, whereas in the multiplicative model, it exponentially increases and there is quite a lot going on as well. We can use either of the two to get a different type of prediction.

We can play around with the additive and multiplicative methods to modify our prediction. Our present data are clearly growing so it’s imperative to use additive, but we can also try using multiplicative to see what we’ll get.

For example, change the seasonality from mul to add.

Run the data and observe how the prediction changes.

Similarly, we can change the trend from add to mul.

This should yield a multiplicative trend that is a little bit bigger.

After trying the possible combinations, using mul for both the trend and seasonal was found to yield the BEST result.


Once we have this forecast model, we can then use it to forecast 30 days in advance.

Power BI Implementation
Let’s create the same Power BI forecasting model in our Power BI notebook.
In our Power BI Forecast, go to Visualizations > Analytics > Options. Notice how we set the Forecast length to 30 days.


Let’s see how we can implement that code very easily in Power Query.
Click Transform data.

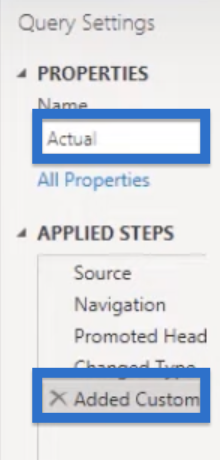
In the Power Query Editor, bring in the data and Add Custom column for the Category. Use Actuals so we can later split the Actuals from Forecasts.

If we go to the Forecasts Query, we’ll see a smaller data set equivalent to 30 days into the future.


Reviewing The Python Script
Our Python Script contains similar information. First, we bring in a dataset, save it as df, change Date to datetime, and set the frequency to d (day).
We also bring in our ExponentialSmoothing model from holtwinters. We take the first 290 days as our training set and then add that data to the model.
In our ExponentialSmoothing model, we add the training data and set both the trends and seasonal to mul (multiplicative) and the seasonal periods to 7 days. Then we fit our model.
Next, we get a new data frame or table with our forecast. We reset the index and make sure they are named Date and Pageviews to match what we have in our original data. Finally, we click OK.

In the output, we are given all these variables within the data.

Go to Applied Steps and click Added Column. This opens a table with our predicted values and the custom column which has Forecast as the category.

In the next query, we simply append the two data sets where we have the Actuals and the Forecasts.

Click Close & Apply.

The model slightly changed when we applied the multiplicative method.
Compared to Power BI, we can easily do a forecast and optimize the model a little bit more by changing the additive nature of the trend and the seasonality in Python. We can likewise add those predictions to our actual data set.

***** Related Links *****
Creating Forward Forecasts in Power BI Using DAX
How To Do Trend Analysis In Power BI Using DAX
Managing Seasonality In Your Budget Analytics – Advanced Power BI
Conclusion
In this blog, we walked through the process of creating a forecast model in Power BI using Python. By integrating Python into Power BI, we can access a wide range of data analysis and modelling tools, which allows us to create more advanced forecasts.
With the skills you have learned in this tutorial, you can now create your own forecast models in Power BI and use them to plan for the future with confidence. Remember that forecasting is an iterative process, so don’t hesitate to experiment with different algorithms and techniques to find the one that works best for your data and continuously check and update your model as new data comes in.
All the best,
Gaelim Holland


