In this tutorial, I’m going to show you how I set up my models and the relationships in it. Creating a seamless flow around Power BI data transformation can greatly improve the report development process, and the way you set up your models is a primary contributor to this flow.
To clearly portray my Power BI data transformation process, I’ll use the report I submitted as my entry for Power BI Challenge #10 as an example. I’m also going to use the same data set provided for that challenge.
Cleaning The Data Set
This is what the data set looks like. It’s in an Excel file and has a number of different tabs.
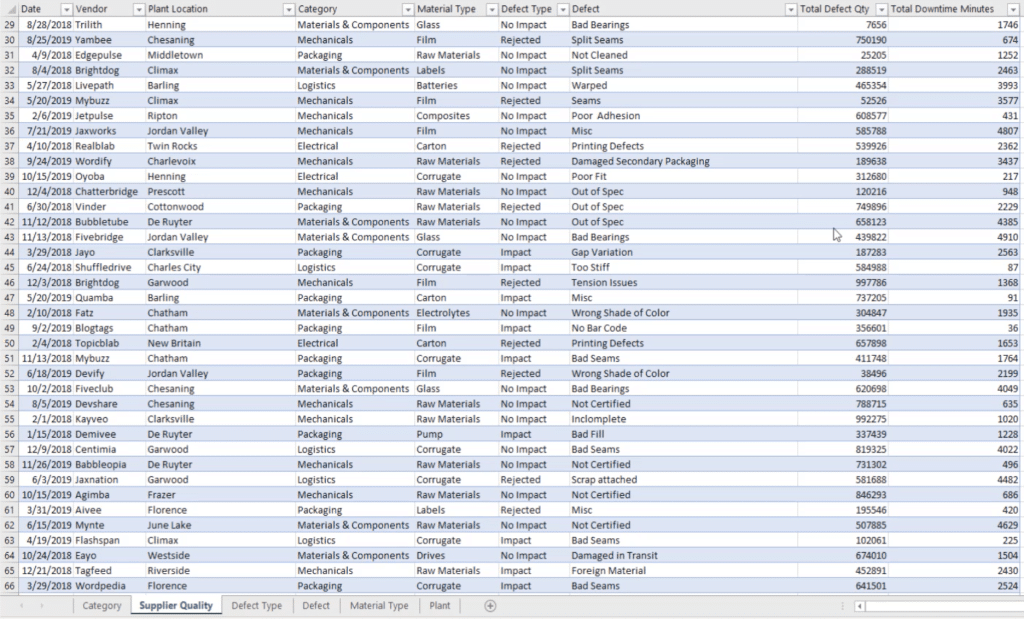
Because I like keeping things simple, the first thing I usually do with data sets like this is to find out whether I need everything in it. I’ll go through each tab to check. Let’s start off with the Supplier Quality tab.
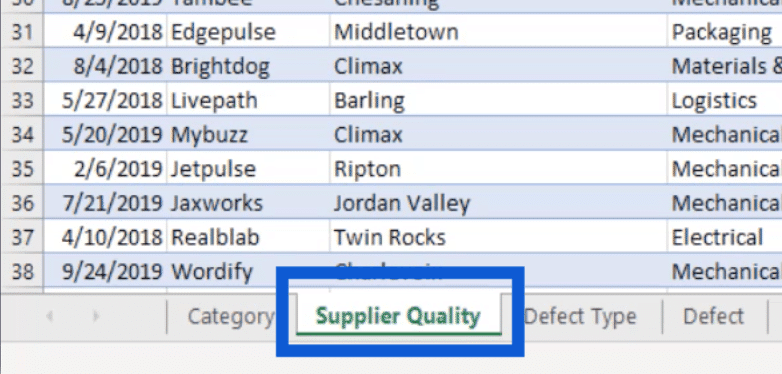
It looks like majority of the information is on this tab – vendors, plants, defects, total downtime, etc.

One look at this and I know that this is something I’ll be using for my report.
The next tab is the Category tab. It has the category ID and the category name.
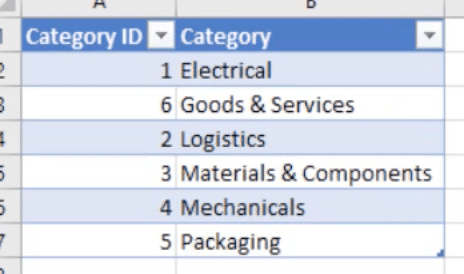
The category ID doesn’t really do much for my report, and the categories given are already in the Supplier Quality tab. So I’m going to delete this tab.
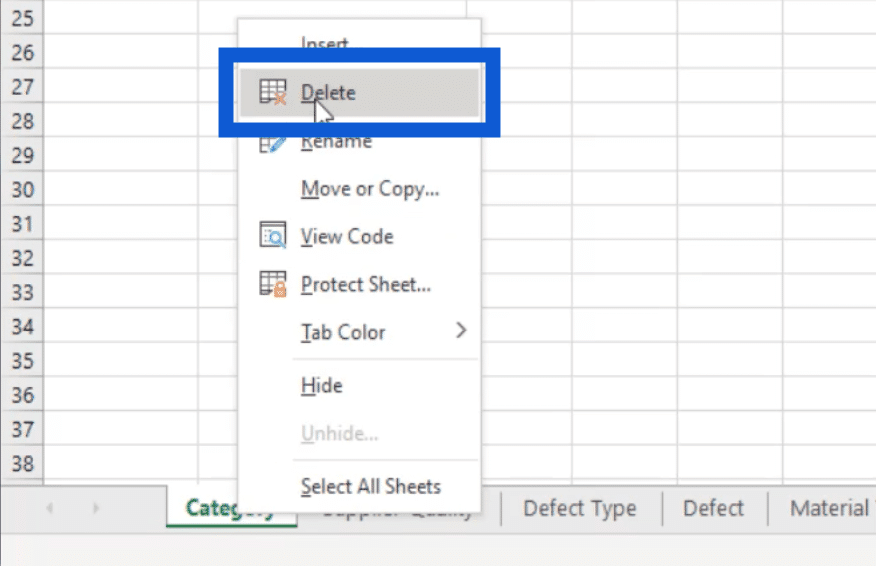
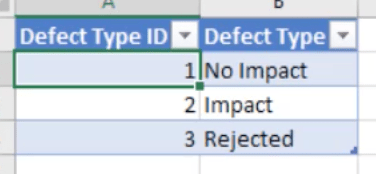
The next tab is for the defect type. Just like the category tab, the ID isn’t really useful and the defect type itself is already part of the supplier quality tab. So I’ll delete this, too.
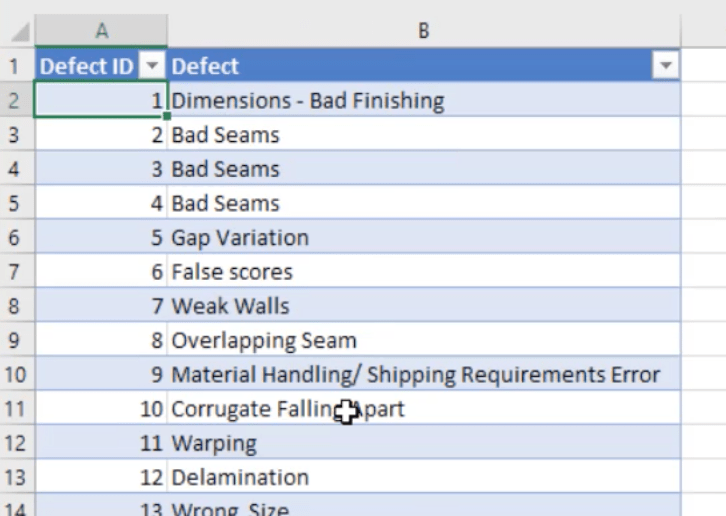
The defect tab gives me a list of descriptions of the defects. This is also part of the supplier quality tab, so I’ll delete this.
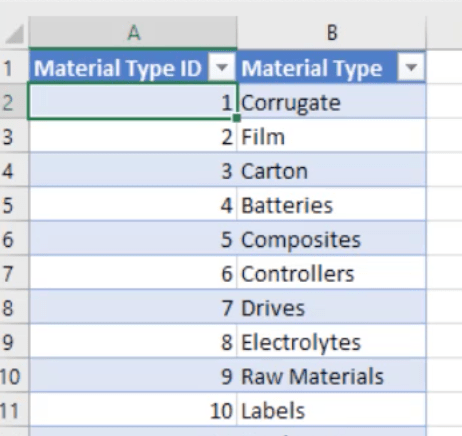
The same thing goes for the material type.
The last tab is for the plant location.
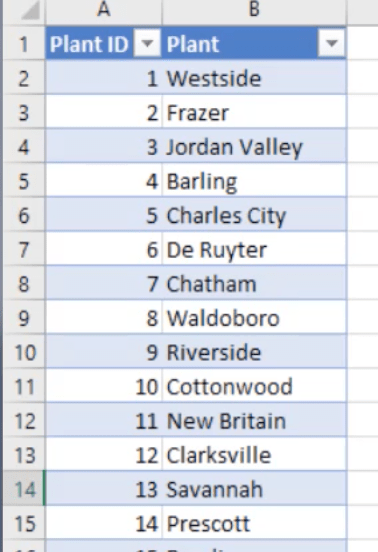
Looking at this tab, I can imagine having a map visual on my report. This will definitely be helpful for me, but I’m going to need some additional information.
First, I would need to add a state. If you’re from the US, you’ll know that some cities have the same name in different states. So it’s important that the state is also added here, as well as the latitude and longitude.
There are a lot of ways to do the latitude and longitude, but I decided to do it through Google Maps.
Since the first city on the list is Westside, Iowa, I just did a search for it on Google Maps.
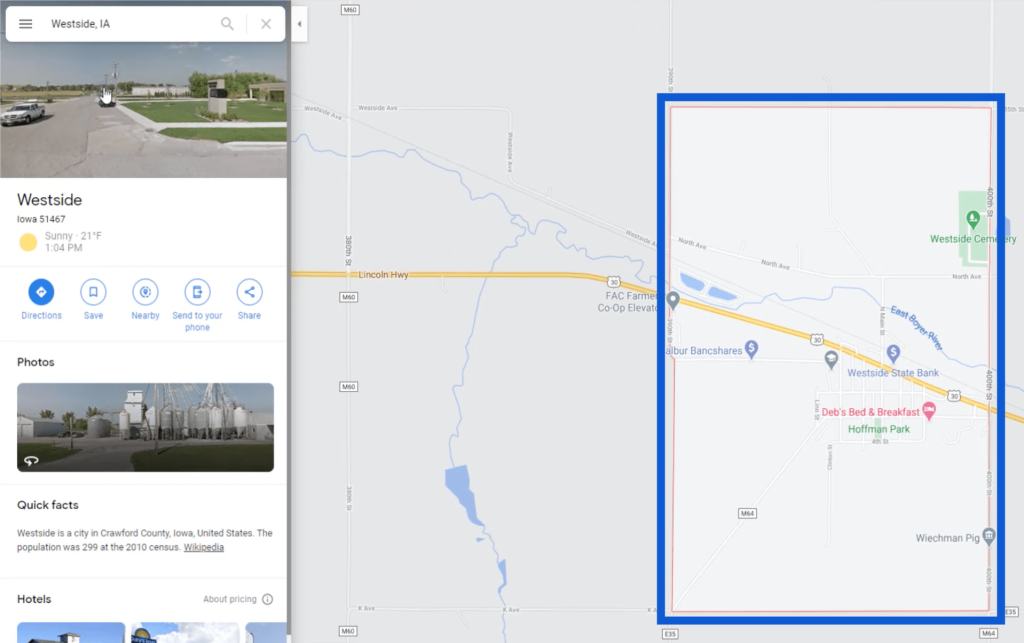
It gives me an entire area, but does not give me an exact pinned position. So I’m going to click on “Nearby” to get an exact pin.
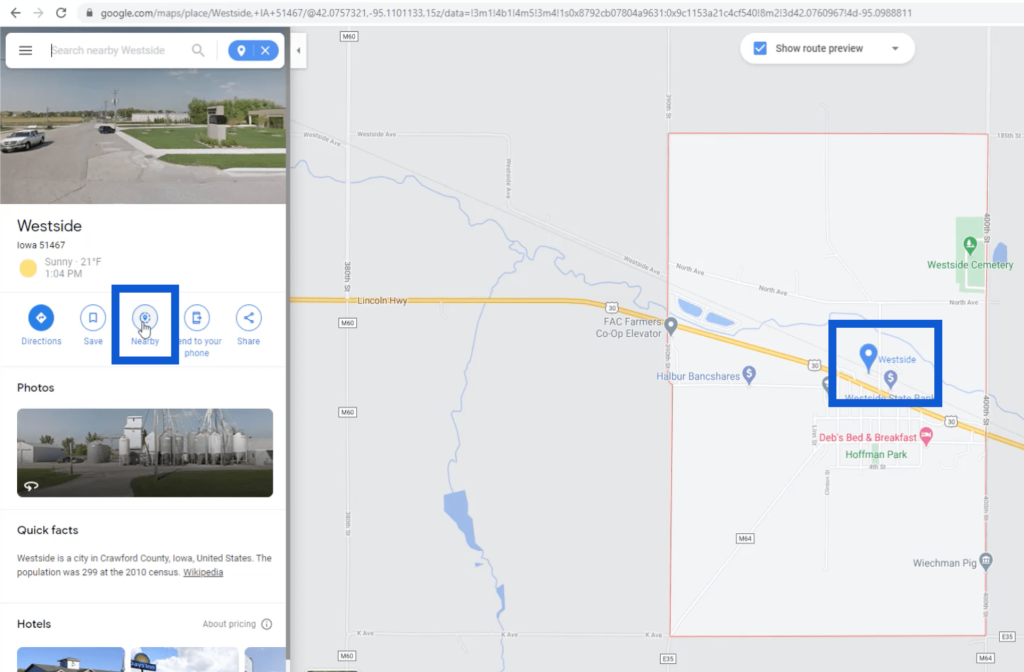
Now that I have an exact location pinned on the map, I’ll just do a right click on it to get the latitude and longitude.
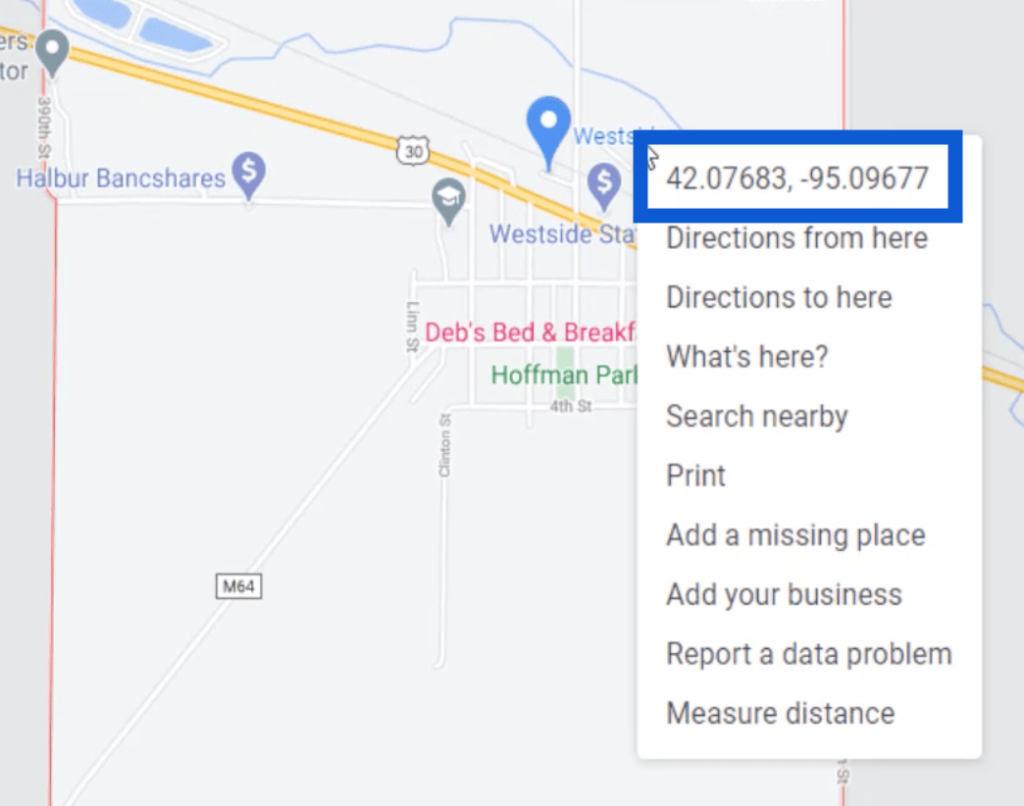
I did this for each one of the 30 plant locations. Then, I added it onto the spreadsheet.
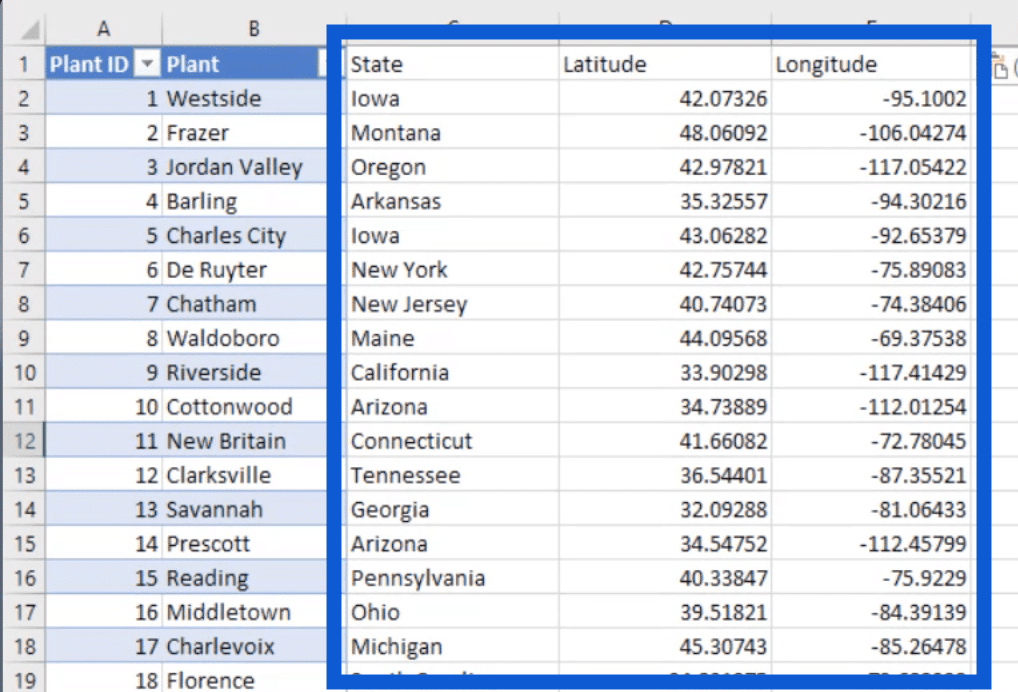
So I’ve cleaned up the data set and added all the information I need. All I have left are two tabs – Supplier Quality and Plant.

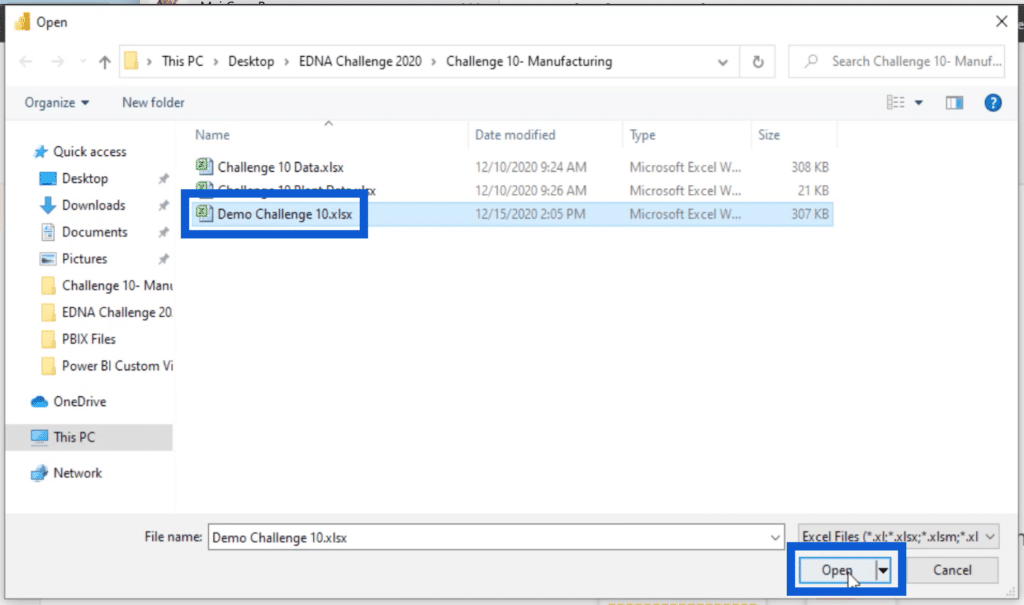
I’m going to save this file as Demo Challenge 10.
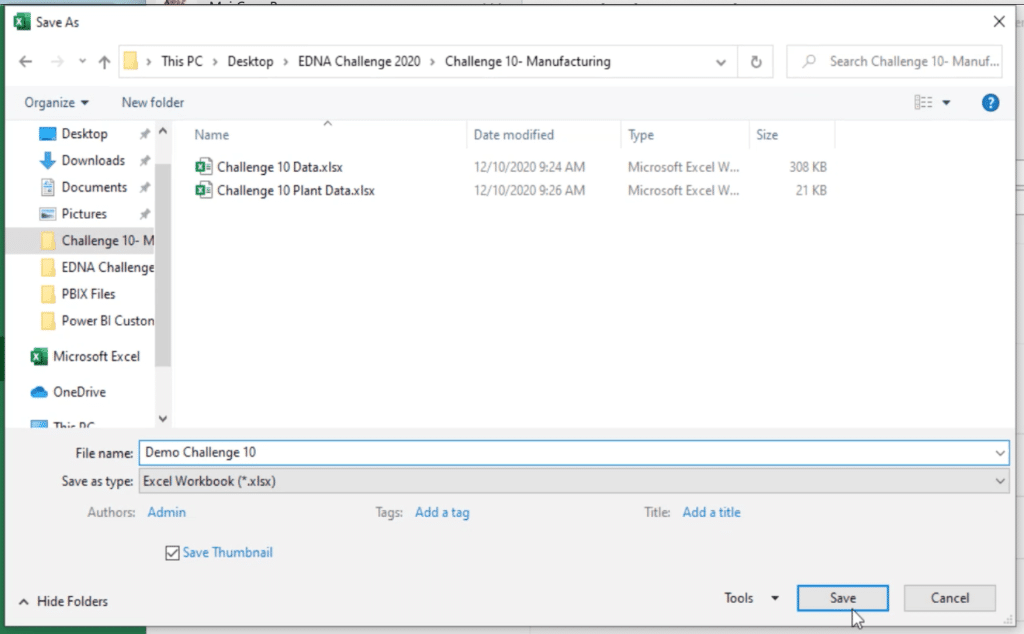
Now that I have my data set ready, it’s time to import that into Power BI.
Importing The Data
Before I import the data set we saved earlier, I want to show you a template that I’ve been using for most of my reports, especially for my submissions to the Power BI Challenges. It’s a PBIX file that contains a ready-made date and period table.
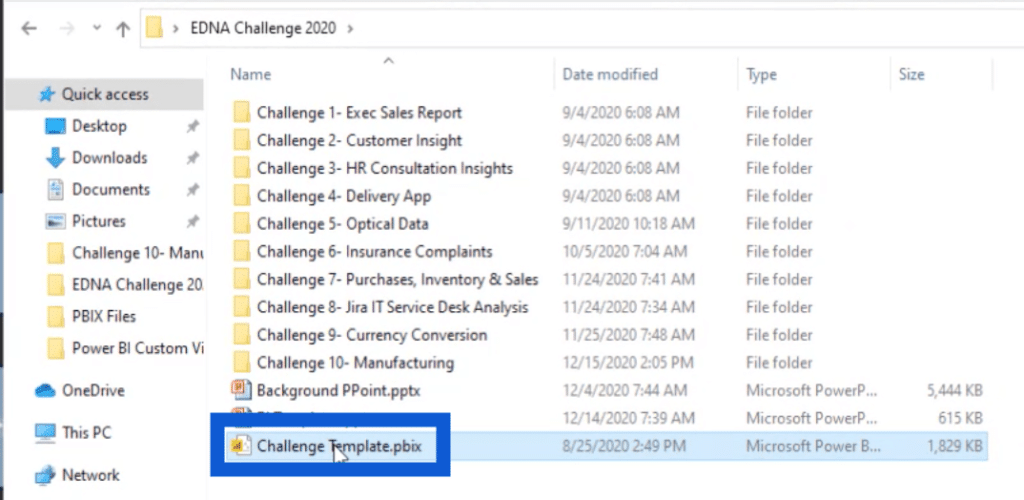
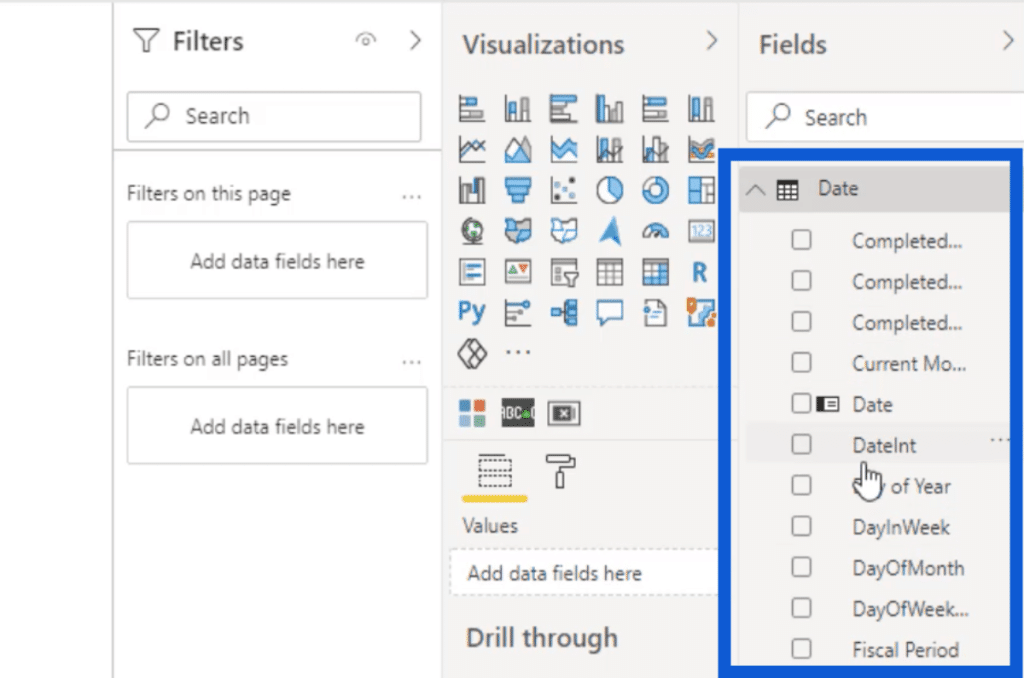
When I open that file in Power BI, it shows the date table already set up in my Fields pane.
I also have a period table in here as well. This allows me to customize and do a lot of different things using a slicer.
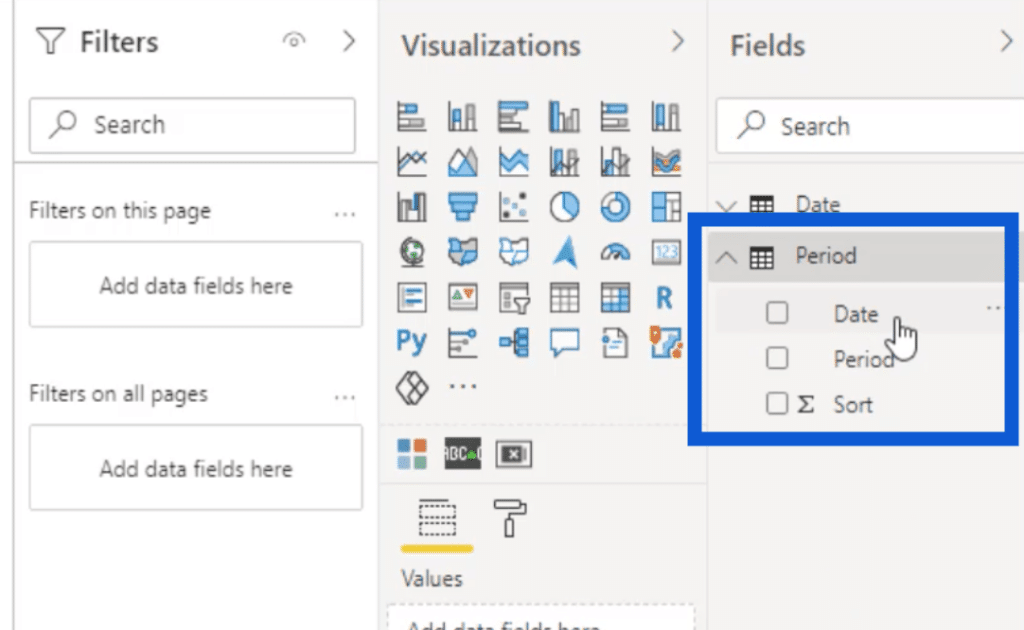
If I open that period table, it offers a number of different filters like today, yesterday, current week to date, etc.
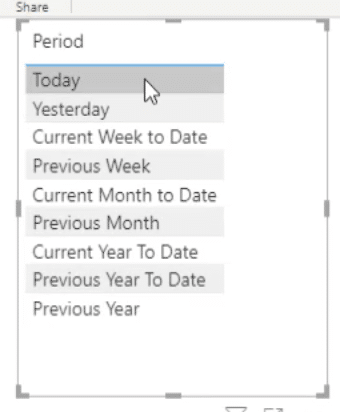
I did a video tutorial on how to set up a template like this before. You can also find the M code I used in the forum.
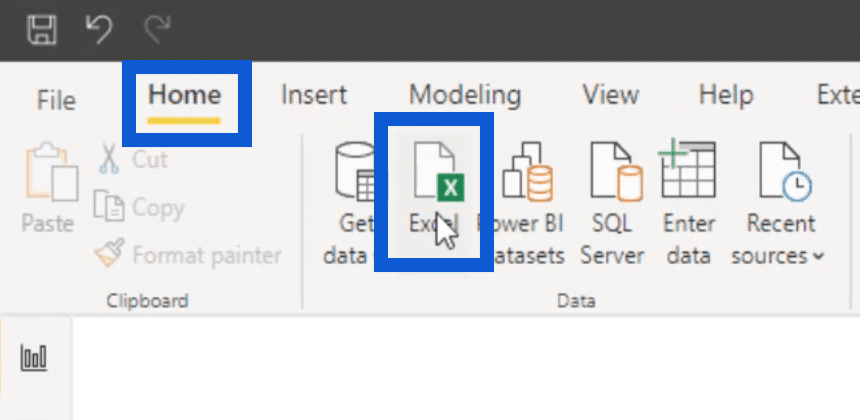
Now that I have my template, it’s time to import my data set. To do that, I just need to click on the Excel icon under the Home ribbon.
This opens up a box where I can choose the right file and open it.
It might take a while to load sometimes, depending on how much data the file contains. But once it’s imported, it will show you the tables that you can use.
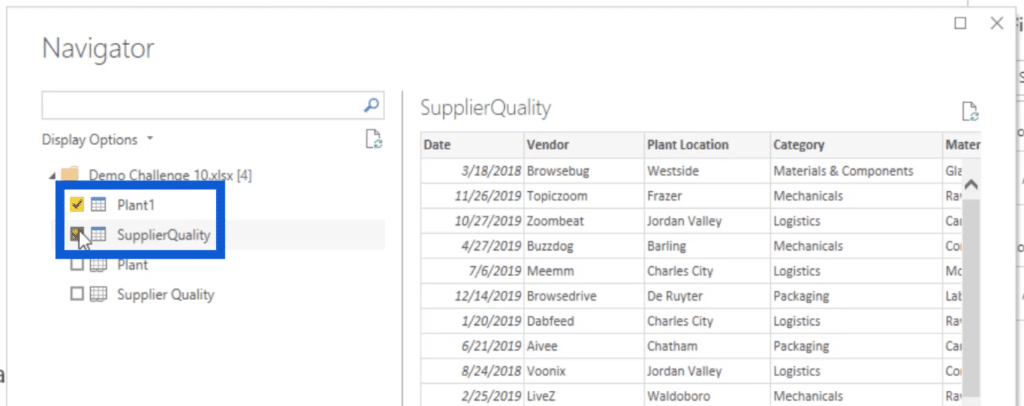
I’m choosing the Plant and Supplier Quality tables since those were the tabs that I set up earlier for this report.
Power BI Data Transformation
Now, I’ll show you some simple techniques in my Power BI data transformation process. Once those boxes have been ticked, some would click on Load right away. As for me, I always click on the Transform Data button first.
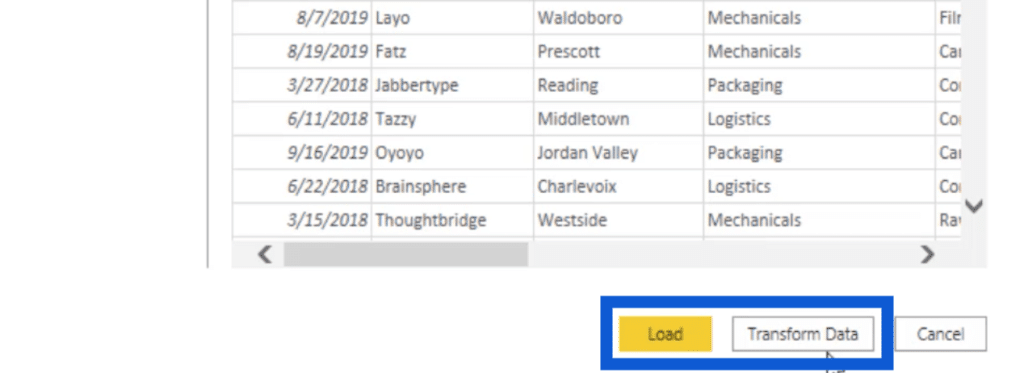
The Transform Data loads up the data in the query editor and allows me to check if I have the right data. Remember that aside from the tabs that I fixed on Excel, I also uploaded that template I normally use. Going into the query editor first allows me to work on my data smoothly without having to go back and forth.
This is what it looks like in the query editor.
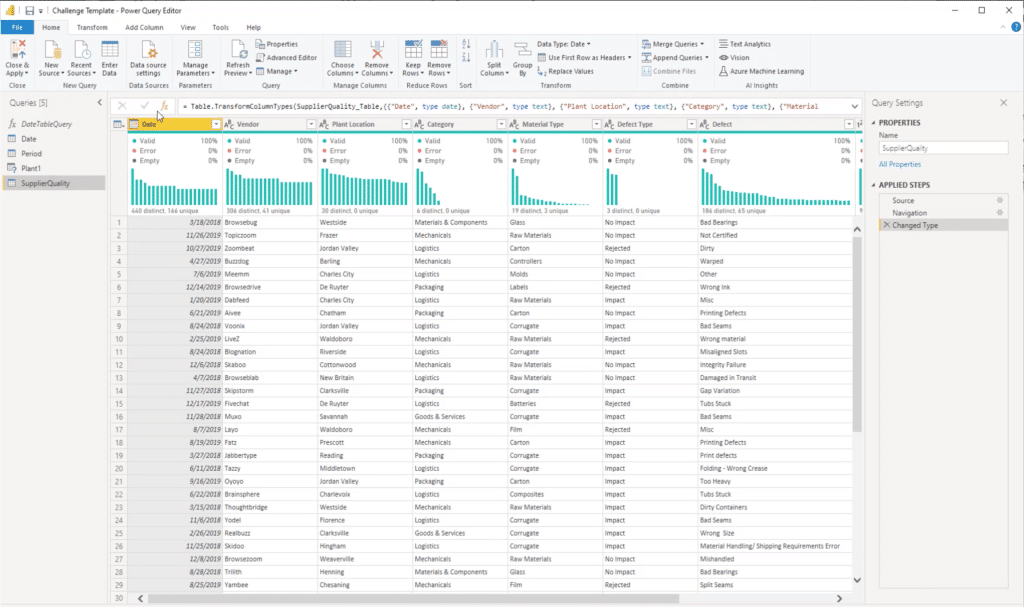
I’m going to check on my Date table first. This query is only set to show 2019 and 2020 data.
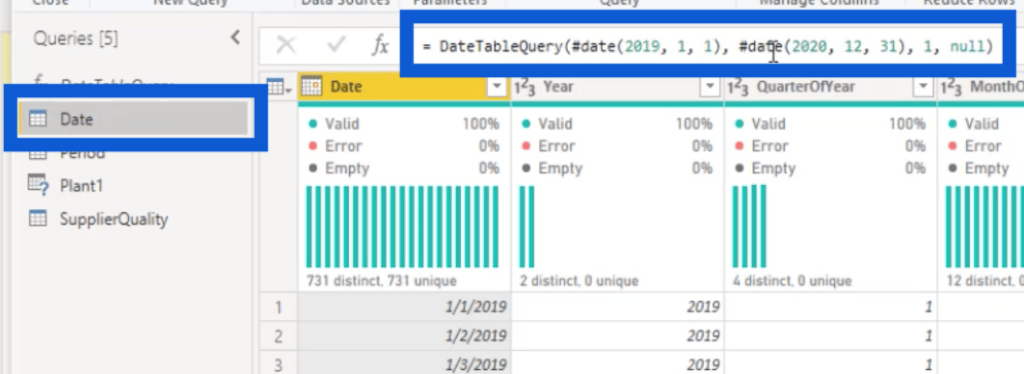
But in the data set, I believe that I have data going back to 2018. So I’m just going to change this to 2018 and hit the tab key.

Now I have data from 2018 to 2020 for my date table.
I’m going to check on my Period table next.
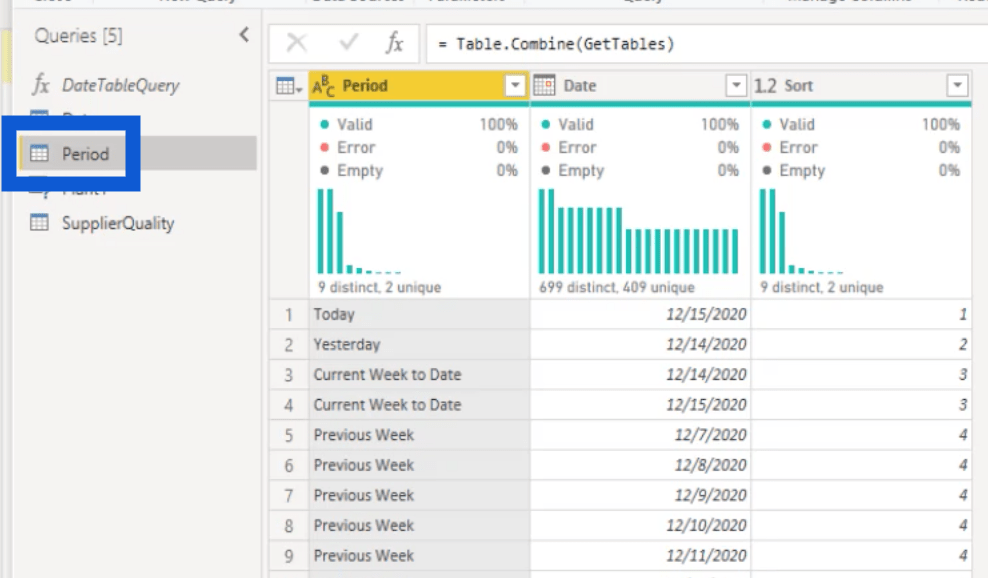
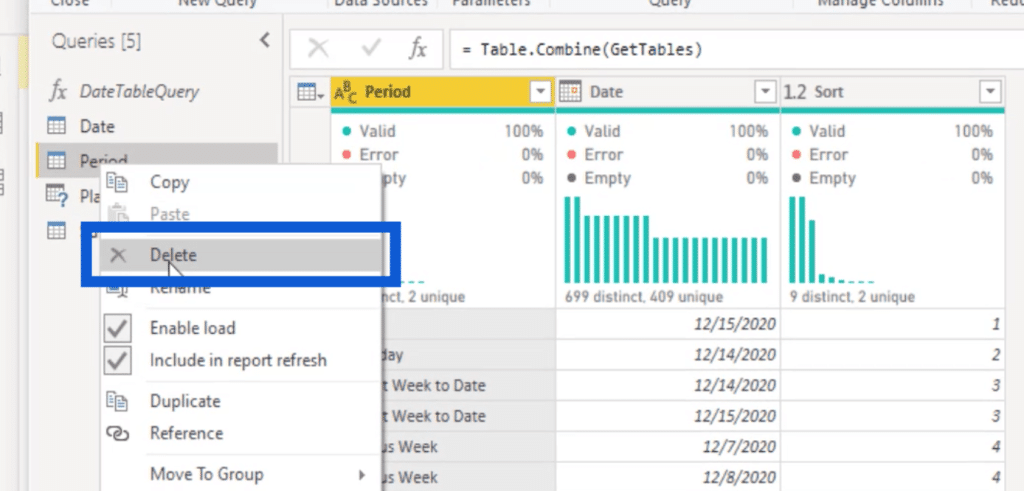
This period table comes with my template, but I don’t think I’ll be using this for my report. So I’m going to delete it.
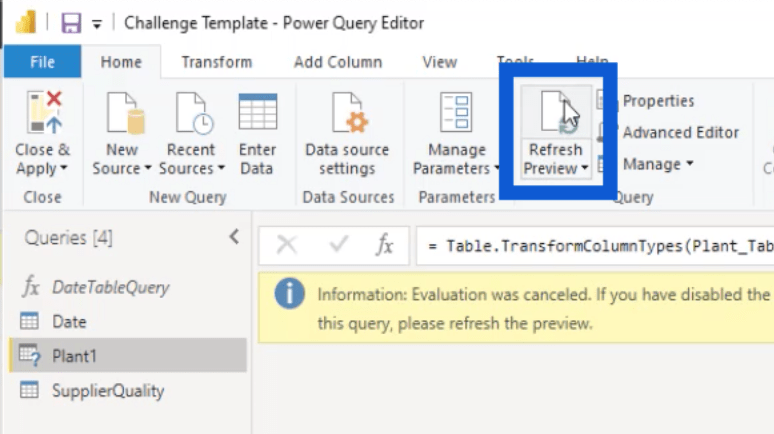
I’m going to check on my Plant table next. Sometimes, you might encounter an error like the one below.

If this happens, just hit the Refresh Preview button on the Home ribbon.
Once the table loads, I make sure that all the important information is here. Remember that this is the tab I edited earlier, so I have to make sure that everything I added is here.
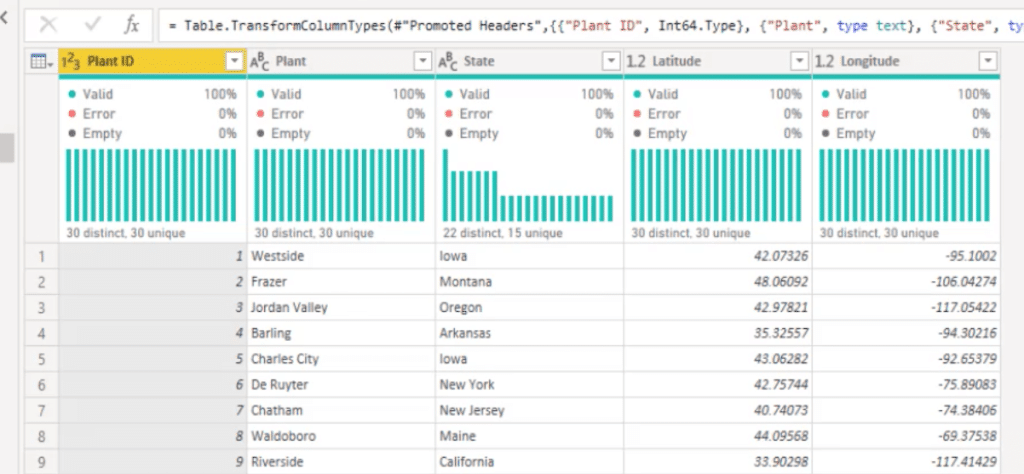
It’s showing the right information, with the plant ID and the plant location (the default columns), as well as the state, latitude, and longitude (the columns I added).
I also click on the Detect Data Type button under Transform to make sure the columns show the right type.
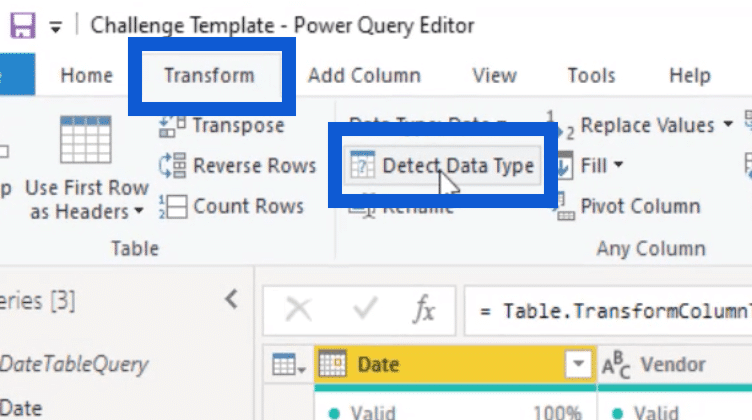
When I open my Supplier Quality table, I would do the same thing.

As you can see, most of the columns are the same type. They’re mostly text, except for the total defect quantity and the total downtime minutes, which are numbers.
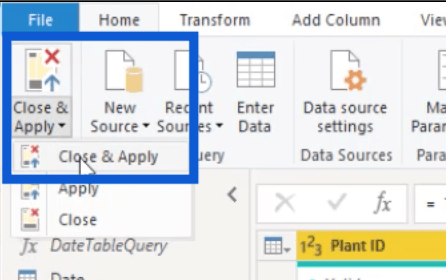
Now that I have three tables here – date, plant, and supplier quality – I’m going to hit Close & Apply.
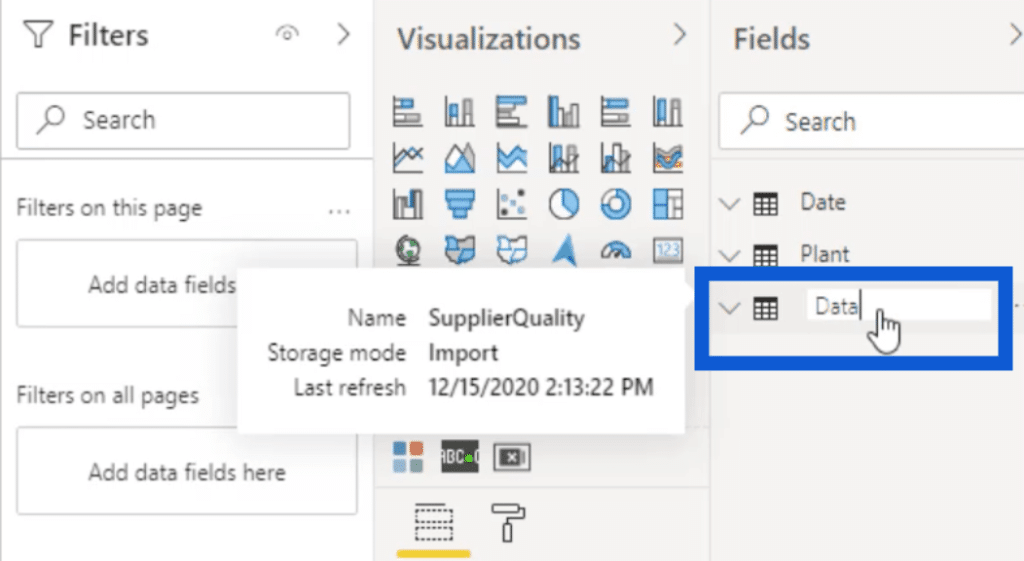
Once these changes have been applied, I’m going to check on those tables under the Fields pane. Just to keep things simple, I’m going to change Supplier Quality into Data.
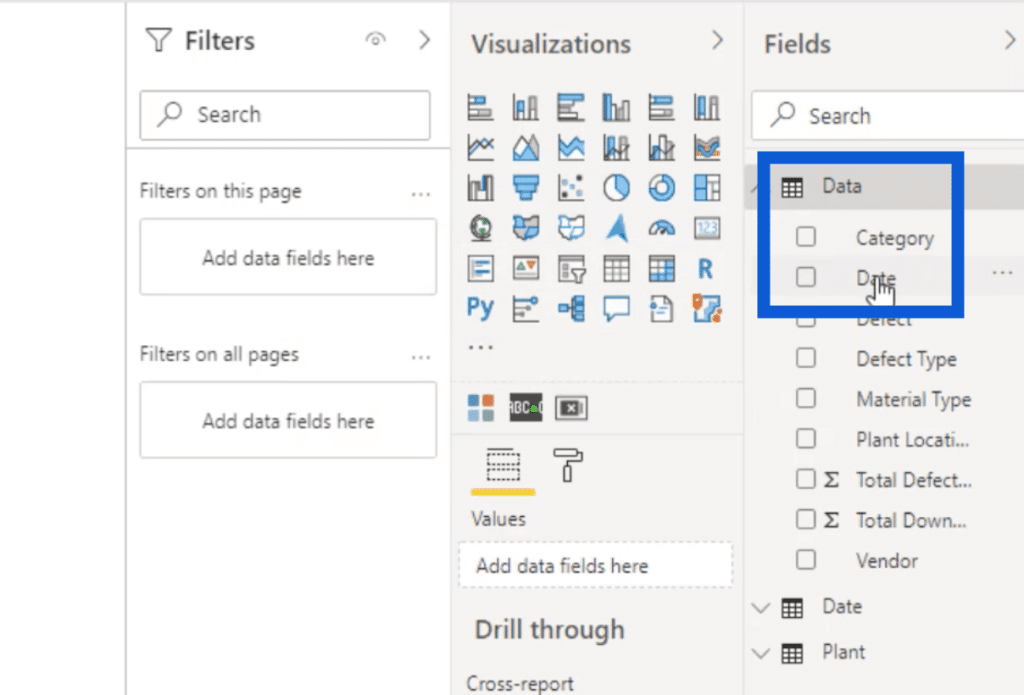
After changing that, I’m going to check what’s inside that Data table and transform the data as needed. I’m going to check on the Date column first.
Since I’m in the US, we usually write down dates using a two-digit format; two digits for the month, two digits for the day, and two digits for the year.
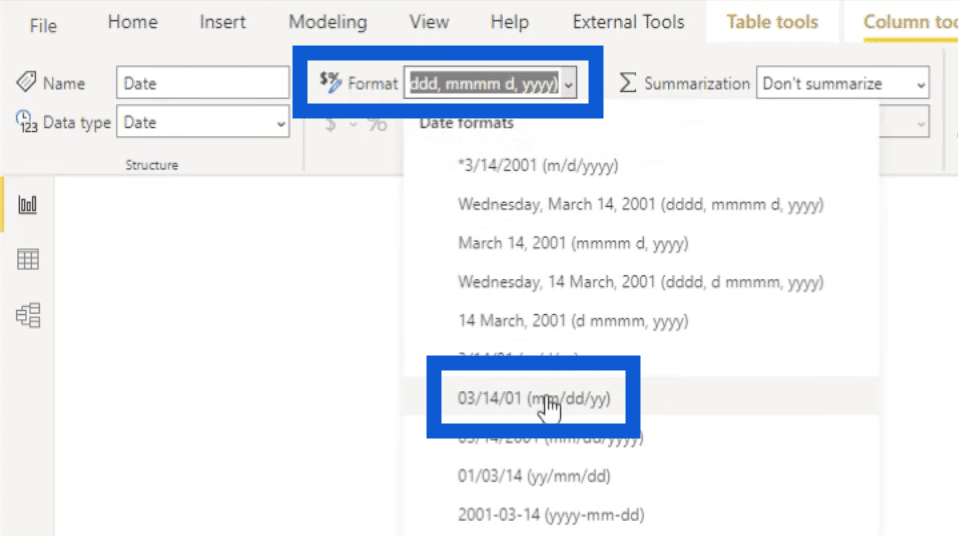
You can choose your own format, depending on the common practice in your location.
All the other columns contain mostly text, so those are good as is. Total Defects and Downtime Minutes are whole numbers, so I’ll also keep them in their current format.
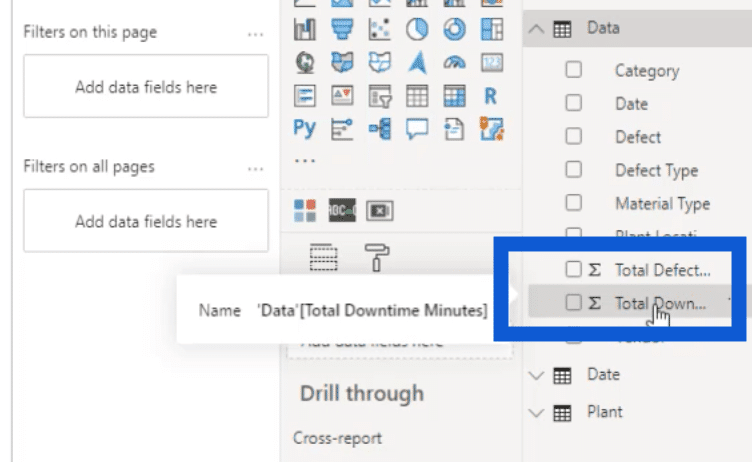
The Date table is part of my preset template, so it doesn’t really need any changes. This means that I can skip that and go to the Plant table next.
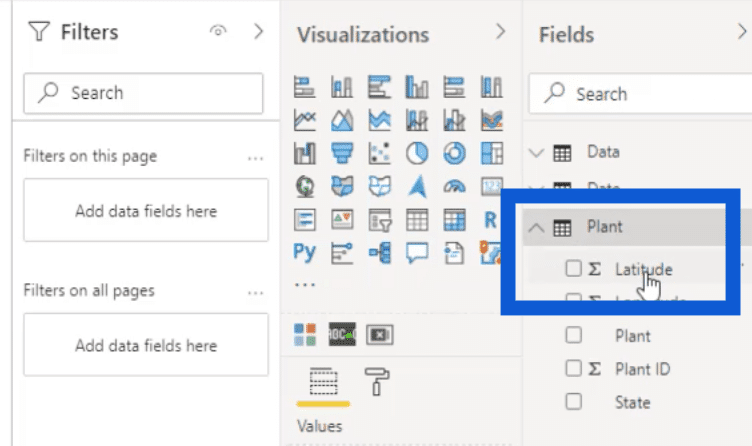
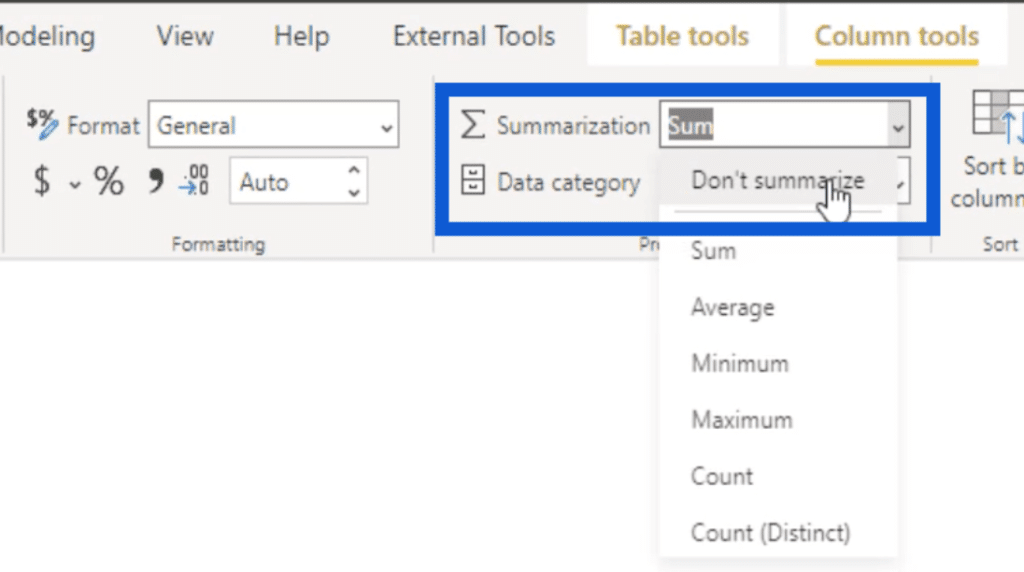
I’ll start with the Latitude column. Under Column Tools, I’ll go to Summarization and choose Don’t summarize.
Under data category, I’m going to select Latitude.
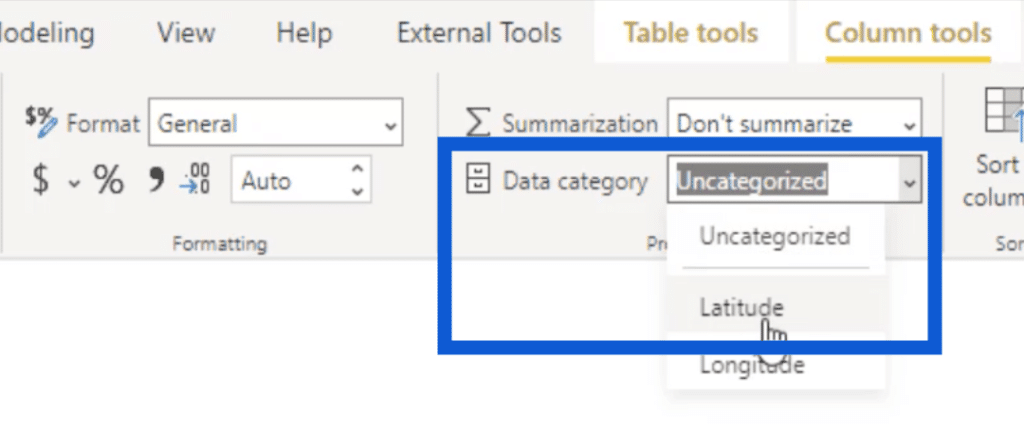
Once I do that, the emblem for the Latitude column changes.
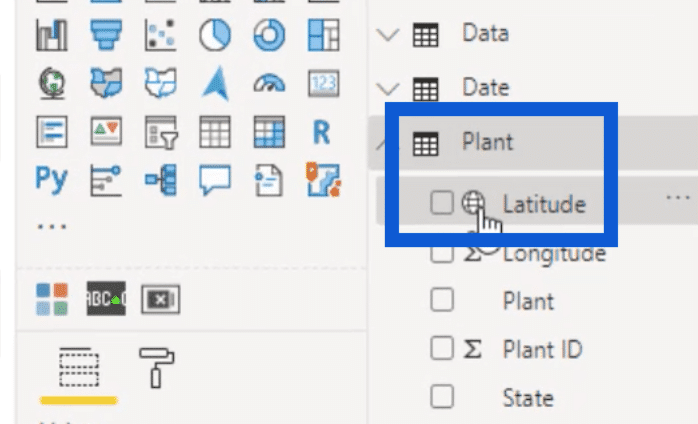
I’ll do the same thing for the Latitude column as well. Just choose Don’t summarize, then choose Longitude under Data category.
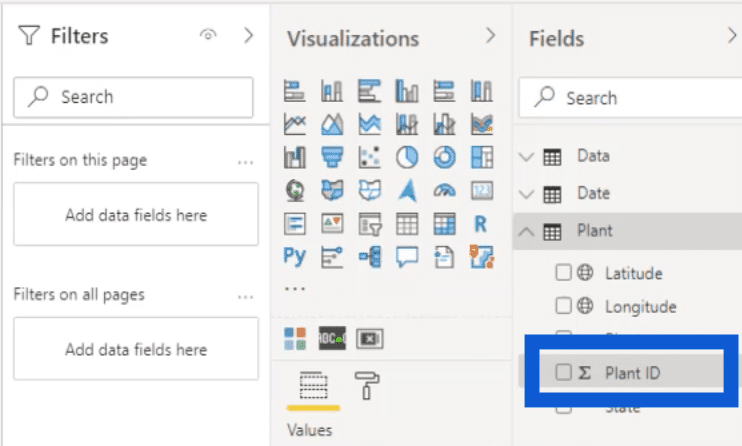
I’m going to keep the Plant ID as a whole number. I’ll also choose Don’t summarize for this.
Then, the last one that I’m going to change is the State. This is a text column.
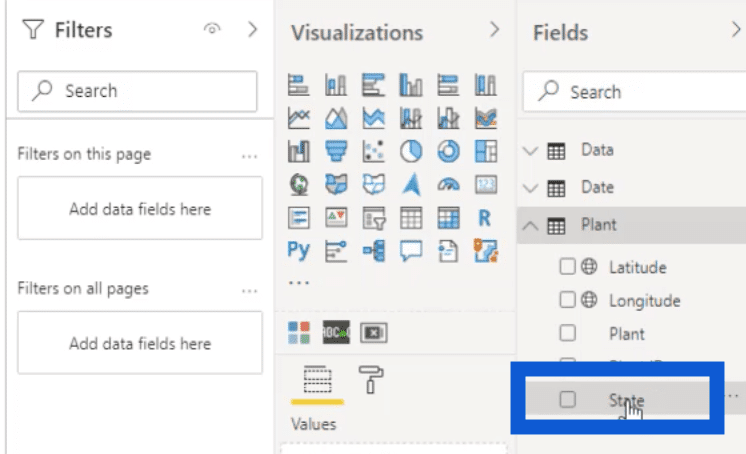
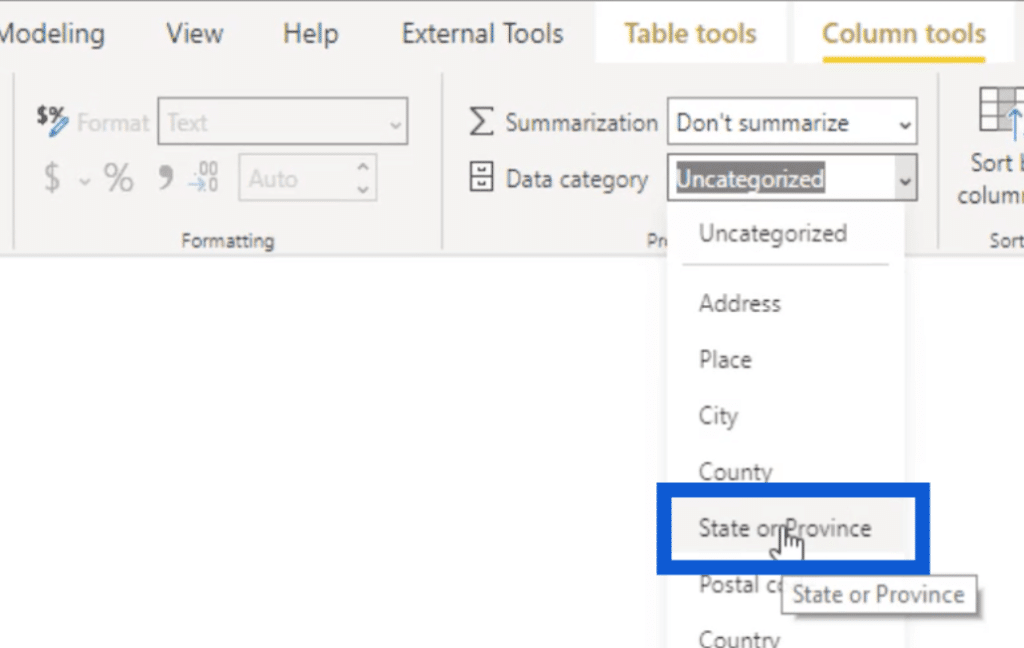
Aside from choosing Don’t summarize, I’m also going to change the data category into State or Province.
Now, I’ve gone through all the columns that contain my data. That was a simple example of Power BI data transformation. But despite how simple it all looked, it can have a huge impact once we start working with the data later on.
Creating The Model And Building Relationships
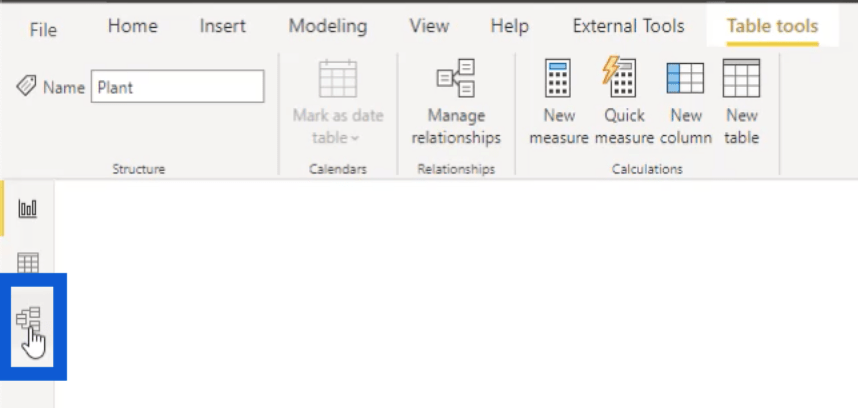
Let’s head over to the model view tab within Power BI desktop.
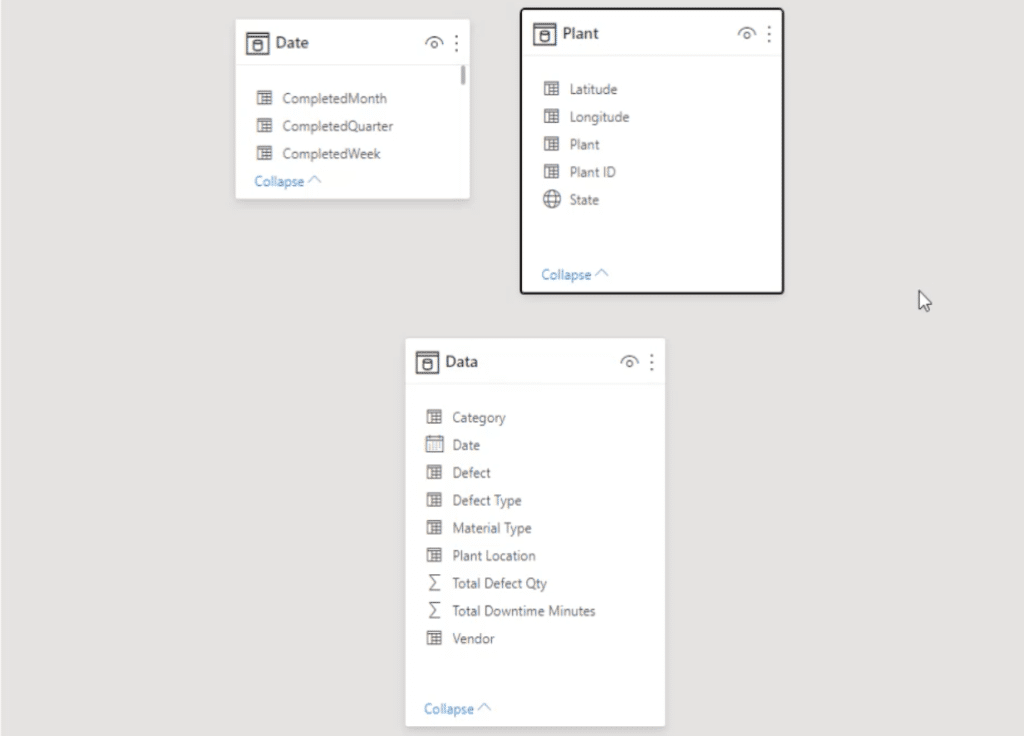
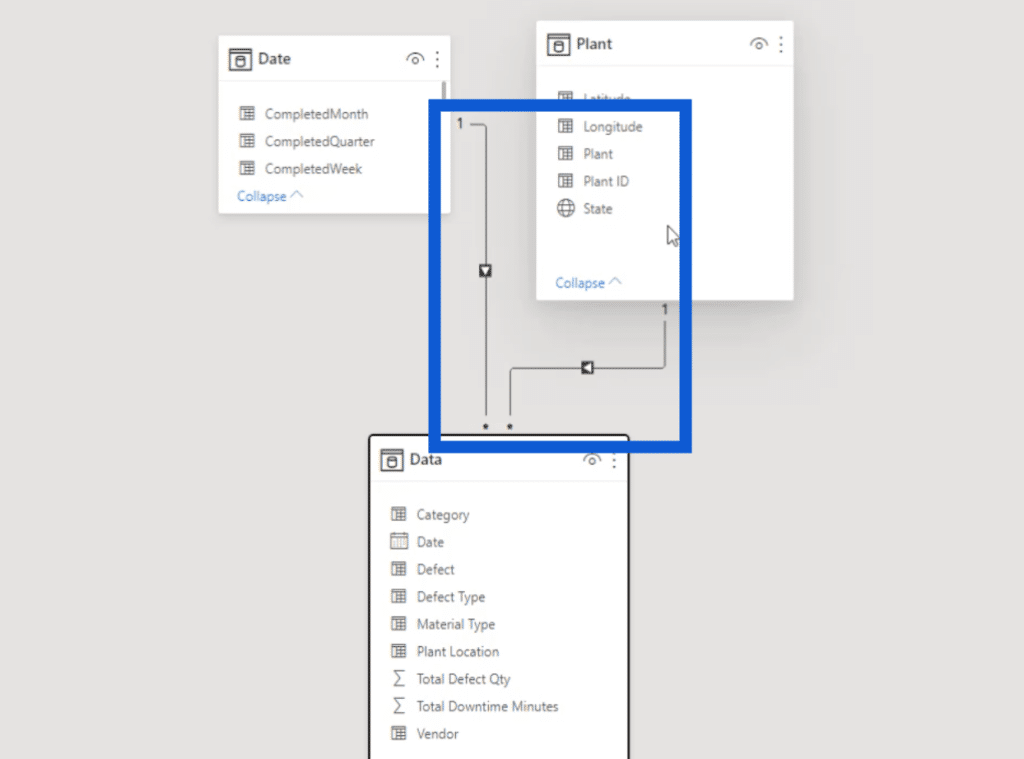
You’ll see the tables within our model here. To make it easier to see the relationships, I’ll put our fact table, which is Data, at the bottom. Then I’ll put Date and Plant at the top.
Next, I’ll set up the relationships. Under the Home ribbon, I’ll click on Manage relationships.

I’ll start by building a relationship between my Data and Date tables. I’ll choose the Date columns from both tables.
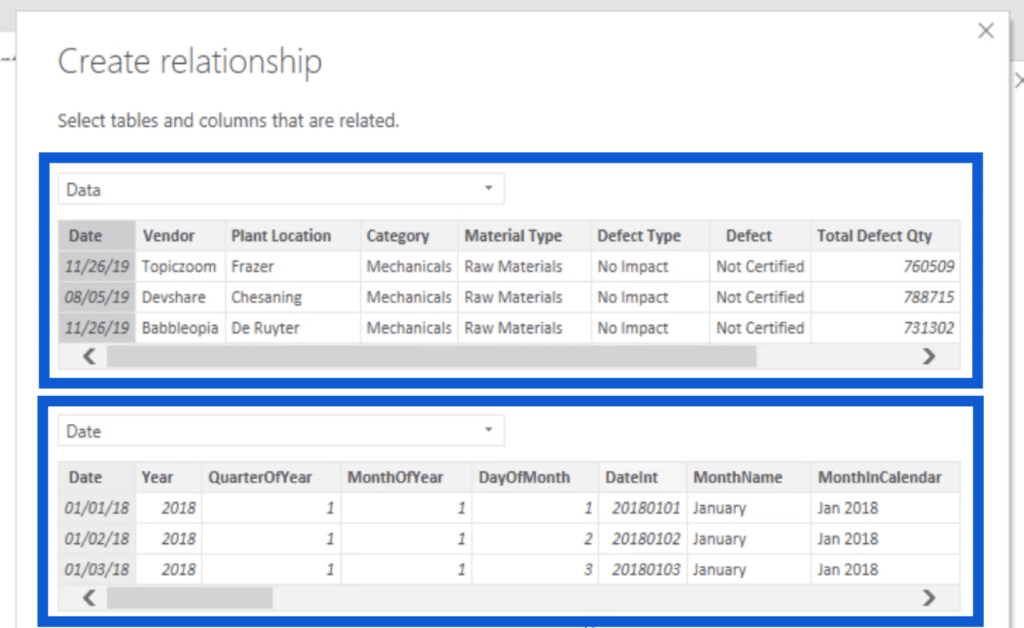
Under cardinality, I’ll choose Many to one. Under the Cross filter direction, I’ll choose Single.

Note that the cross filter is almost always set to Single. There aren’t a lot of reasons to do it any other way.
I’ll hit OK to save that relationship, then I’ll move onto the next one. This time, I’ll use the Plant Location column from the Data table, then match it up to the Plant column on the Plant table.
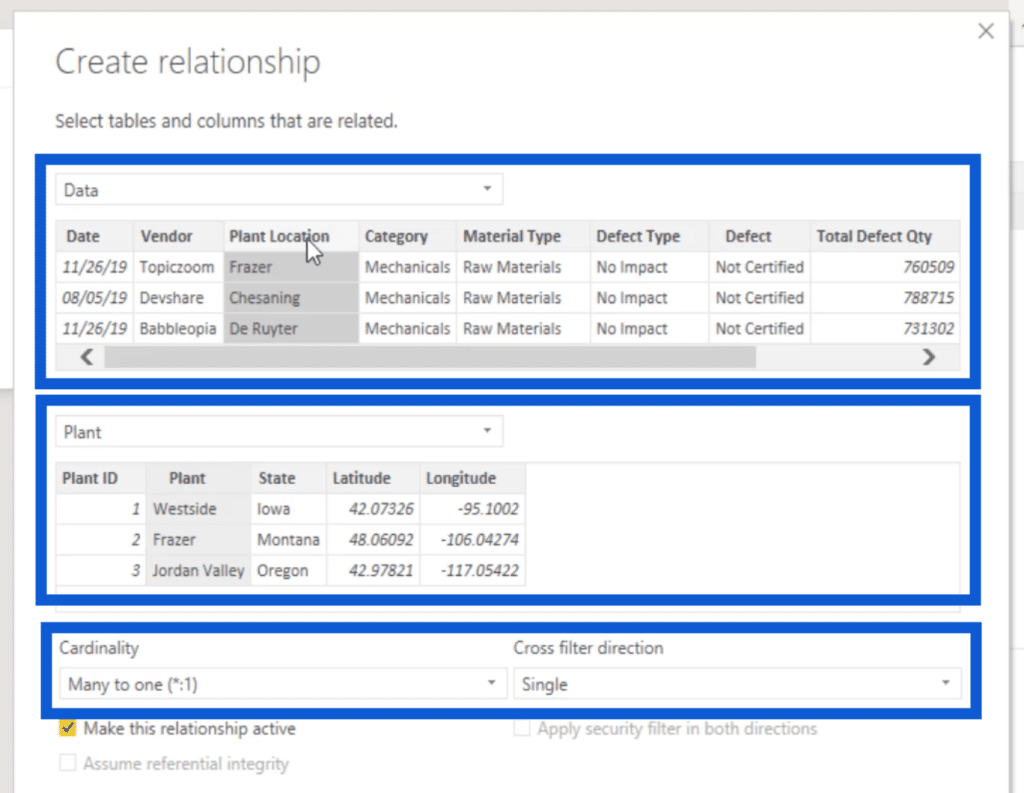
Again, it should be a Many to one relationship, with a single cross filter.
Those two are the only relationships that we need to set up in our model for now.

Once I close that window, you can see that we have our fact table down here at the bottom. Then, there’s a many-to-one relationship from the Date table going to the Data table. The same thing is true for the Plant table.
Setting Up The Key Measures Table
Now, I’m going to show you the original model that I used for the actual challenge. As you can see, it’s set up the same way, except that I have my Key Measures table as well.
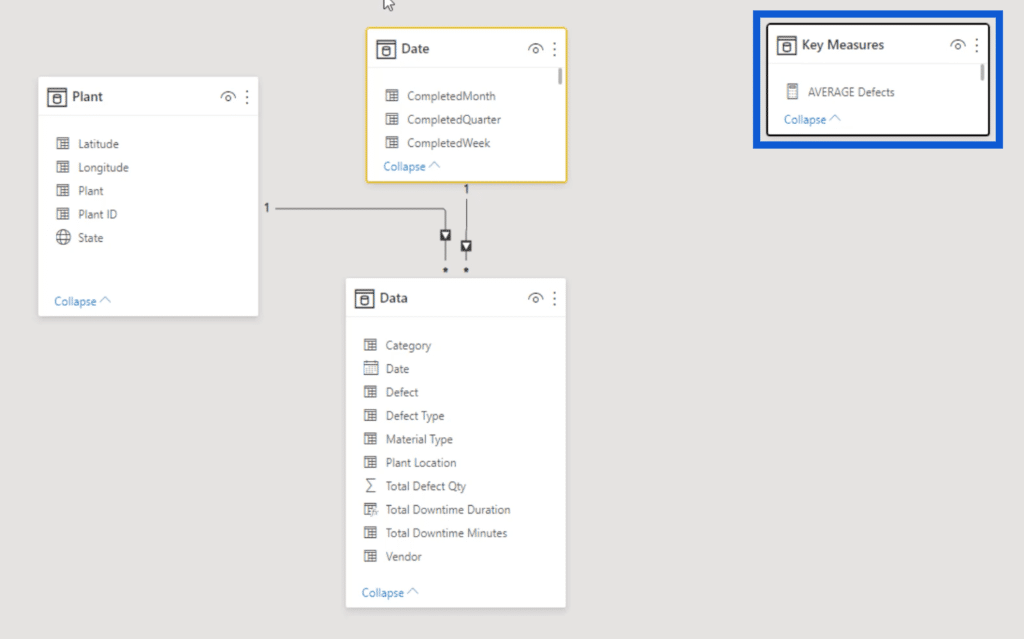
As you work on your reports, you’ll use a number of Key Measures so you’ll always need something like this. Let me show you how I create mine.
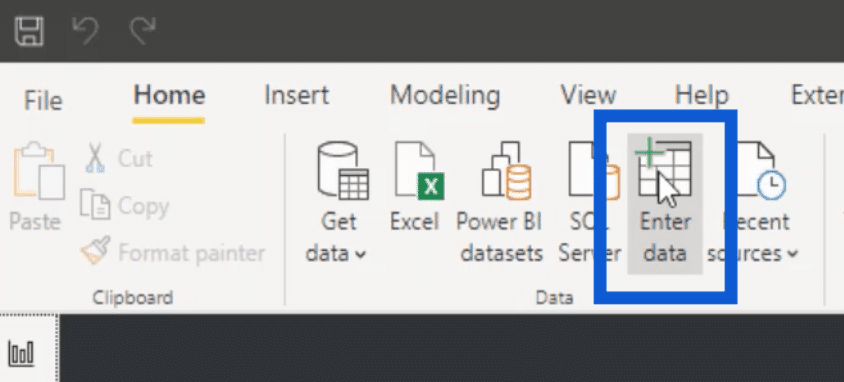
I start off by clicking on Enter data under the Home ribbon.
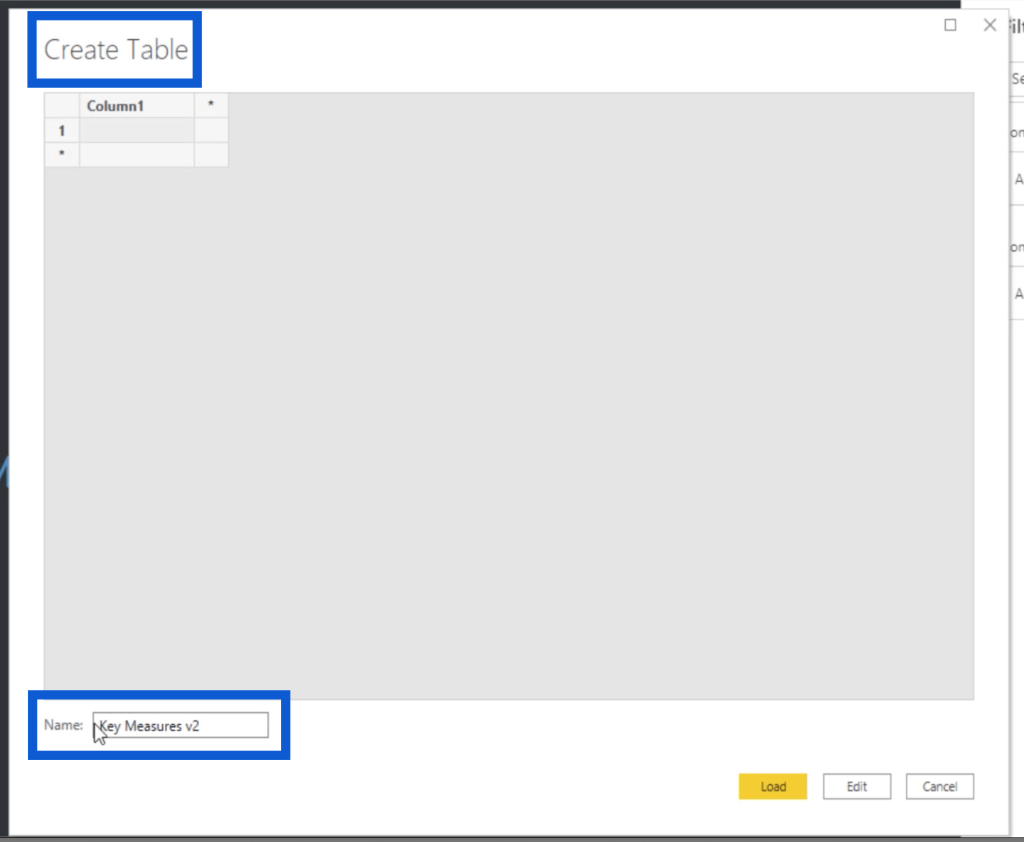
This will open up a window where I can create a table. Since I already have an existing Key Measures table, I’ll just call this one Key Measures v2.
Once I hit load, I can go back to my Fields pane and I’ll see that table right away. It automatically comes with a blank column.
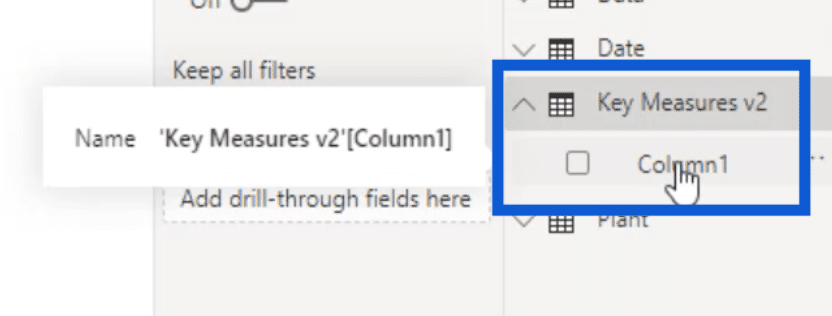
Now, I’ll highlight that column, then I’ll click on New measure under Table tools.

I’ll call this measure Testing123 and I’ll just use a generic measure here just to show you how to set this up.

I also have this measure set up as a whole number, and added a comma because I know that I’ll be working with large numbers in all of these tables.

Going back to the Fields pane, I can see the new measure I created. So I can go ahead and delete the default column.
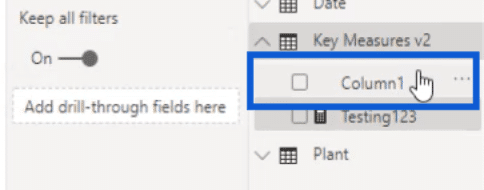
Once that’s deleted, I’ll just click on the right arrow here beside Fields, then click the left arrow that shows up.

This will refresh the right pane. Now, you’ll see my Key Measures v2 table at the top, right after my original Key Measures table.

As you go along your report development process, you’ll be adding more measures under this table. Here’s what my original Key Measures table looks like.
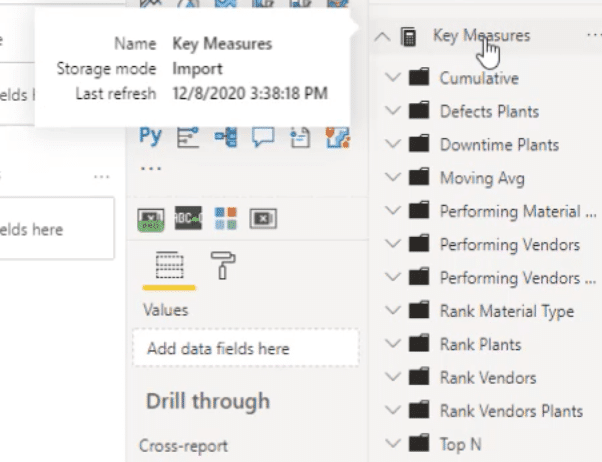
Having a Key Measures table like this will make it easier to work with measures as you build your report.
***** Related Links *****
Data Loading And Transformation Best Practices
Simple Power BI Transformations For More Optimized Data
Data Modelling In Power BI: Tips & Best Practices
Conclusion
This was a really simple Power BI data transformation process. Even with the way I set up the models and the relationships, I kept everything as easy as possible.
The biggest benefit is it will make the process more seamless, especially when you start adding visualizations and DAX measures later on.
Doing it this way also means that you’ve laid out a good foundation for your entire report. There are less chances of making mistakes later on, and if you do end up making a few, it’s going to be easy to clean them up and fix any issues.
All the best,
Jarrett


