Creating a data pipeline planner in the Analyst Hub streamlines the process of importing and analyzing data in Power BI. This planner can be used to track the flow of data from various sources, such as databases and Excel files, to the final Power BI report. It is also used to schedule and automate data refreshes, ensuring that the data in the report is always up-to-date.
In this tutorial, you’ll learn how to create a Power BI data pipeline planner in the Analyst Hub of Enterprise DNA.
Overview
The Analyst Hub is an Enterprise DNA feature that allows analysts to create and share interactive dashboards, reports, and visualizations with stakeholders. It enables users to create and publish reports to a central location where others in the organization can access and view them.
The Data Pipeline Planner enables you to list, document, and organize the different data sources you’re using in Power BI. This can be used as a reference point in making sure that all the data sets are accessible and optimized once they’re needed in a Power BI report.
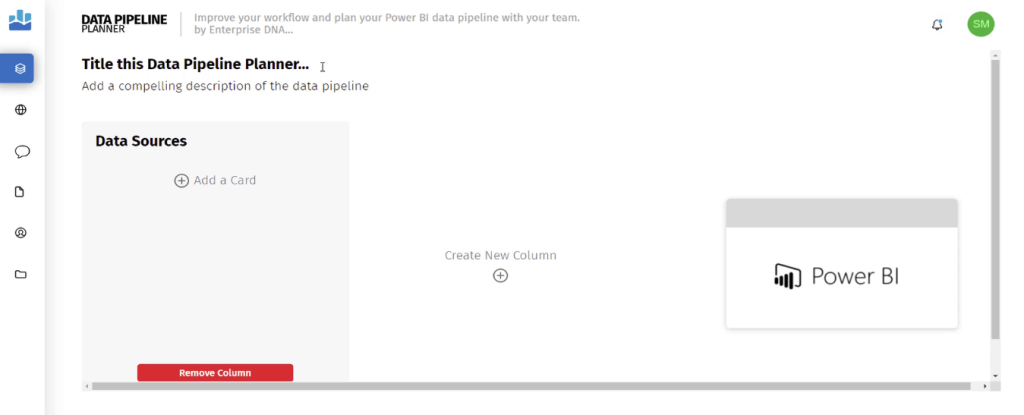
Instead of repeatedly asking your IT department for access on specific data sources, you can give them a Data Pipeline Planner so that they understand what and when certain data sets are needed.
Creating A Power BI Data Pipeline Planner
Click the Data Pipeline Planner option in the Analyst Hub.
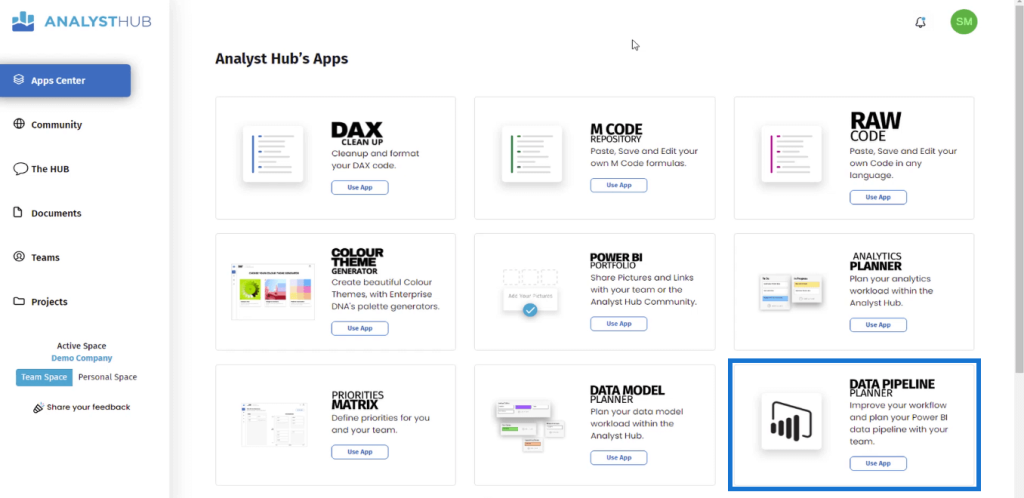
To start creating a data pipeline planner, you have to list and then map out the different data sources you need for specific reporting purposes.
Finance data, for example, would often need data sets on commodity prices, currency rates, and sales transactions, among many others.
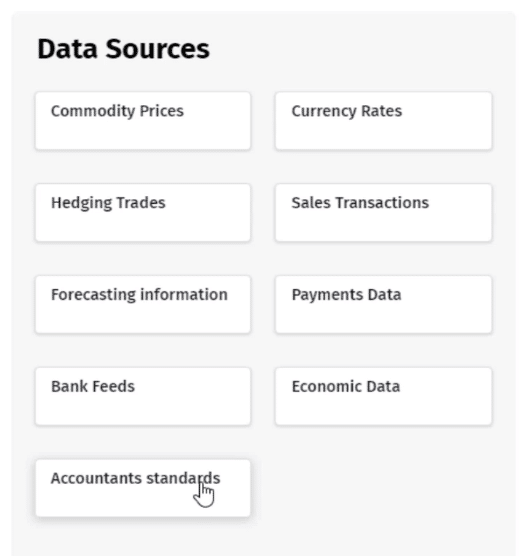
Note that when creating a data pipeline planner, you need to avoid idea or report dumping within a workspace. Be sure to optimize your feed by preventing duplications.
Next, create another column and then label them as Core Data Sets and Supporting Data Sets.
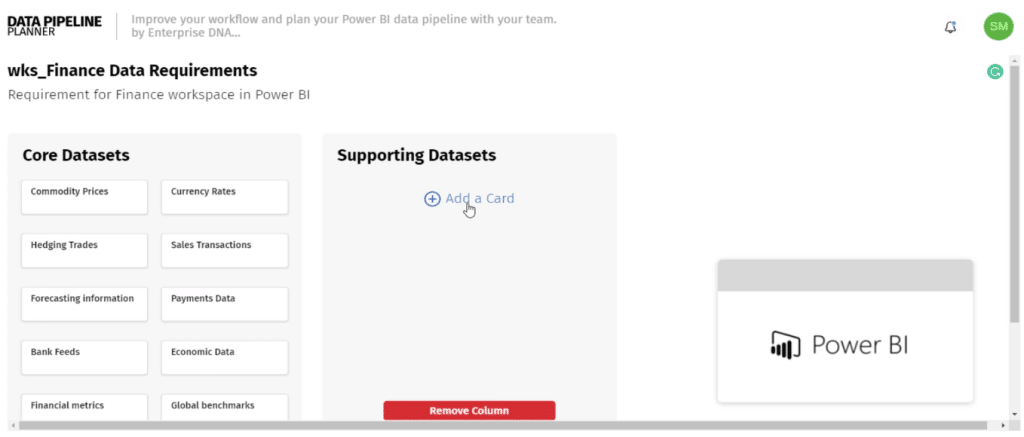
You can also add descriptions and comments to each card in your pipeline planner. This will help other users easily understand what each card is specifically referring to. And by changing the color, you can create a color-coding scheme per data source group.
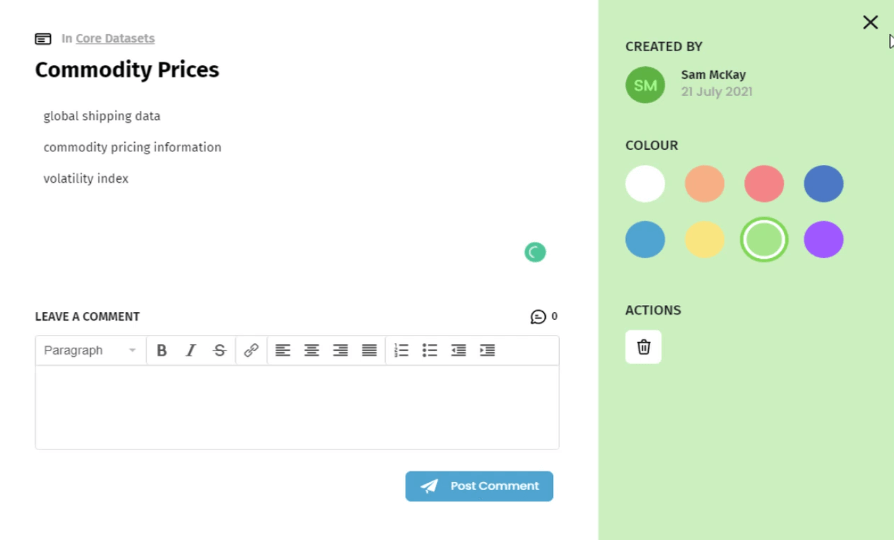
Improving The Planner Through Collaboration
The great thing about the Analyst Hub is that it allows different users to collaborate. By scrolling down, you can toggle the Team option to add the data pipeline planner to the team section. This will give each team member access to the document.
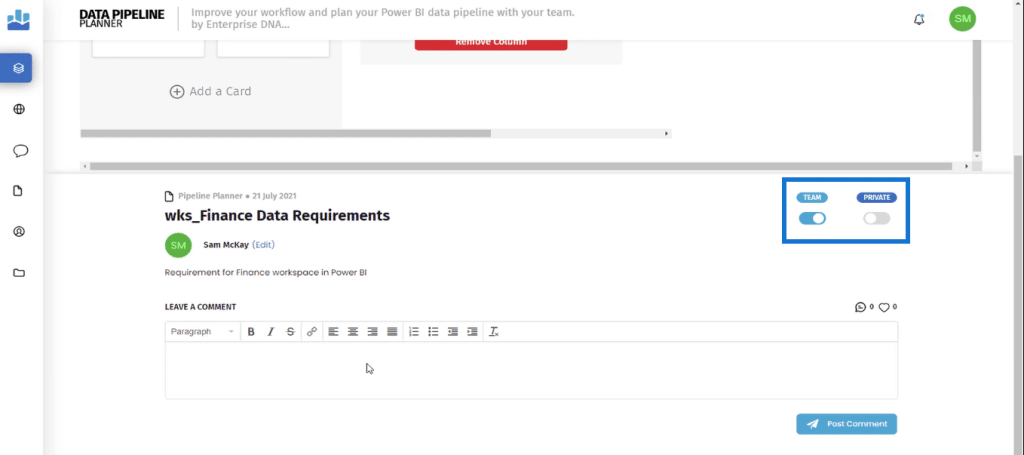
This ability to collaborate between different users results in a great documentation scheme during the planning stages of Power BI deployment. This provides assurance that everyone is focused and aligned on the same path.
Organizing Power BI Pipeline Planners In The Analyst Hub
When you continue to create data pipeline planners across multiple workspaces, you’ll be faced with a wide assortment of documents in your Analyst Hub app.
It’s recommended to organize these documents by placing them in Projects.
To add a document to a project, go to the Documents tab and hover over the document. Click the folder icon to select the Add to project option.
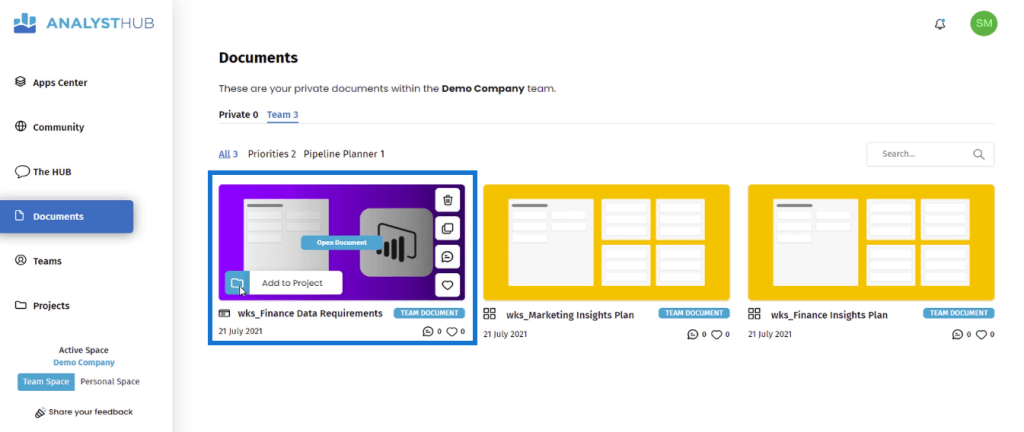
Then, select the Project you want the document to be in.

Organizing your documents in the Analyst Hub helps improve efficiency and collaboration between teams.
***** Related Links *****
Elevate Your Color Palette Via The Analyst Hub Community
Power BI Development Tips To Boost Productivity
Power BI Planning Using The Priorities Matrix In The Analyst Hub
Conclusion
Planning and organizing data sources in Power BI is an important step in creating a clear data model and organizing the data sources in a logical manner. This also improves work efficiency when creating Power BI reports and dashboards.
The Enterprise DNA Analyst Hub has a variety of tools that can help during the planning and development stages of Power BI implementation. By utilizing the various features of the Analyst Hub, organizations can improve the efficiency and transparency of their data sources management processes.
All the best,
Sam McKay


