In this tutorial, you’ll learn how to use the VertiPaq Analyzer in DAX Studio to optimize your data model in Power BI.
VertiPaq Analyzer is a built-in tool in DAX Studio that extracts meaningful information about tabular models from an optimization standpoint.
To launch VertiPaq Analyzer, go to the Advanced tab in DAX Studio. Then, click the View Metrics option.

This will open a new pane at the bottom. The VertiPaq Analyzer Metrics pane contains a list of all the Tables in your tabular model.

Each column provides meaningful information regarding your data model, such as:
- Cardinality – shows the number of rows in a table.
- Table Size – shows the size of the table in kilobytes (KB).
- Column Size – shows the size of a column in kilobytes (KB).
- Hierarchy Size – is used mainly for MDX purposes.
- Encoding – pertains to the value encoding and dictionary encoding.
- Data Type – the data type of a column, such as text, number, or date.
- Rel Size – shows the memory consumed due to the relationship between two tables.
- % DB – shows the amount of RAM consumed by a table with respect to the entire data model.
VertiPaq Analyzer Metrics Of A Data Model In Power BI
You can use these different metrics when analyzing the tables in your data model. In this example, you’ll notice that the Sales table consumes the largest amount of %DB.
Scroll to the left-most column of the table in the VertiPaq Analyzer. When you click on a table, you’ll be able to to drill down into the information of its columns.
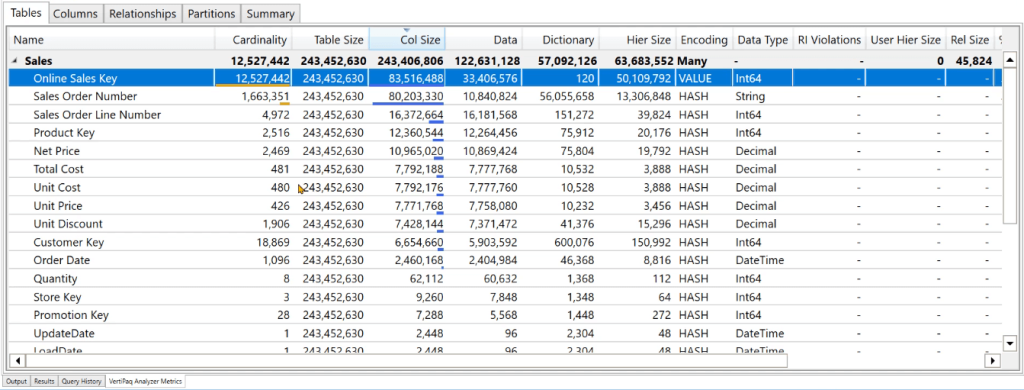
This allows you to identify columns that are necessary for analytical purposes. You can also opt to remove unnecessary columns from your data model. This saves RAM and optimizes the calculations you’re performing.
For example, the Online Sales Key column consumes a total of 83 MB of RAM. If this column isn’t useful for your reporting purposes, you can remove it to free up storage space.
In the Encoding section, you can see that Value Encoding is applied to the Online Sales Key column. There’s no use in applying a Dictionary Encoding because this column only contains unique values. The stored index will still be equal to its value.
This won’t be useful when compressing the column, so Analysis Services skips the Dictionary Encoding. That’s why the Dictionary section only consumes 120 KB.
Dictionary Encoding, Storage Percentages, And User Hierarchy Size
In hindsight, if you look at the Sales Order Number column, you can see its Dictionary section is consuming more storage space than the Data section.
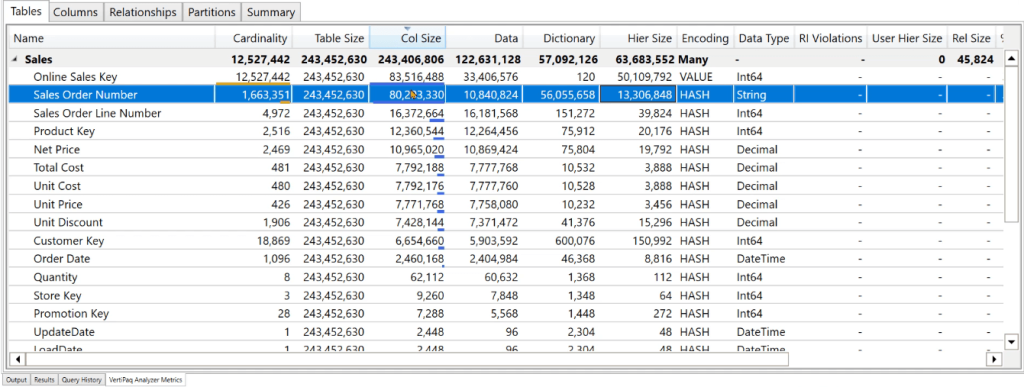
The Data section stores the index or pointer value for each row in the column. Since the Sales Order Number column is storing the bulk of its data in the form of indices, all the pressure is consumed by the Dictionary.
The Column Size shows the summation of the Data, Dictionary, and Hierarchy sections. In the Data Type section, the Sales Order Number column is stored as a string thus, the Dictionary Encoding is used.
Next, if you scroll to the right-most part of VertiPaq Analyzer, you can see data on the percentages.
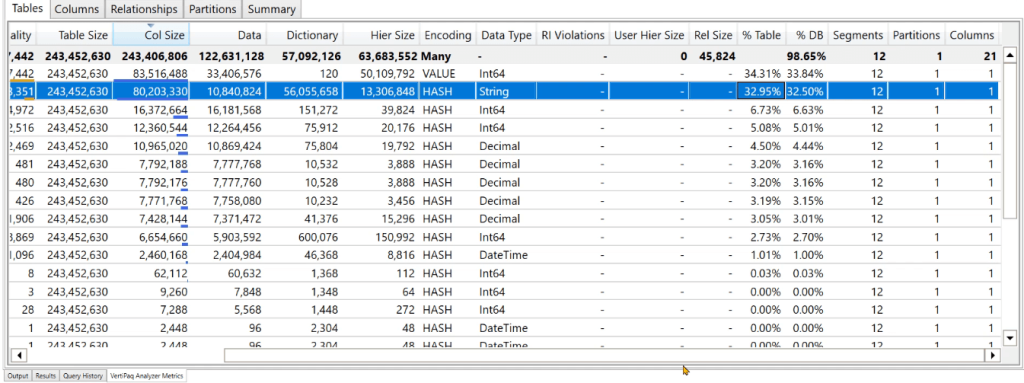
The % Table shows the amount of space consumed by the column with respect to the table. Whereas the % DB shows the amount of space consumed by the column with respect to the entire database.
Moving on to the Products table, you can see that it’s the only one with a value for the User Hierarchy Size.
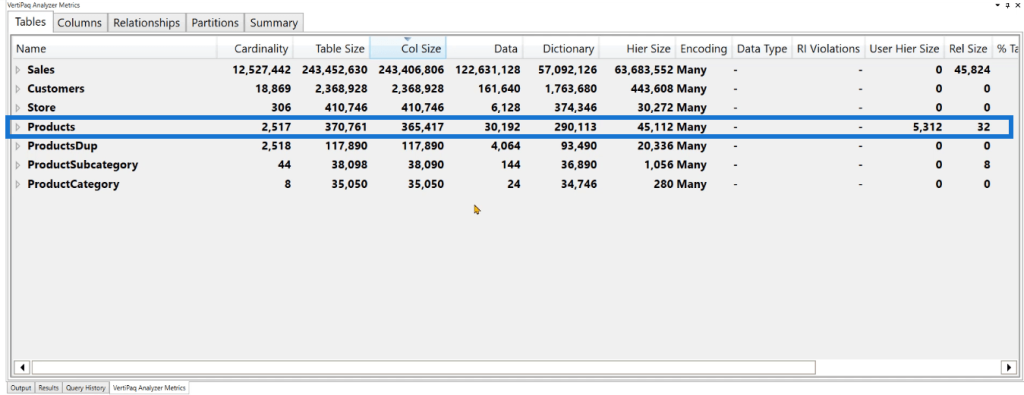
The User Hierarchy Size shows the amount of space consumed by the hierarchies created in DAX Studio.
RI Violations Of A Data Model In Power BI
The Column Tab of VertiPaq Analyzer allows you to view your data in a Table-Column format.
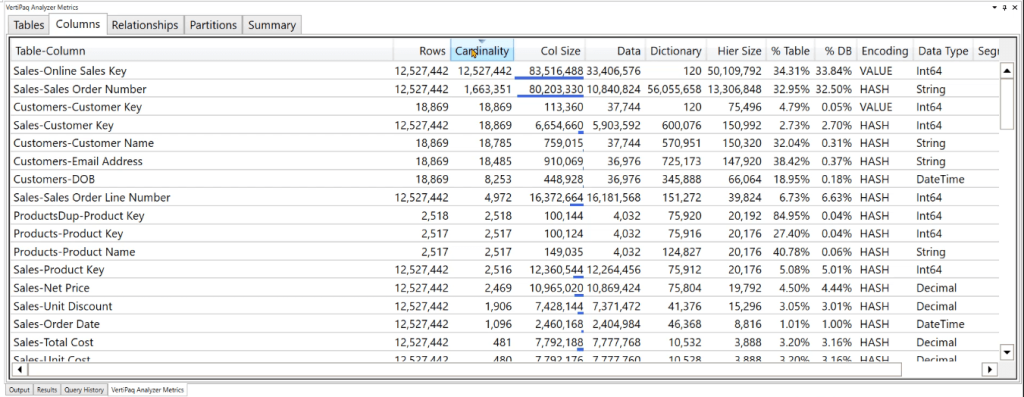
It enables you to sort by columns, making it easier to identify which column in the entire dataset consumes the highest RAM.
The Relationships Tab allows you to view the root cause of RI Violations.
If your DAX code contains a RI Violation, VertiPaq Analyzer will place a number 1 with a red font under the RI Violations section. However, if you expand the table with the violation, you won’t be able to see what’s causing it.
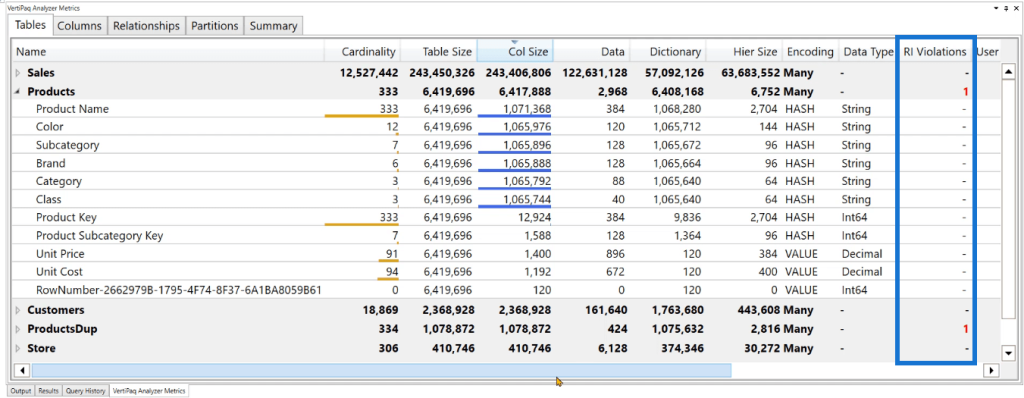
This information can instead be found in the Relationships tab.

In this example, the Sales table shows that there are 2,183 missing keys between the Sales Table Product Key and the Product Table Product Key. This results in 10 million invalid rows in the Sales table and 153 sample violations.
The Relationships page in VertiPaq Analyzer allows you to identify missing keys between your Facts table and Dimension table.
You can also double-check this information using DAX.
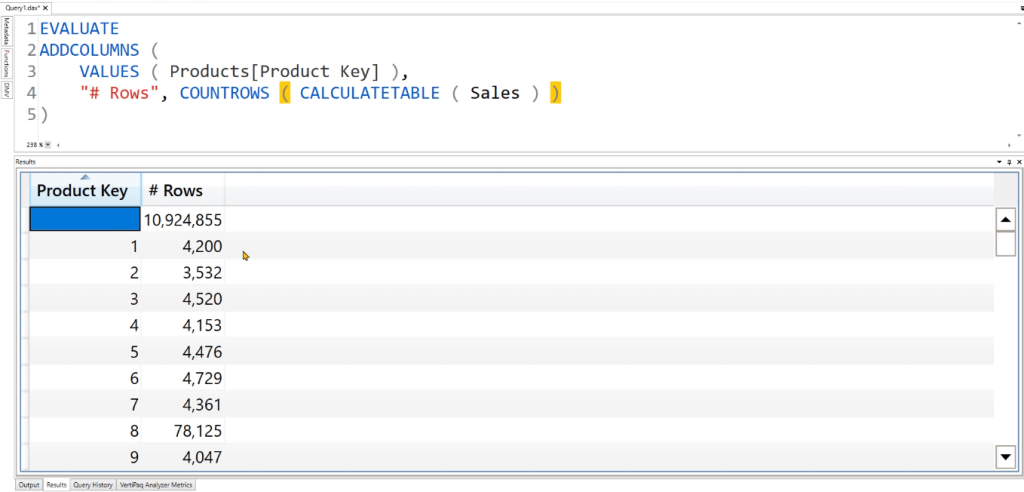
When you run the code, the results indeed show that 10 million rows have blank Product Key values.
Summary Tab In VertiPaq Analyzer
The Summary tab shows the basic overall information of your data model.
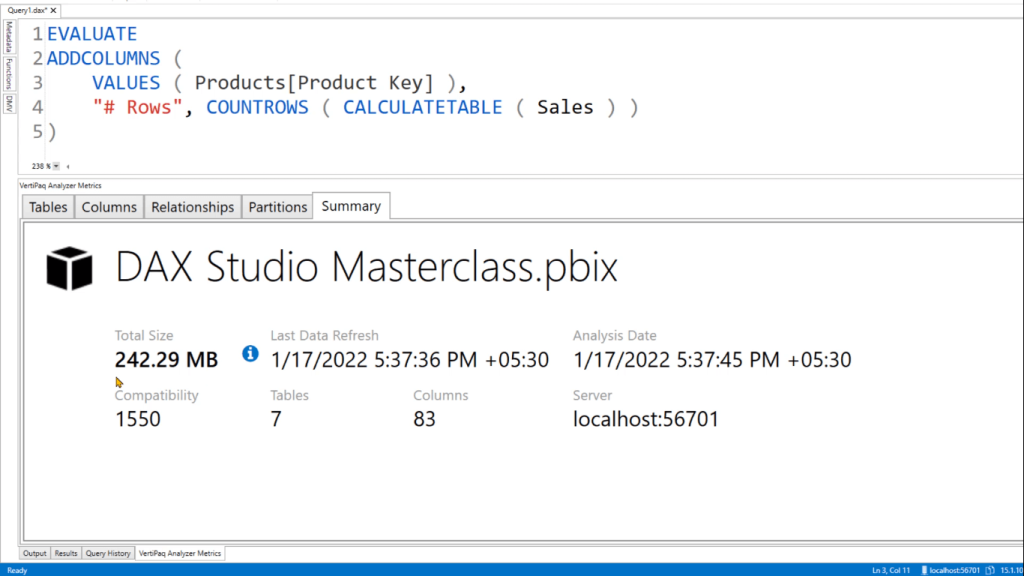
The Total Size shows the total amount of RAM the data model is consuming. The Analysis Date pertains to the last time you clicked on the View Metrics option in DAX Studio.
Compatibility refers to the Analysis Services version used in the current file. And lastly, the Server shows the localhost port number used by the Analysis Services to connect to DAX Studio.
***** Related Links *****
Data Indexing In Vertipaq: Row Store Versus Column Store
xmSQL Aggregations In VertiPaq DAX Studio
Storage Engine In Power BI – VertiPaq Operators & Queries
Conclusion
VertiPaq analyzer is a performance and analysis tool that is included in Microsoft Power BI. It allows you to analyze the data model of a Power BI report or dataset to understand how the data is structured and how it’s being used.
The VertiPaq analyzer provides several metrics that can help you understand the performance and efficiency of your data model. By analyzing these metrics, you can identify potential issues with your data model, such as large tables, low data density, or inefficient data types, and take steps to optimize the model for better performance.
All the best,
Enterprise DNA Experts


