
In this tutorial, you’ll learn about the different Power BI compression techniques in DAX Studio that help optimize your report.
After data is loaded segment by segment by the Analysis Services in Power BI Power Pivot and SSAS, two events occur. The first one is that they try to use different encoding methods to compress columns to reduce the overall RAM size. The second one is that they try to fund out the best sort order that places repeating values together. This method also increases compression and in turn, reduces the pressure on the memory.
There are different compression techniques used by Analysis Services. This tutorial covers three methods, in particular, namely, Value Encoding, Run Length Encoding, and Dictionary Encoding. In the last section of this tutorial, it’ll cover how to sort order works in Analysis Services.

Power BI Compression Technique #1: Value Encoding
The first one is called Value Encoding.
Value Encoding seeks out a mathematical relationship between each value in a column to reduce memory. Here’s an example in Microsoft Excel:
This column requires 16,384 bits in order to store the values.
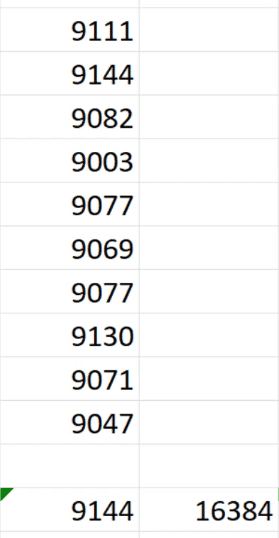
To compute the bits required, first use the MAX() function in Excel to get the highest value in the columns. In this case, it’s 9144. Then, use the POWER() function to calculate the bits required. Use the argument POWER(2, X) where X is any positive value that will return an answer that’s greater than the MAX value. X, in this case, also represents the bits required. So for this example, the value of X is 14 which results in 16,384. Therefore, the column requires 14 bits of storage.
To reduce the required bits using Value Encoding, VertiPaq seeks out the MIN value in the column and subtracts it from each value. In this case, the MIN value in the column is 9003. If you subtract this from the column, it’ll return these values:
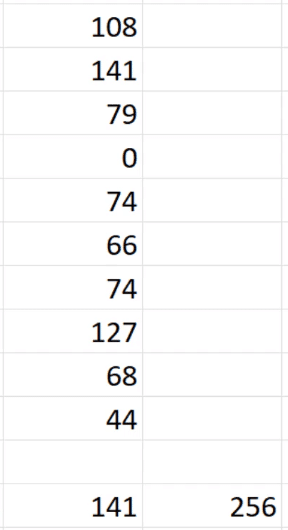
Using the same functions and arguments, you can see that for the new column, the MAX value is 141. And using 8 as the value of X results in 256. Therefore, the new column only requires 8 bits.

You can see how compressed the second is compared to the first column.
Once the data is compressed and you try to query the new column, the Storage Engine or Vertipaq scans this column. They won’t simply return the new values of the column. Instead, they add the subtracted value before returning the result back to the user.
However, Value Encoding only works on columns containing integers or values with fixed decimal numbers.
Power BI Compression Technique #2: Run Length Encoding
The second encoding method is called Run Length Encoding.
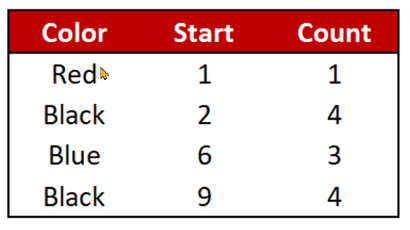
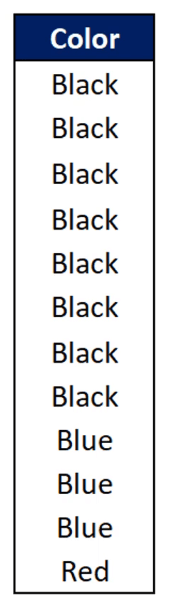
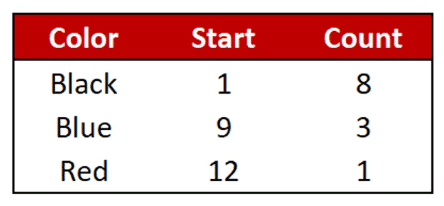
Run Length Encoding creates a data structure that contains the distinct value, a Start column, and a Count column.
Let’s have an example:
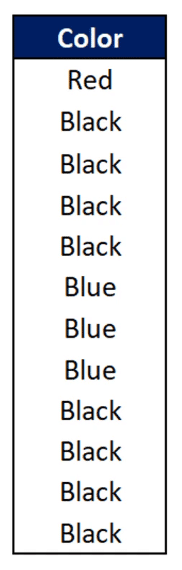
In this case, it identifies that one Red value is available in the first row. It then finds out that the Black value starts at the second row and is available for the next four cells. It proceeds to the third value, Blue, which starts at the sixth row and is available for the next three rows. And this goes on until it reaches the last value in the column.
So instead of storing the entire column, it creates a data structure that only contains information about where a particular value starts and where it ends, and how many duplicates it has.
For columns with the same structure, data can be further compressed by arranging the values in either ascending or descending order.
With this properly sorted column, you can see that the Run Length Encoding method now returns a data structure with one row less.
So if you’re dealing with many distinct values, it’s recommended to sort the column in the most optimal way possible. This will give you a data structure with lesser rows which in turn occupies lesser RAM.
Run Length Encoding can’t be applied to primary keys because primary key columns only contain unique values. So instead of storing one row for each value, it’ll store the column as it is.
Power BI Compression Technique #3: Dictionary Encoding
The third encoding method is called Dictionary Encoding.
Dictionary Encoding creates a dictionary-like structure that contains the distinct value of a column. It also assigns an index to that unique value.
Using the previous example, let’s look at how Dictionary Encoding works. In this case, the values Red, Black, and Blue are assigned an index of 0, 1, and 2, respectively.

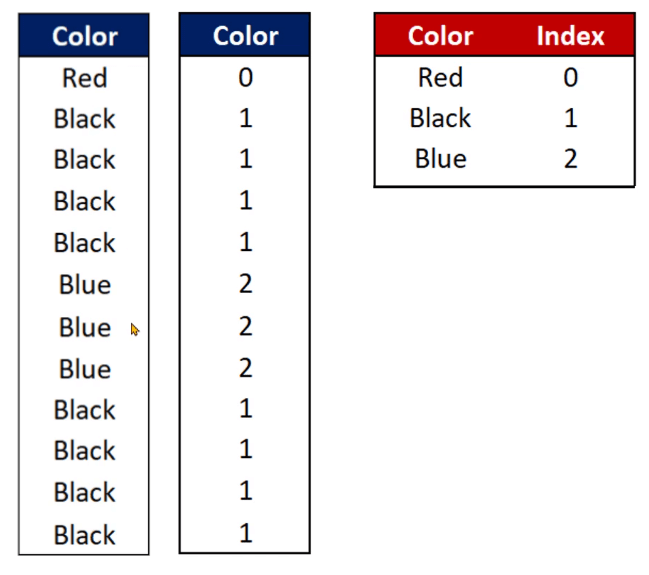
It then creates a data structure similar to that of Run Length Encoding. However, instead of storing the actual values, Dictionary Encoding stores the assigned index of each value.
This further reduces the RAM consumed because numbers take up lesser space than string values.
Dictionary Encoding also makes the tabular data type independent. That is, regardless if you have a column that can be stored in different data types, it won’t matter since the data structure will only store the index value.
However, even if it’s independent, the data type will still have an effect on the size of the dictionary. Depending on the data type you choose to save the column in, the dictionary (or data structure) size will fluctuate. But the size of the column itself will remain the same.
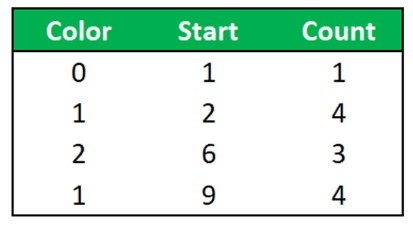
So depending on what data type you’ll choose, once Dictionary Encoding is applied on the column, Run Length Encoding can be applied afterward.
In this case, Analysis Services will create two data structures. It’ll first create a dictionary and then apply Run Length Encoding on it to further increase the compression of the column.
Sort Order In Analysis Services
For the last part of this tutorial, let’s discuss how Analysis Services decides on the most optimal manner to sort data.
As an example, let’s look at a column containing Red, Blue, Black, Green, and Pink values. The numbers 1 to 5 have also been assigned to them. This acts as the dictionary of our column.
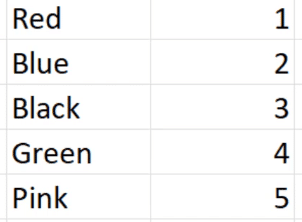
Now, fill an entire column in Excel with these values. Use this argument to generate a column containing these values at random.

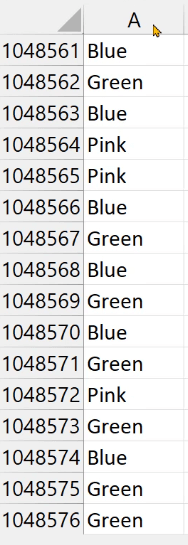
Drag the formula up to the last row. Click OK if the Large Operation pop-up window appears. This is now what it’ll look like:
Next, copy the entire column and paste it as a Value.
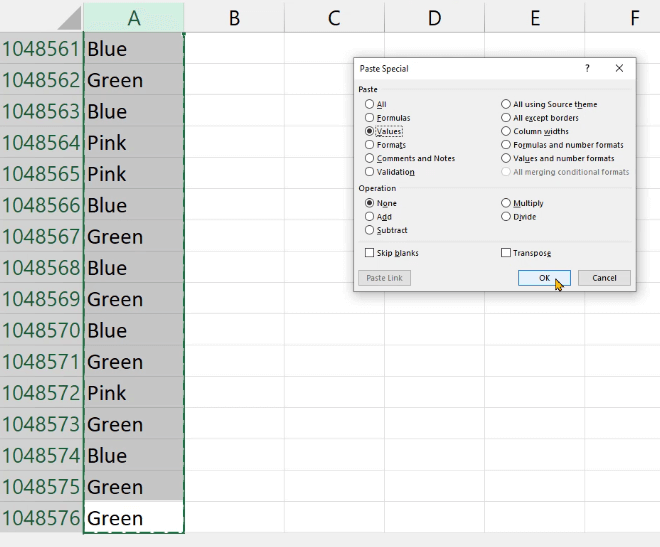
Now if you go to the File option in your Excel document and click Info, you can see that the column consumes 14.1MB.
To reduce the amount of RAM consumed, you can sort the column from A to Z. If you check the size again, you can see that it’s been reduced to 12.5 MB.
The 1.9 MB reduction may not seem much. This is because the example used a single column in Excel to demonstrate. Excel is only limited to 1 million rows. However, in Power BI, your data can contain billions of rows and columns. The reduction in space used grow exponentially.
***** Related Links *****
VertiPaq Analyzer In DAX Studio | Power BI Tutorial
Format DAX Codes Using DAX Studio’s Special Features
VertiPaq Engine In Power BI – Usage & Best Practices
Conclusion
Once your data is sorted in the most optimal manner, Analysis Services applies either of the three compression techniques depending on the data type.
Doing so increases the compression of your data which greatly reduces the amount of memory consumed in your device. This makes your report more optimal making it easier to run and load.
Enterprise DNA Experts


