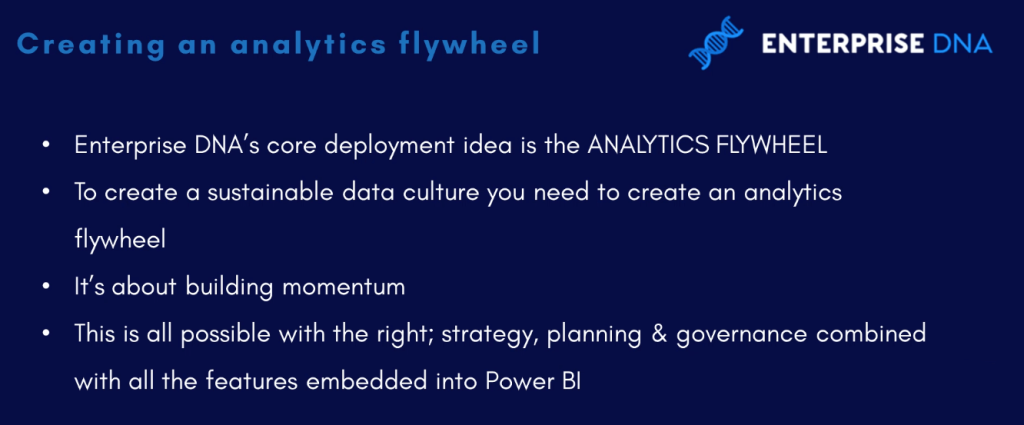
In Power BI, a flywheel is a self-reinforcing loop made up of a few key initiatives. These initiatives feed, and in turn, are driven by each other to build a long-term business. In terms of Power BI deployment, an analytics flywheel is crucial in building data culture.
In this tutorial, we’ll go over how to create a Power BI Analytics Flywheel to build continuous momentum in a business.
The key to getting things going is to create action. Once you start using Power BI in your organization, it only takes a little bit of effort and inertia until you can build momentum. And this momentum, in turn, will bring a huge amount of scale to your data culture.

Important Power BI Business Factors Of An Analytics Flywheel
1. Distribution & Accessibility Of Power BI In A Business
Through Power BI, you can access reports even when you’re out of the office. You can also use any device (such as computers, tablets, phones etc) to log in to your account and update reports in real-time.
Easy distribution and access help build momentum.
Similarly, you can use Power BI to present real-time data during meetings and virtual discussions. This transforms Power BI into a discussion generator and a tool in decision-making.
2. Connectivity Using Microsoft Teams
Another way to build upon the analytics flywheel is by connecting Power BI to the Office 365 suite. Doing so allows you to build a data culture using Power BI and Microsoft Teams.
Teams from different departments in the organization can collaborate with each other resulting in more insightful reports. They become encouraged to immerse themselves in data and make data-driven decisions.
3. The Initial Push
The hardest part of getting the analytics flywheel turning is the initial push. This is why creating action is important.
It’s about starting small and gradually building bigger momentum. Momentum is the driving force that keeps the project moving forward and helps to overcome any obstacles that may arise. Once the optimum momentum is achieved, the analytics flywheel will continue to grow on its own and spread throughout the organization.
4. Feedback Loop Between Teams
The last factor of an analytics flywheel is a feedback loop.
A feedback loop refers to the process of collecting, analyzing, and using feedback to improve the performance and effectiveness of the tool. It includes feedback from users and other stakeholders on the performance of the tool and its ability to meet their needs.
It starts with the collection of feedback through surveys, interviews, and other methods to gather information on the user’s experience. Then, the feedback is analyzed by identifying patterns and trends. Finally, changes and improvements are made.
A feedback loop is a continuous process.
It should be done regularly to ensure that Power BI is always improving and meeting the needs of its users.
***** Related Links *****
Power Apps Business Process Flow And Documentation
Building Data Culture In An Organization With Power BI
Power BI App: Changing The Paradigm In Data Management & Transformation
Conclusion
An analytics flywheel in Power BI allows organizations to continuously improve their performance by using data and insights to drive business decisions. It enables organizations to identify areas where they can improve and take action. It also helps identify new opportunities and areas for growth that they might not have otherwise been aware of.
Moreover, an analytics flywheel is essential to support a radical change in an organization’s data culture. When organizations have both a strong analytics flywheel and a data culture in place, they can make accurate and effective decisions, identify new areas for growth, and adapt to changes in the market.
All the best,
Sam McKay


