MultiIndex in Pandas is a multi-level or hierarchical object that allows you to select more than one row and column in your index. It also enables you to create sophisticated data analysis and manipulation, especially for working with higher dimensional data. In this tutorial, I’m going to explore the MultiIndex feature of Pandas. You can watch the full video of this tutorial at the bottom of this blog.
The idea here is that we have an index that also contains a hierarchy. If you’ve used Pandas before, you know that Pandas’ data frames contain an index, so we are going to add additional layers to that. That’s going to make both indexing and reshaping the data easier, depending on if you indeed have a hierarchy for your data.
For one example, we’re going to use the famous Gapminder data set, and this is indeed a MultiIndex here. We have a hierarchy, so a continent drill into countries, and every country can drill into multiple years. So, we can manipulate this index and things are going to be a lot easier to code when we’re using this MultiIndex. We’re going to look at slicing and also reshaping the Gapminder data set.
How To Use The MultiIndex In Pandas
We’re going to use the Gapminder data set. If you don’t have this installed, you want to do a PIP install Gapminder. I’m going to bring in Pandas as well. I’m using the Anaconda distribution of Python. In that case, that Pandas is going to be installed already. We do an import Gapminder, and then we will take a look at this data.
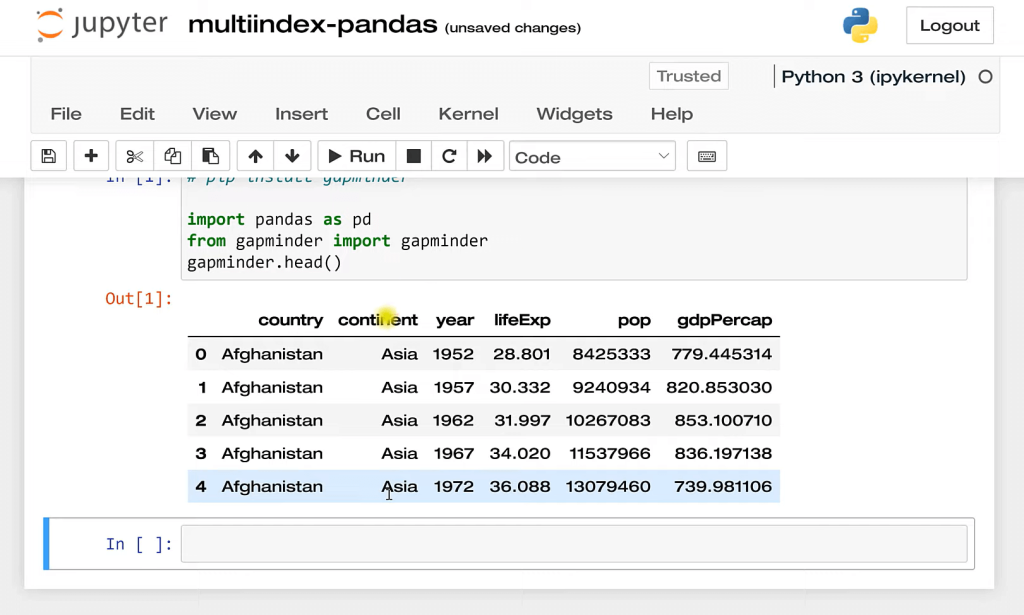
As you can see here, again we have an index or hierarchy. I should say we have a continent, a country, and then a year. Currently, the index is just numeric like this, and we’re going to set our own index right now. And the way we’re going to do that is with Gapminder. We’re going to set the index. We’re going to set it on continent, country, and then year, inplace equals (=) true.
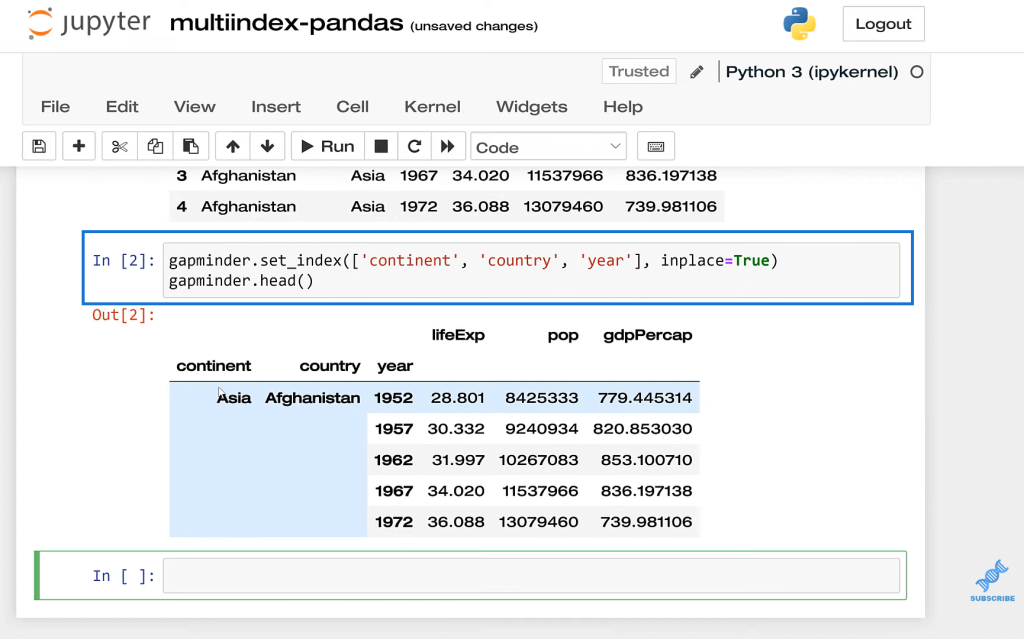
This is just saving the results, so we don’t have to call the variable twice, just a little more efficient. And now, you’ll see that we have the index here, (content, country, year) and this is our multi-index.
A couple things we could do here. Let’s say, for example, I wanted everything in the Europe continent. I want to filter or slice this data frame. I can use gapminder.loc, and then type in Europe. You may be familiar with loc. From other circumstances in Pandas, it works a lot more easily when we are doing it by the index.
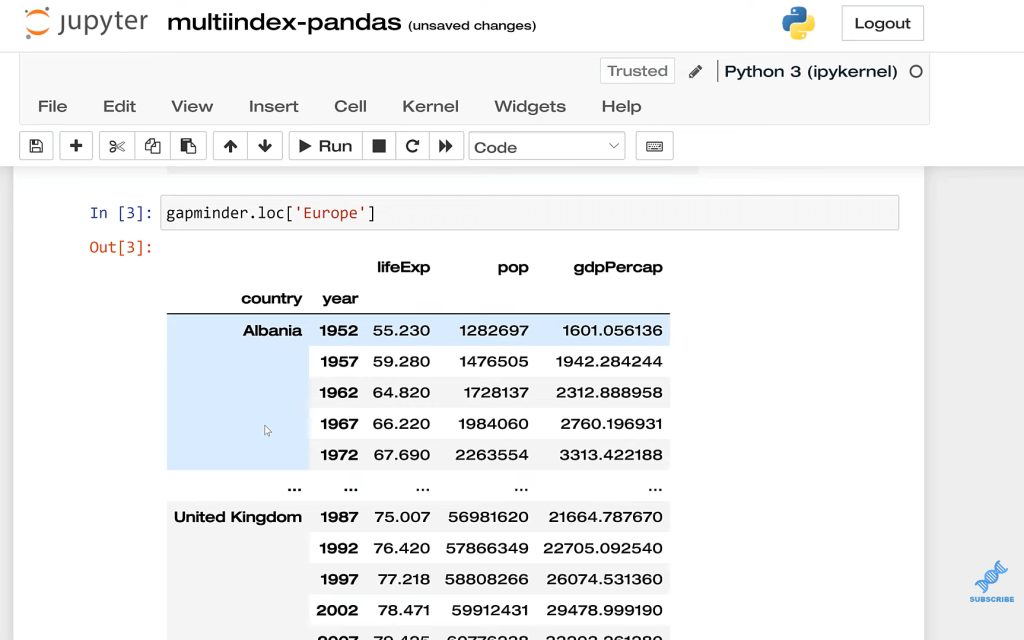
Now this exists in a hierarchy. Let’s say, we only wanted the data from the United Kingdom. It seems like we would be able to just slice this, but this is going to be a problem because when we index this, we’re stuck to using the hierarchy. We need to start with the first level, and then drill to the second, and the third, et cetera.
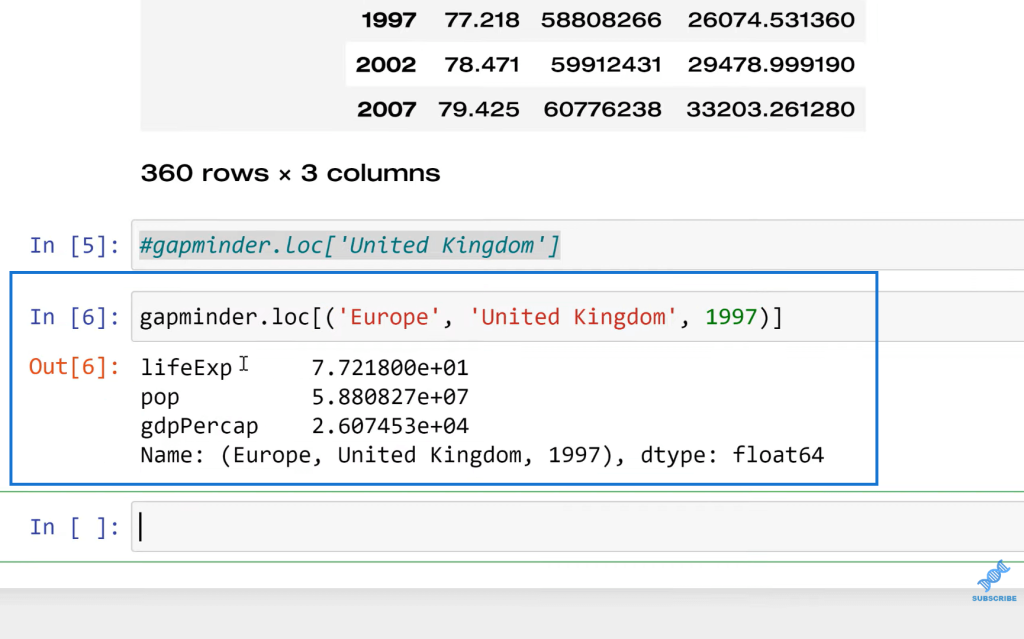
If I wanted to include multiple levels, what I can do is pass it in here. I’m going to do Europe, and then the United Kingdom. I could even go a step further and put 1997. And now, we can see here’s the result of that row in that case.
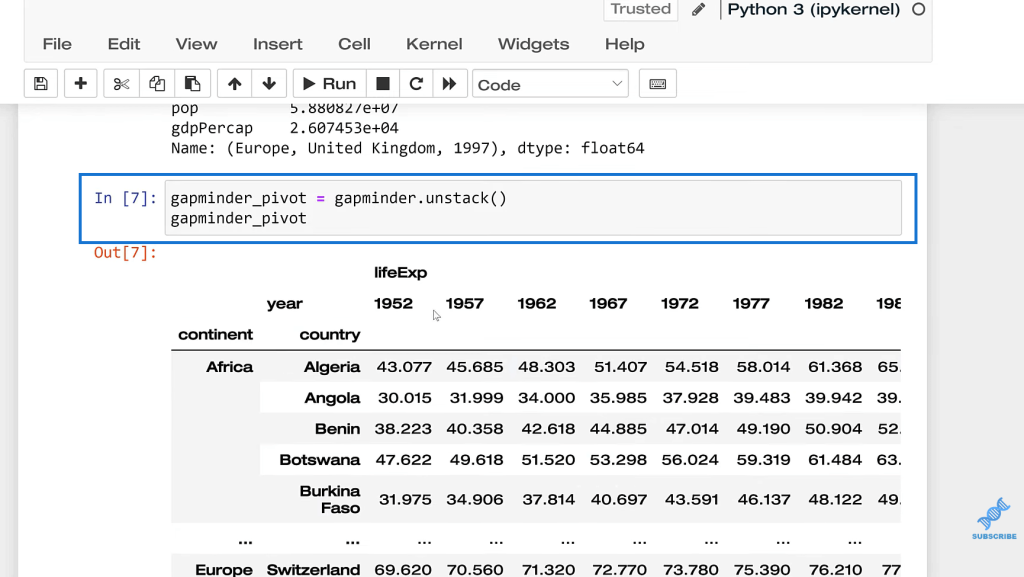
Another nice thing with the MultiIndex in Pandas is that it’s a lot easier to reshape the data. I can do gapminder_pivot and then gapminder.unstack. If I need to reshape this data set, for some reason, I’m going to print this and you’ll see that now we have the continent, country, and then year along with the columns.
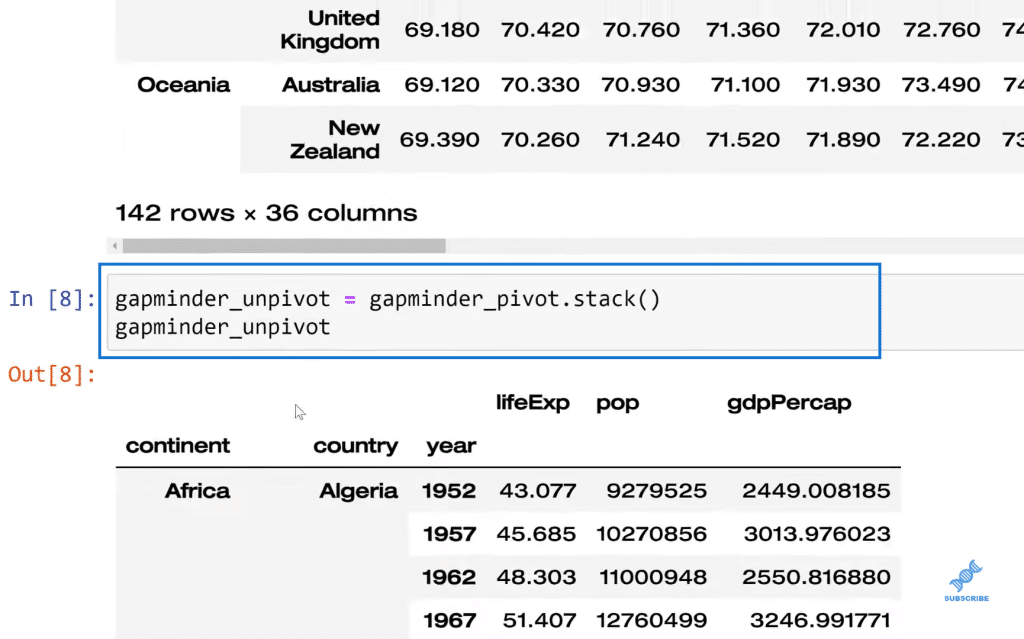
Now, let’s say I wanted to do that in the opposite direction. All I would need to do is unpivot and we’re going to do gapminder_pivot. If that was unstacking, then this is stacking gapminder_unpivot.
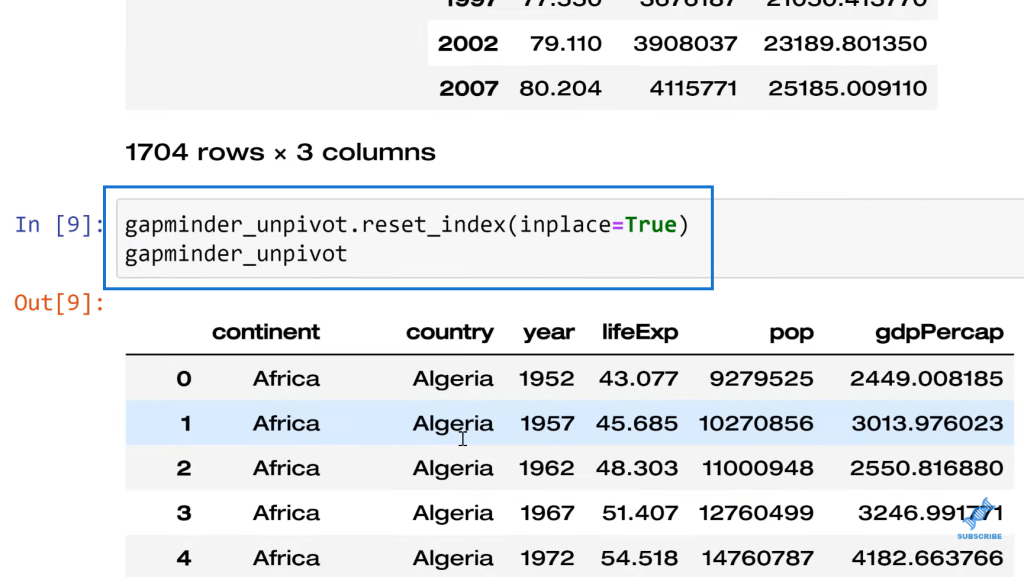
Now, what if I want to get rid of this index and reset it and change it to something else? All I need to do in that case is gapminder_unpivot. We’re going to reset_index. We’re going to make that inplace again. We don’t have to save over itself. It’s just a little more efficient. Then, gapminder_unpivot.
Print that and we’re back to our original data and we have the index. The numeric starting is at zero because Python is zero-based indexing.
***** Related Links *****
Python In Power BI: How To Install And Set Up
Python Scripting In Power BI Data Reports
Power BI With Python Scripting To Create Date Tables
Conclusion
Pandas was initially named after panel data. It’s really meant to work with panel data, which is a specific type of time series data with multiple categories. In that case, having a hierarchy really makes sense, right?
This works really well if you’re working with unique rows, trying to find multiple columns.
As far as the performance, it could be that the index is not necessary if you’re merging, but we weren’t merging here. We were just operating, accessing, indexing, reshaping, etc. However, coding efficiency is definitely a big benefit.
So that’s everything for MultiIndex in Pandas. I hope this is something that you can use. You learned something a little new about Pandas today.
All the best!
George
[youtube https://www.youtube.com/watch?v=_YesMZLtakA&w=784&h=441]


