
In this tutorial, I’m going to teach you how to manage multiple date calculations in your Fact Table in Power BI. You may watch the full video of this tutorial at the bottom of this blog.
This is a frequent question in the Enterprise DNA Support Forum.

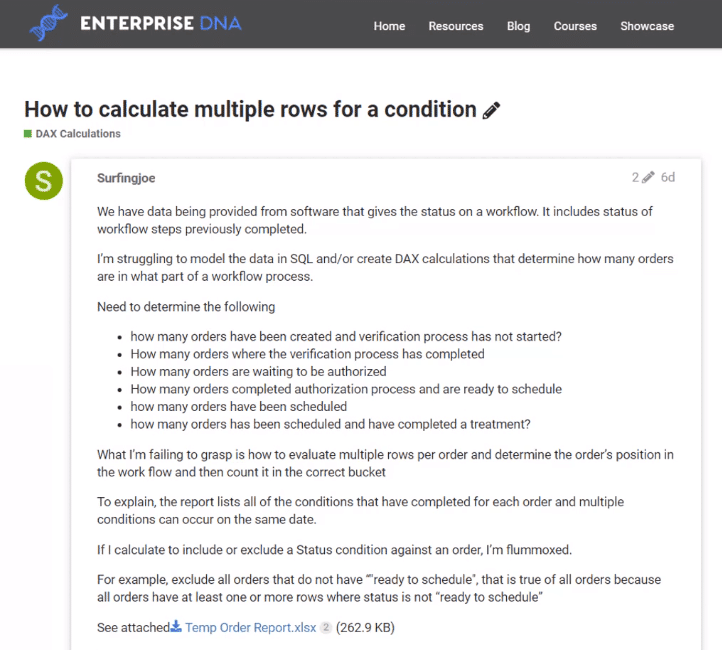
These multiple dates could be order dates, ship dates, expiration dates, and arrival dates, among many others. This information might be located within one row in your data set.

Here are some insights you can get out of this technique:
- The amount of orders currently being shipped
- The amount of orders waiting to be shipped
- The number of people working on a project
- The number of days the project has been going on
Writing the formulas for this technique can be confusing when you’re just starting out in Power BI.
With the detailed example in this tutorial, you’ll understand how to manage multiple date calculations in your Fact table.
The Formula And Model
Let’s look at the model of the demo data set for this tutorial.

This kind of table can exist for order dates, expiration dates, and request dates, among others.
Setting up the model can be very confusing.

It’s a two-step process. One, the model needs to be correct. And two, the calculations should have the correct DAX formulas.
The great thing about this technique is its ability to be used in other similar scenarios.
Now, the calculation needs to show the number of orders that are live for specific dates. In this case, live means orders that haven’t expired.
The formula needs to count information that sits between multiple dates. The context can vary depending on what you’re trying to solve, but the technique will be the same.
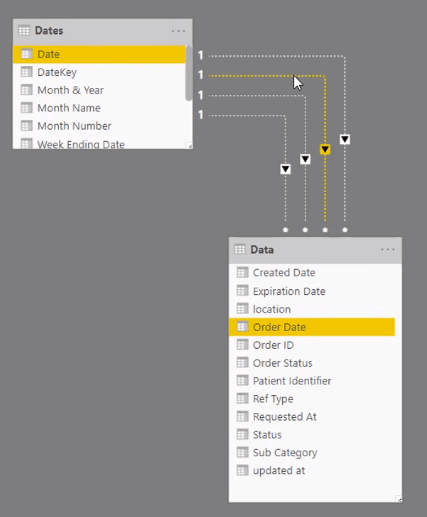
This is how the model should be set up:
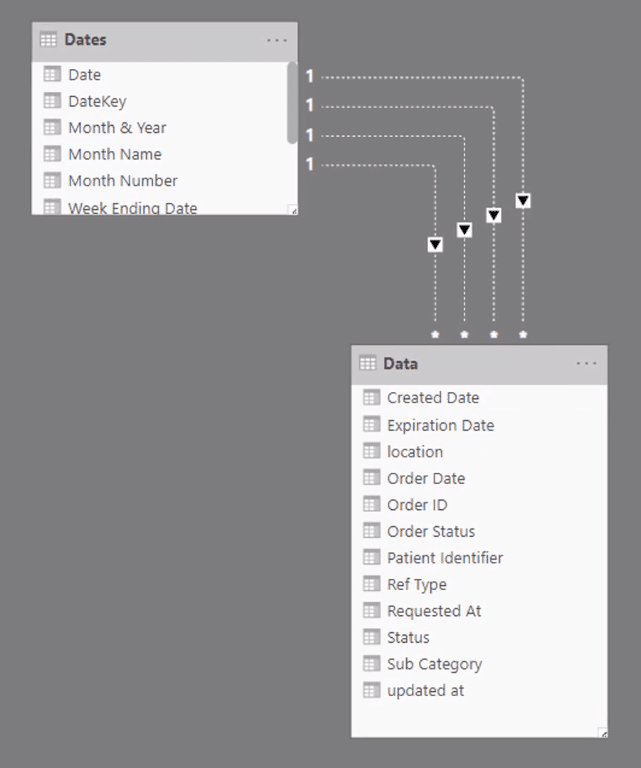
You need to use inactive relationships.
For the calculations to be correct, you can’t have active relationships in the model.
When you want to calculate a logic that involves counting elements that are in progress, you need to have inactive relationships.
Having inactive relationships is the simplest method you can use to solve this problem. If you want to have active relationships, there are other advanced and complex methods that involve writing a new formula. However, this isn’t recommended.
Moving forward, you need to write a formula that uses the context in the Fact table and then works through an advanced logic inside the data table.
A Better Understanding Through Visuals
To better understand how this technique works, look at this visualization:
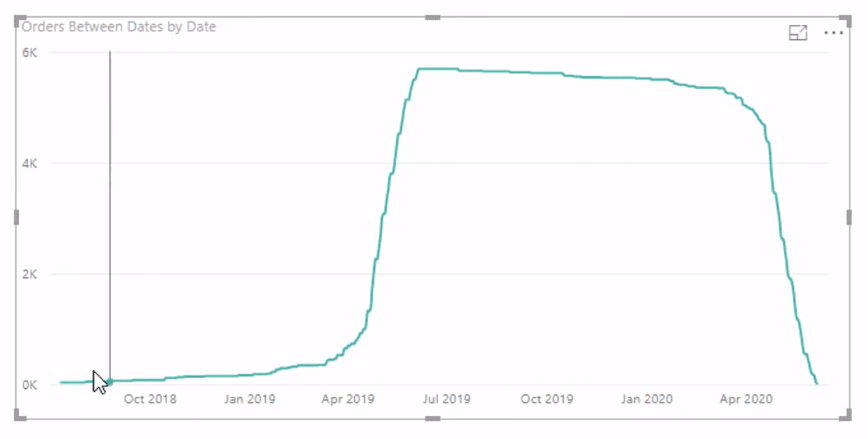
The time frame in the visualization is showing how many orders there are between the order and expiry dates.
Between April and July 2019, you can see a huge spike indicating that many orders have expired:
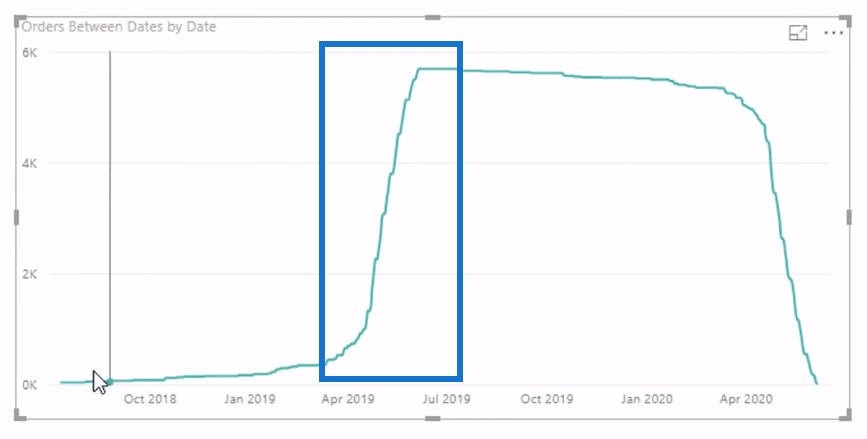
This visualization makes it easier to understand what the technique is doing.
Calculating The Active Orders
Here’s how to work out the number of orders that are still live and active.
First, you need to start with a formula for Total Orders:
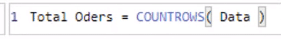
The formula uses the COUNTROWS function to sort through the Data table.

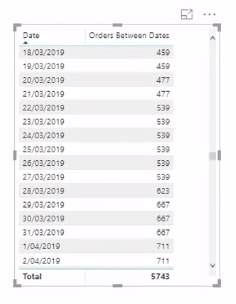
Next, you need a formula that can count the orders you have for a certain day:

If the order date is less than and the expiration date greater than a certain day, it will count all the individual orders that belong within that date range.
For every single row in the table, there’s currently zero context coming from the model’s Fact table because there aren’t any active relationships.
Going back to the formula, the MAX and MIN functions are simply returning the date for every row in the table.

As an example, the March 21, 2019 row has 477 orders.
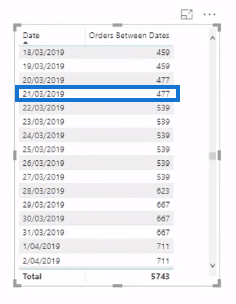
This is the result of iterating through every single order date within the 5,700 rows in the Date table. There are 477 orders that are less than the expiration date and greater than the order date.
The Order Between Dates formula will use that same logic for every row in the table.
Now, the Total you see in the table has no date context.
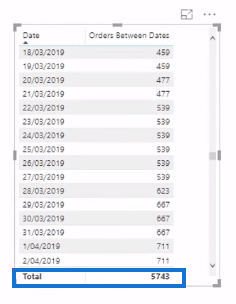
It is simply the sum of all the orders for each date that fits the criteria set by the FILTER statement in the formula.
Why Using Inactive Relationships Is Important
Let’s go back to why inactive relationships are the key to making the model work.

Using inactive relationships in the model is cleaner. It also allows you to easily turn on any relationship depending on what you need for a certain calculation.
Here’s an example:
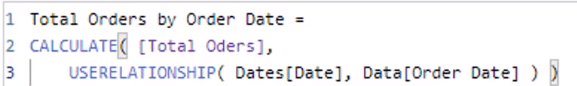
If you want to get the Total Orders by Order Date, you need an active relationship between the Date table and the Data table.
By using the USERELATIONSHIP function, you’re able to virtually turn on the relationship between those two tables within the formula.
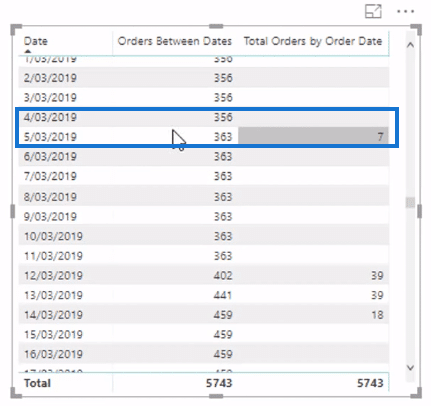
This is how it looks in the table:
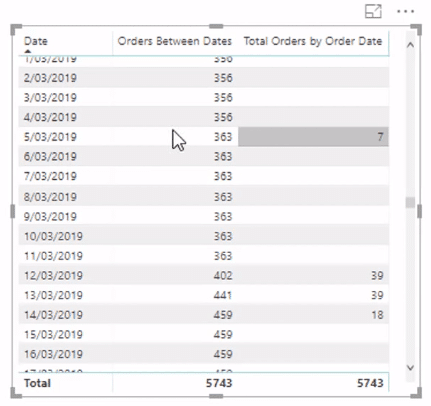
Under the third column, you’re only getting the number of orders per day for every row.
As an example, you can see that there are seven orders between the two consecutive rows:
Virtually turning on the relationships between tables allows you to branch out into different formula patterns.
***** Related Links *****
How To Work With Multiple Dates In Power BI
Master Virtual Tables In Power BI Using DAX
Discover Multiple Product Purchases Using DAX In Power BI
Conclusion
In this tutorial, you learned how to calculate the number of days between multiple dates in your Fact table using a specific formula pattern, and by creating inactive relationships in your model.

The FILTER statement along with its specific parameters is the key to arriving at the desired result.
Furthermore, being able to virtually turn on relationships between tables using the USERELATIONSHIP function in Power BI allows you to reuse this technique in different scenarios.
Cheers,
Sam


