Most DAX beginners and even intermediate users really struggle in understanding what the EARLIER function does. It also took me a long time to understand how, when and why you should use this function in Power BI. You may watch the full video of this tutorial at the bottom of this blog.
In this article, we are going to complete a deep dive into using the EARLIER function. I’ll show you EARLIER function examples and how to use it effectively.
Also, I’ll be showing you a much more intuitive way to run calculations instead of using the EARLIER function at all.
How & When To Use The EARLIER Function
Historically the EARLIER function was the only way to manipulate the context of a calculation within a particular formula. But since VARIABLES were introduced, it is now not as essential as it once was.
However, understanding EARLIER function is important if you want to take your DAX knowledge up to a new level. It requires a thorough understanding of row and filter context, which are vital concepts when working with DAX calculations.
For a quick revision of the general (but very important) concept of context see the links below.
Evaluation Context – (1.8) Ultimate Beginners Guide to DAX
Filter Context – (1.9) Ultimate Beginners Guide to DAX
Explaining Row Context – (1.10) Ultimate Beginners Guide to DAX
I’ll be using the Products table for all of the examples we run through here. If we take a quick look at the model you will see that my Products table is a lookup table with a relationship down to my Sales table (which is considered a fact table).
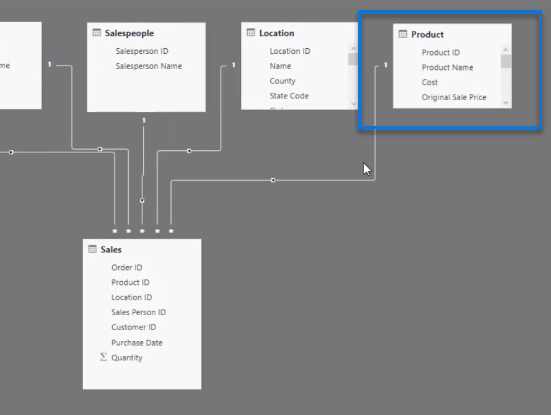
I want to calculate some cumulative totals within this particular table.
The first cumulative total is a generic one. I wanted to calculate it just based off a general index that I have for each product which is derived from the Product Name that I have in this particular table.
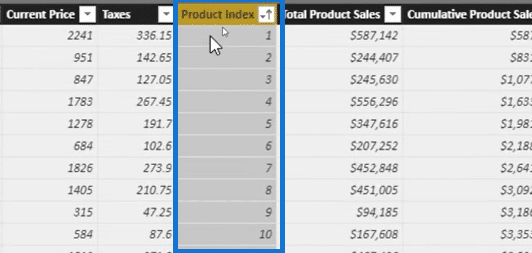
The next thing I did is place the Total Product Sales inside the Total Sales measure. One key concept of this particular formula is context transition.

Context Transition And Row Context
Context transition occurs by placing a measure inside of the expression. And then you are able to move from a row context to a filter context.
That’s how this particular result is filtered for Product 1.

I dived into that because understanding context in a table and a calculated column is key here. And in this particular case, we’re using row context.
Row context means that an evaluation is going to happen at every single row. And every single row in a calculated column has a result with the evaluation that’s happening at every single row.
Cumulative Total Examples Using The EARLIER Function
Now, I want to calculate a cumulative total based on this particular row in the Cumulative Product Sales column, and I want to do it in a calculated column. This is where the EARLIER function in Power BI comes into play.
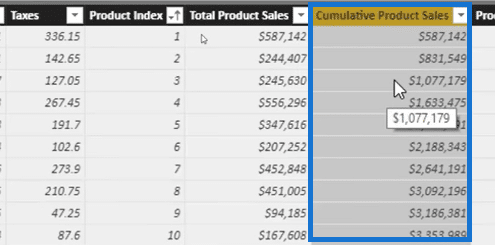
The formula for this example contains the FILTER function. And in this particular formula, FILTER adds an additional row context.
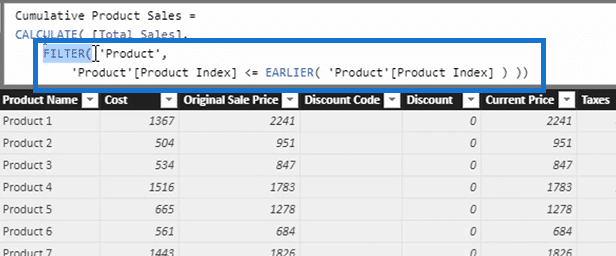
We started with a Row Context for this calculation and then used the Filter Function which will evaluate through every single row in the product table.
And then in every single row in the Product table, we look at what the index is and evaluate if it is less than a specific number that we have in the row.
Scenario 1: Product Index Is Less Than Or Equal To 8
For this particular row, we want to calculate everything that has an index of 8 or below.
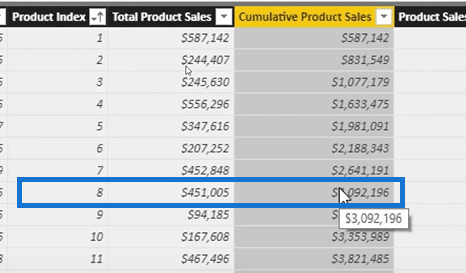
We need to evaluate through every single row in the Products table and work out if there is an index number less than or equal to 8.
If there is, then we want to calculate all the sales for those particular products. And as we go down, it re-evaluates the rates.
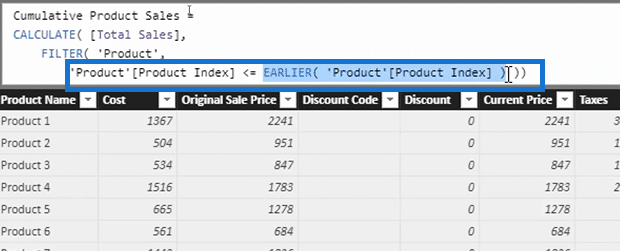
EARLIER enables us to jump from one row context to the earlier row context to retrieve a value.
Scenario 2: Product Index Is Less Than Or Equal To 10
In our next example, the particular result is 10. We want to evaluate the Product Index at every single row if it is less than or equal to 10.
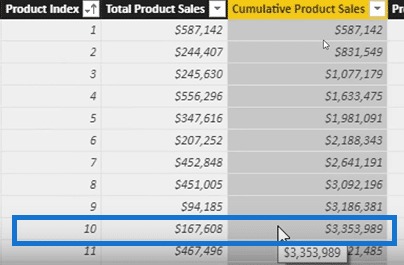
Now, some of you who are familiar with the cumulative total concept might think that we can use here the MAX function instead, since that’s what we do in the generic cumulative total pattern.
But if I put a MAX in the formula, it will always evaluate to the maximum products. Also, it doesn’t actually evaluate the product index at the particular row.
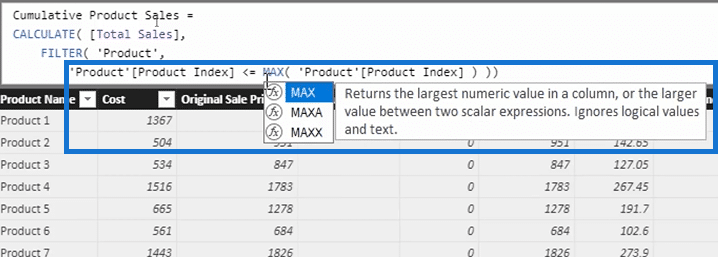
So we need to get out of this row context and then jump back to the very initial row context to retrieve the Product Index. And that is what EARLIER does.
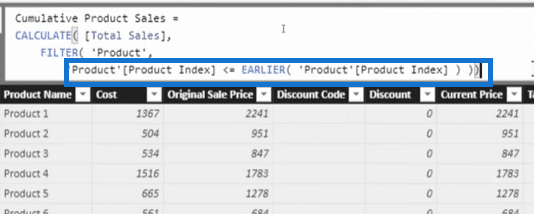
The EARLIER function allows us to jump from one context to a prior row context, so we can grab the result that we want.
Scenario 3: Using Product Ranking Instead Of Product Index
For our next example, I’ve ranked my products based on sales. I’ve also got a rank based on where they all sit.
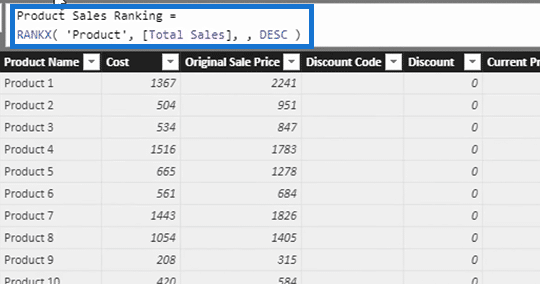
The top ranked sales for our products is $864,000 and that’s Product 63.

Now, I want to create a cumulative total based on the ranking. Instead of looking at the earlier index, I’m actually looking for the earlier product sales ranking.
So we have to go through every single product in this particular product table to evaluate if the product ranking is less than or equal to the product ranking on that particular row.
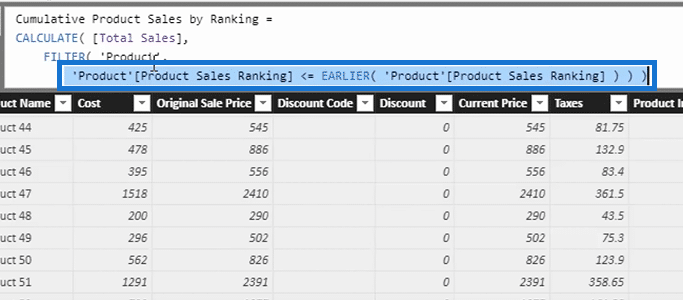
EARLIER is jumping out of this row context and jumping back to the initial row context created by being in a calculated column.
A Better Alternative To The EARLIER Function
Using EARLIER function can be a little complicated. But the good news is we have a better way to do these calculations in Power BI.
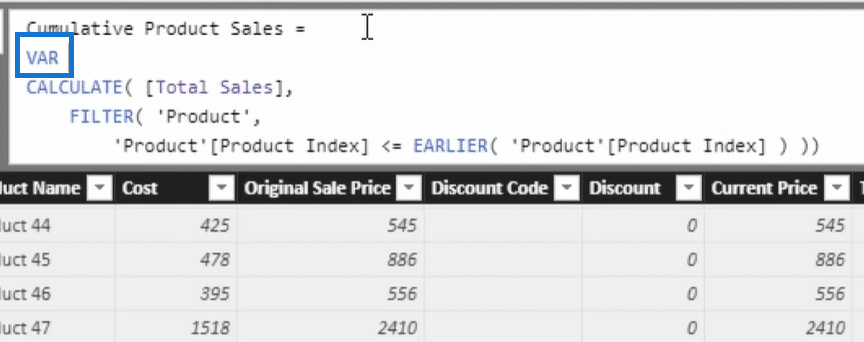
VARIABLES is a far superior way to do the calculations. I’ll show you how you can bypass EARLIER.
In this example, instead of jumping out of the row context created by a filter, we can actually just retrieve the Product Index value in its initial row context in a variable.
So I took EARLIER out and put in the variable ProductIndex.
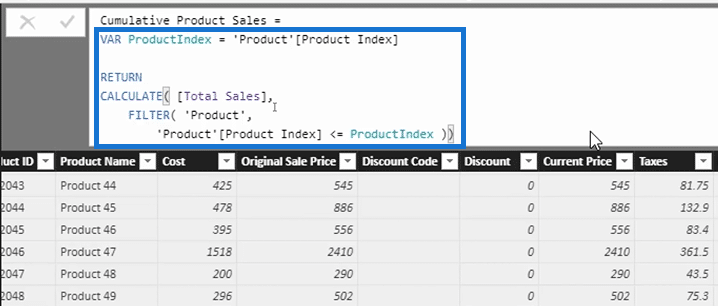
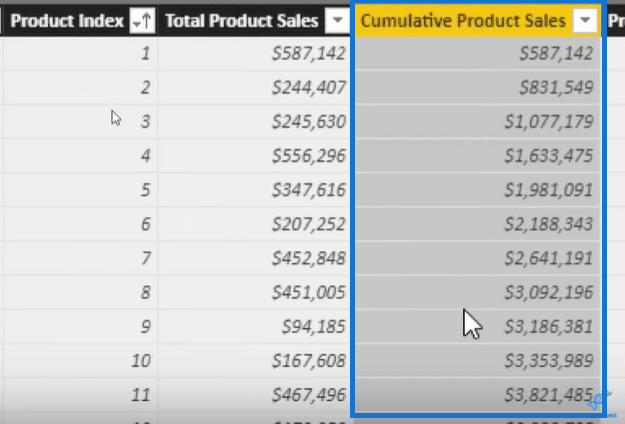
You will see here that the Cumulative Product Sales now works perfectly in this new format as well. It looks like how it did before.
We can do exactly the same with the Cumulative Product Sales by Ranking using this calculation:
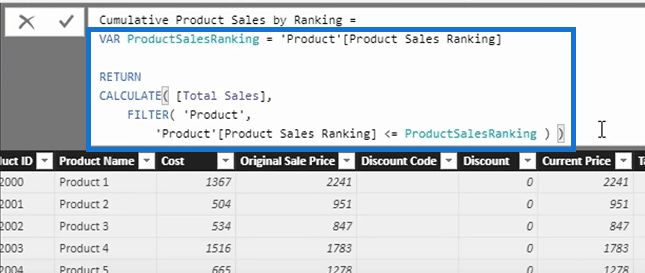
And then if we sort the Product Sales Ranking column from ascending, we can see that the highest ranked product is Product 63.

***** Related Links *****
Simple Filters w/CALCULATE – Ultimate Beginners Guide to DAX
How To Calculate Budget Or Forecast Results Cumulatively In Power BI
Compare Multiple Metrics Cumulatively in Power BI using DAX
Conclusion
Using VARIABLES is a far superior way to tackle all the examples that I’ve shown earlier.
And to be honest, with all the development work that I’ve done before, I rarely used the EARLIER function. But it is still a cool function to know and understand.
Variables are key when you write DAX in many different areas of Power BI. This is where things become a lot simpler.
Instead of having to jump in and out of context within formulas, you can actually initiate the calculations within variables or isolate the calculation with variables in it, so the execution of a formula is more seamless.
You can browse through these links to get more information on this topic:
Formula Syntax, Comments & Variables – Ultimate Beginners Guide to DAX
How To Use Variables in DAX Formula with Power BI
Hopefully, you can get a good understanding of how this particular calculation operates inside Power BI.
Sam


