In this tutorial, we’ll go through date harvesting in Power BI to get information from a date slicer for a time intelligence analysis. You may watch the full video of this tutorial at the bottom of this blog.
From previous tutorials, we’ve learned how to extend our date table while integrating a holiday table to it. Now, we need to harvest dates from the data slicer to start using our table.
Technically, we can harvest the end points of the slicer. But if the date slicer is utilized, we can harvest valuable information like the following:

There are five ways to perform a date harvest in Power BI:
1. Basic Harvest
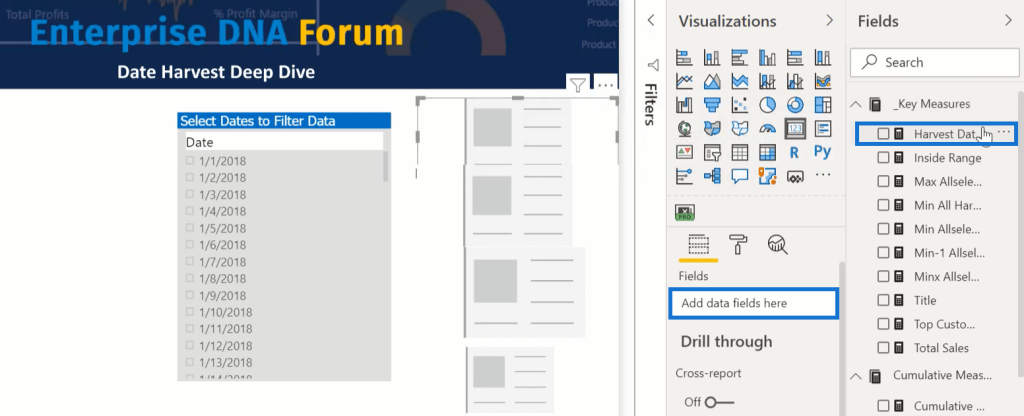
In this example, the basic harvest is a measure called Harvest Date Selected. It is getting a SELECTEDVALUE from the Date table in the Date field.

If we take and drop that into the Field, it’ll start off blank.
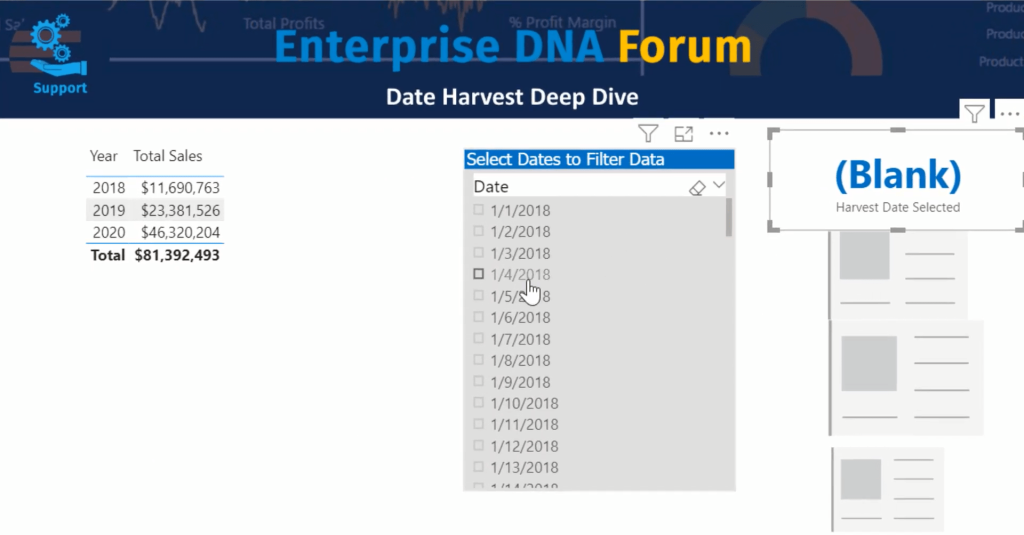
And if we choose a date, it will harvest that date in another measure through measure branching.
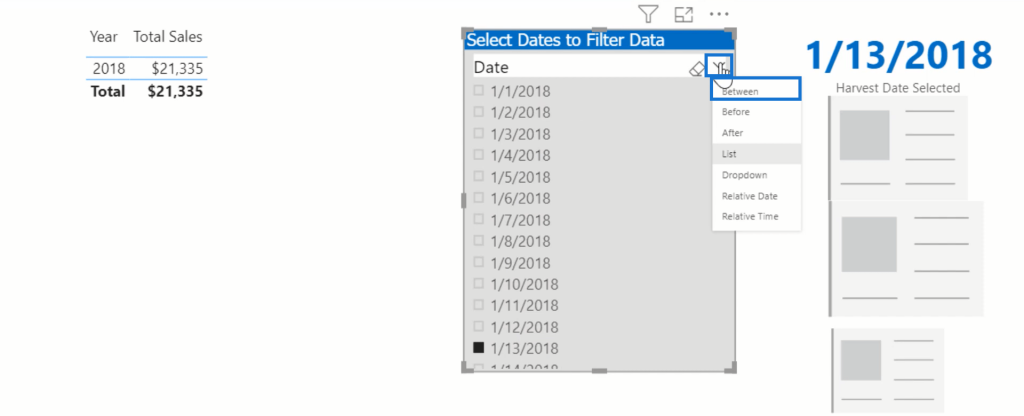
If we change it to a “Between” slicer, it will show blank because using SELECTEDVALUE requires a single unique value.
Instead, we need to use this formula for multiple selected dates:

We must be as narrow as possible with the ALLSELECTED filter by doing both the dates table and the date field.
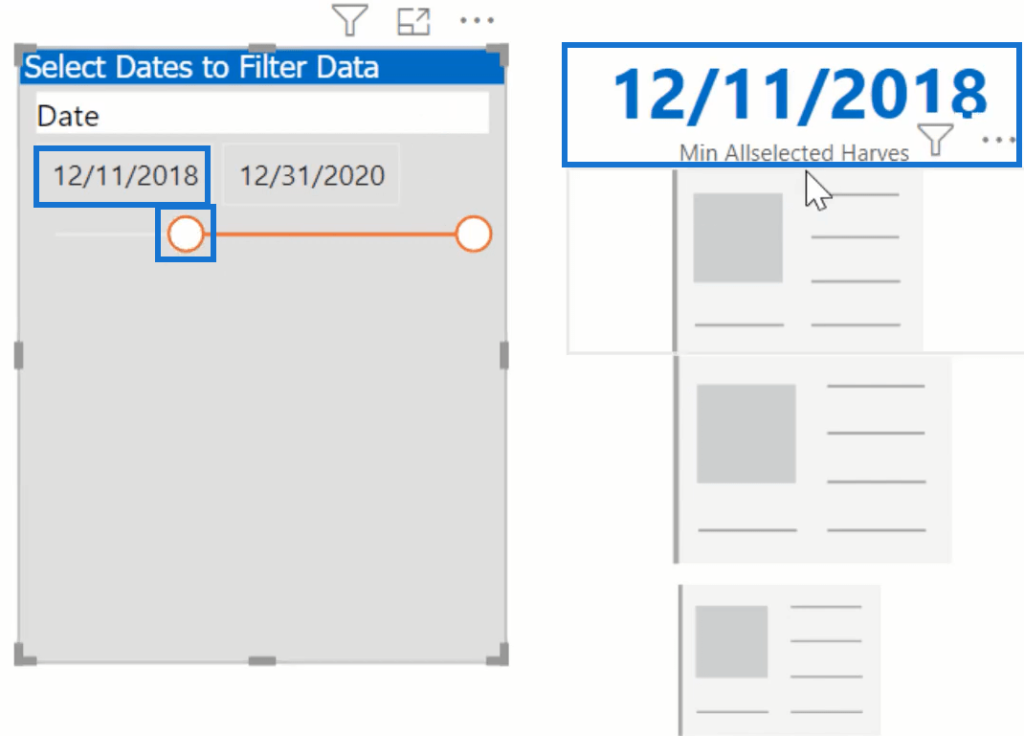
If we drop the Min AllSelected Measure into the Fields section, we’ll see that it harvested the beginning of the slicer.
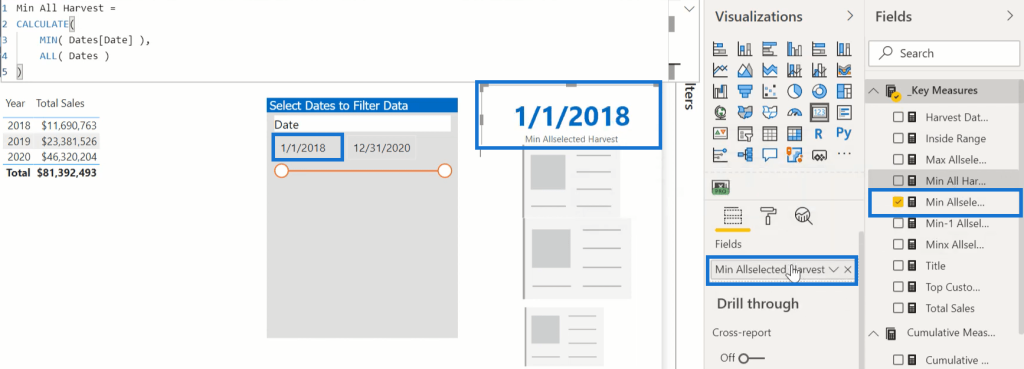
And as we change it, it harvests appropriately.
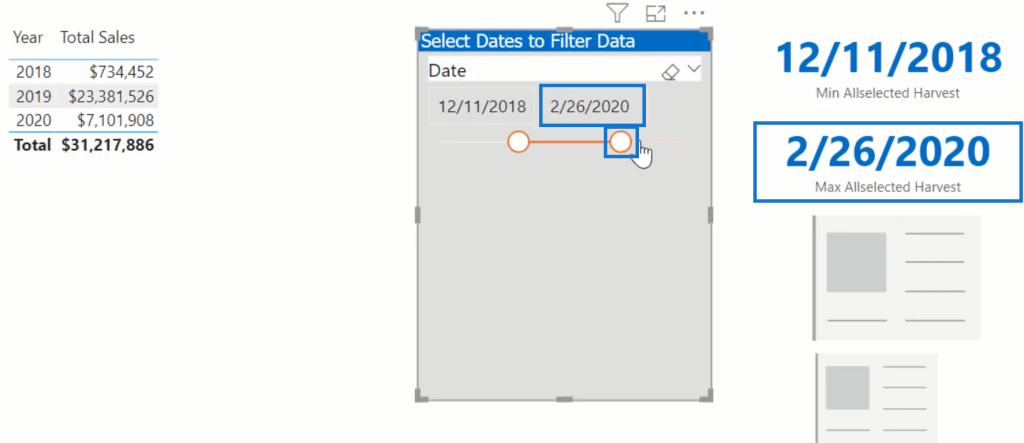
Similarly, if we drop the Max AllSelected measure in the Fields section, we’ll get the endpoint of the slicer.

Moving the slicer around picks up the endpoint.
Now, we can also use MINX and MAXX instead of MIN and ALLSELECTED. If we look at MINX, it pulls the table first or flips the measure around.

If we drop it into the Fields section, it will show the same minimum date value.
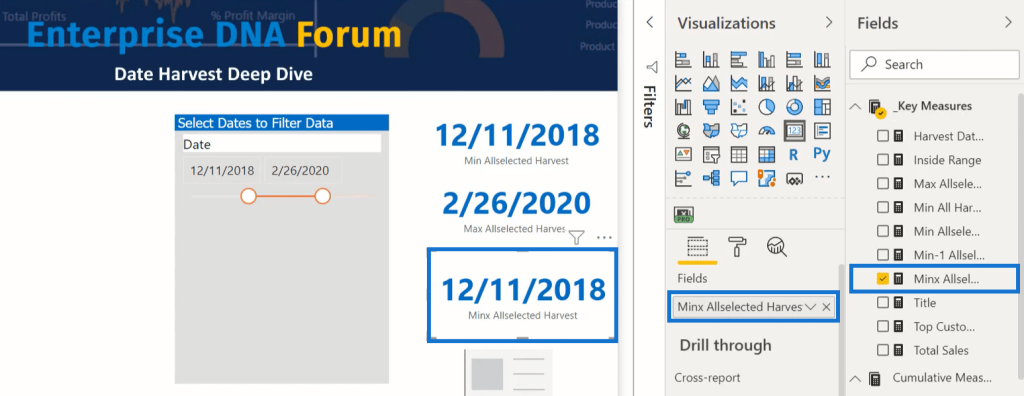
Now, we need to know which one to use. We should uncheck the MINX box.
We’ve now got these 2 endpoints harvested.

2. Pre-Slicer Harvest
We can also look at the beginning of the slicer up to a day before the selected minimum date through the Min All Harvest measure in this example.

Calculate the minimum date and remove the filter on Dates to harvest all the dates instead of the ALLSELECTED dates.
If we drop it in the Fields section, we’ll get January 1, 2018.

Power BI stores dates in a serial number for the days after January 1st, 1990.
In the Min-1 Allselected Harvest formula, we’ll see the measure which is MIN -1 over the ALLSELECTED range.
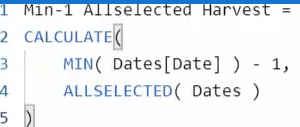
If we drop this measure into the Fields section, it will give us December 10, 2018.
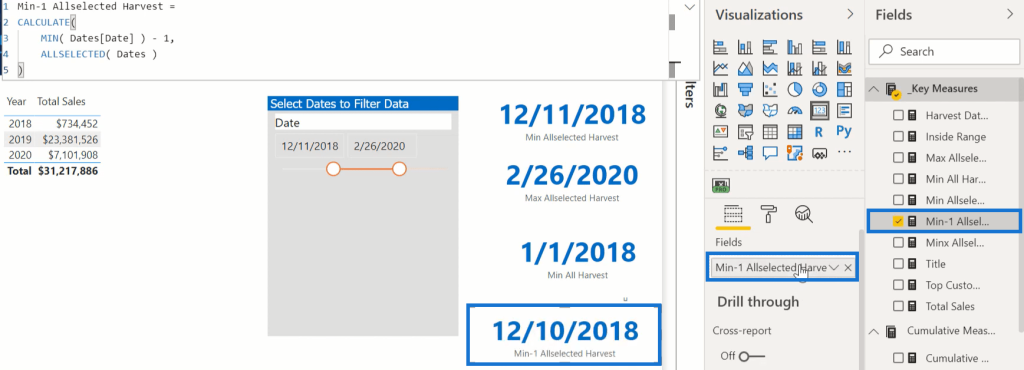
After harvesting the selected range and the pre-slicer range, we can also harvest the date range that comes after the selected range. However, the pre-slicer range is what’s important.
If we look at the Cumulative Sales formula, we’ll see this pattern that gives us the standard ALLSELECTED Cumulative Sales.

To have a starting balance before the Cumulative Total starts, we can carry forward every data from the start up to the point before the first Cumulative Total.
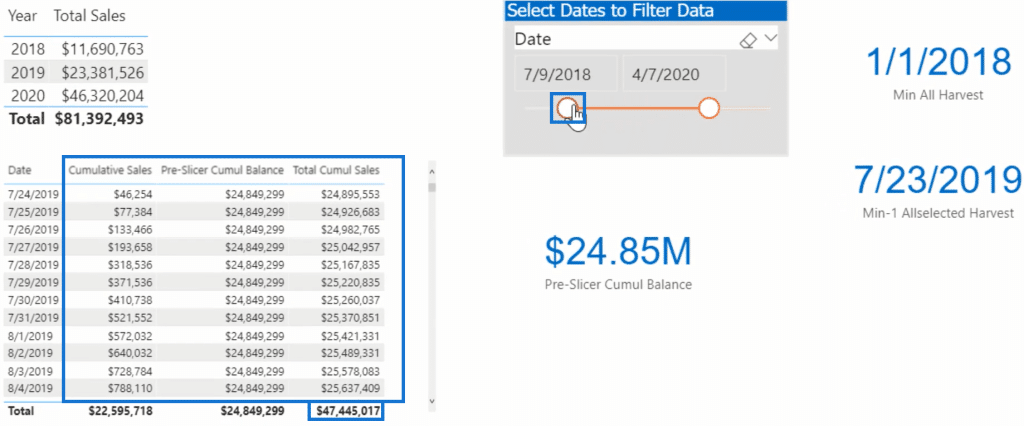
The Pre-Slicer Cumulative Balance formula will show the start date of the Min All Harvest and the end date of Min-1 All Selected Harvest. The DATESBETWEEN function filters the start and end date. The COALESCE function will return the date to 0 when it’s blank.

The Total Cumulative Sales formula calculates our Cumulative Sales, pre-slicer cumulative balance, and the total of both.

Changing the range affects the pre-slicer balance but the total remains the same.
3. All-In Harvest
The third method harvests the entire date table from the start to the end of the slicer range. However, this will require a longer setup.
First, set the customer name up by creating a new measure.
In this example, this measure is called Top Customer.

Use MAXX to get the customer’s name, TOPN to filter the customers table by Sales, and SWITCH TRUE, ISINSCOPE, and HASONEFILTER to prevent the return of a name in the total range.
Next, cut the date table into two separate tables where one has the values inside the slicer and the other outside.
Now, create a Disconnected Dates formula which takes VALUES from the extended dates table and copies them.

We’ll then see a slicer for that table.

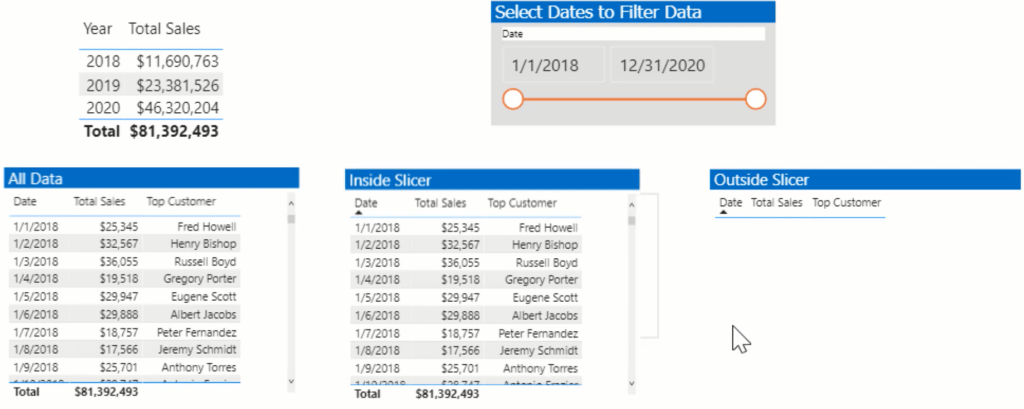
The Inside Range formula takes a table that’s ALLSELECTED in the Disconnected Dates table and reviews each value to check if they are in the date table list.

If they’re in the table list, it will return to 1. If not, it will return to 0. It harvests the dates from the Disconnected Dates table and compares the values.
Next, put a visual filter for the two tables. Set the inside slicer range variable to 1 and the outside to 0.

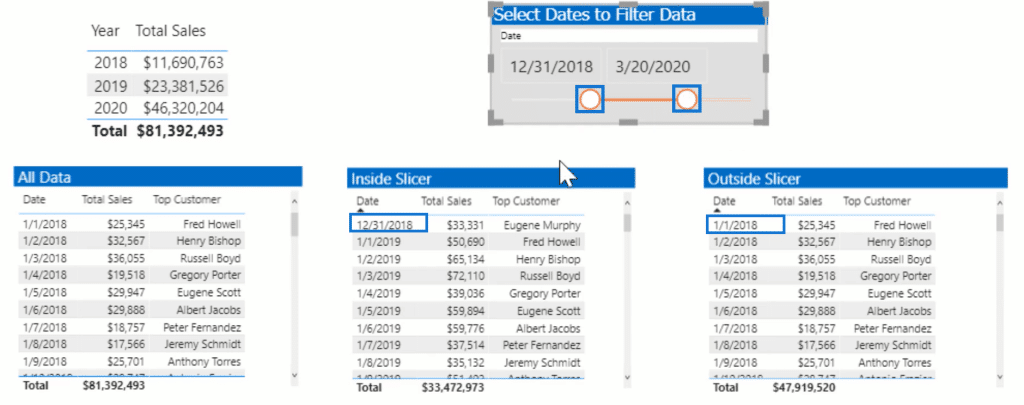
The records inside the slicer range will go to the Inside Slicer, and the records outside will go to the Outside Slicer.

If we adjust the slicer, the tables also adjust.
The Inside Slicer table starts with December 31, the beginning date of the slicer. The Outside table starts with January 1 and ends a day before December 1 and starts back at the end of the slicer.
4. Hierarchy Slicer For Financial Analysis
The fourth method is a hierarchy slicer to structure the date slicer. This is the best for financial analysis.
First, go to Hierarchy Slicer and go to Dates.
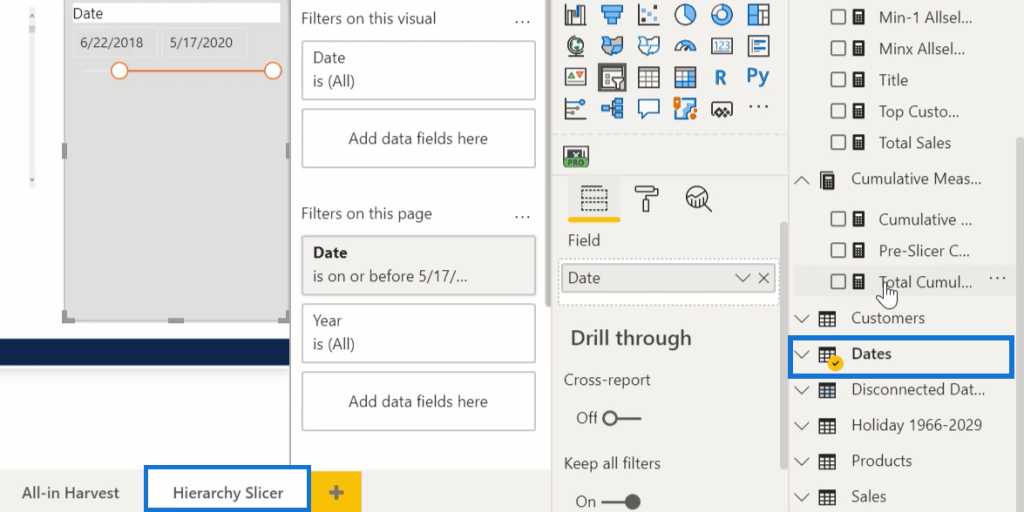
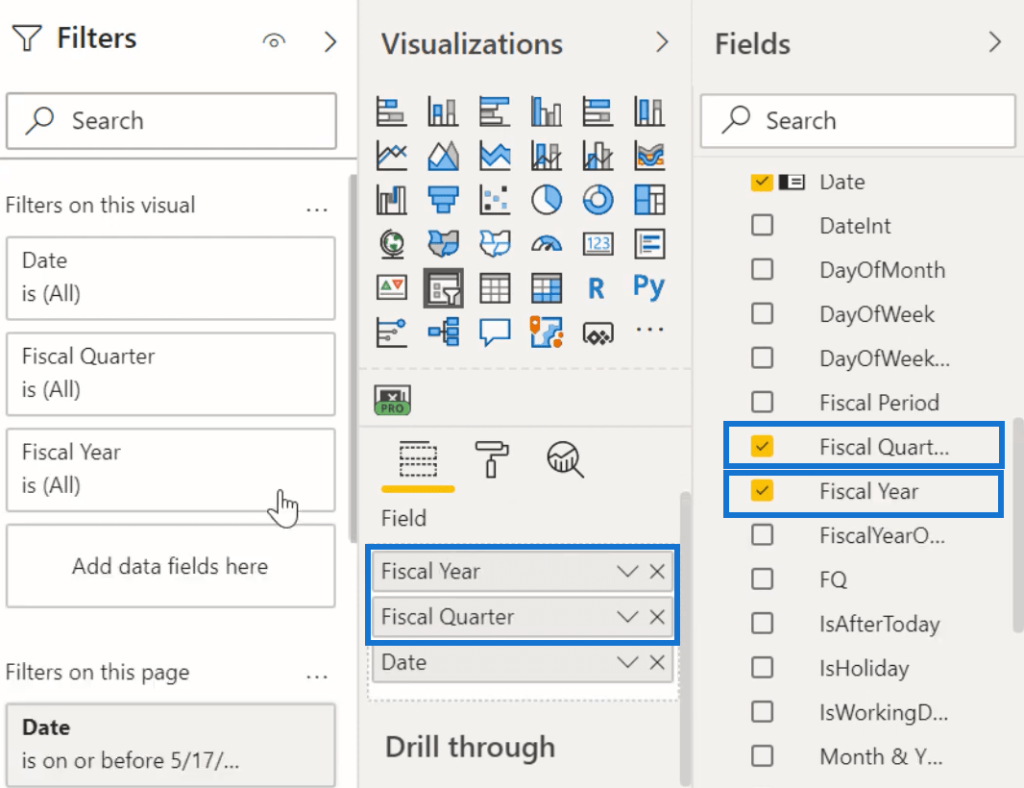
Drop Fiscal Quarter and Fiscal Year in the Field section to create a hierarchy that we can use to select years, quarters, or individual periods with ease.
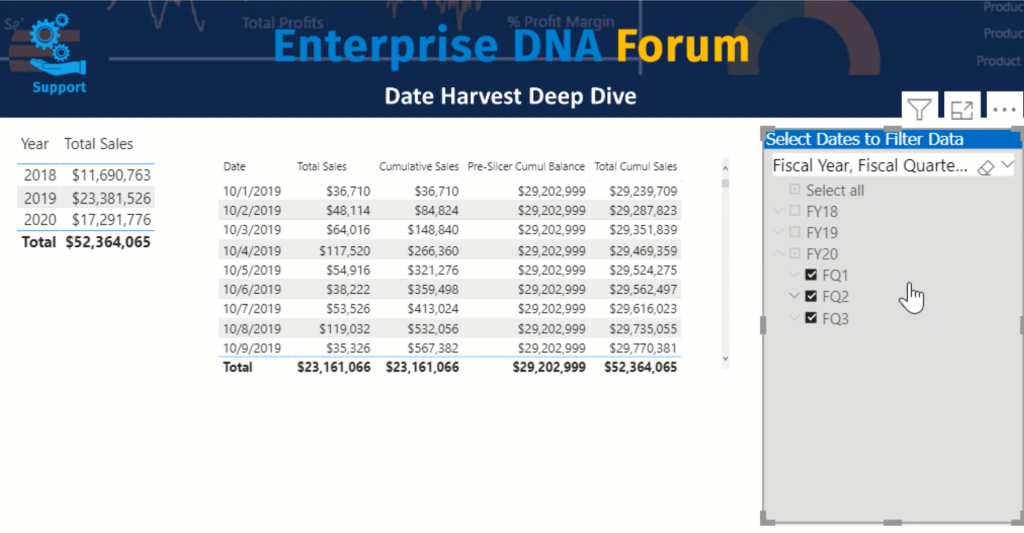
5. OKVIZ Smart Filter Pro
Lastly, we have the OKVIZ Smart Filter Pro.
OKVIZ Smart Filter Pro gives many functionalities, tooltips, and control over our slicers.
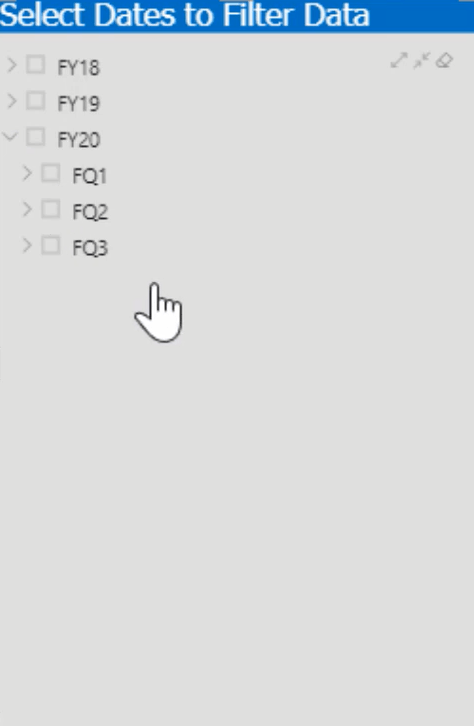
It has different modes that provide many alterations and show the fields we have, along with the number of children in the hierarchy.
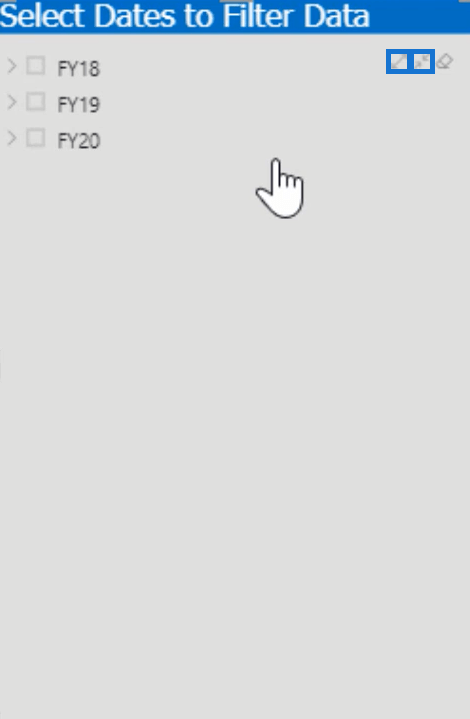
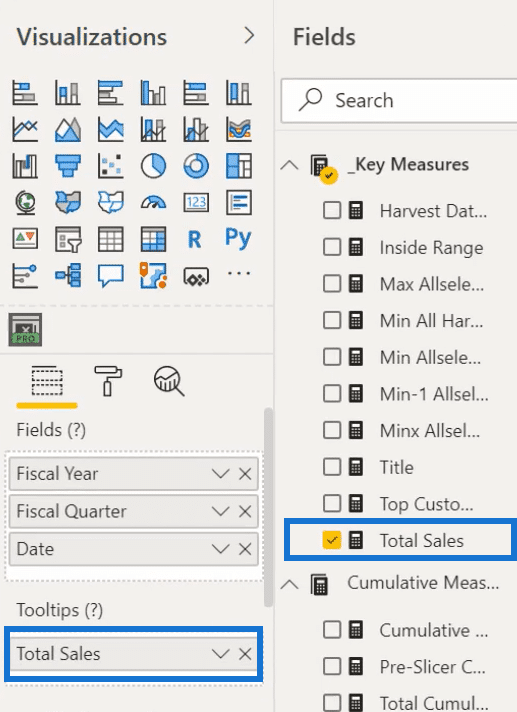
Click the OKVIZ button, choose Format, pick Mode, and then choose Hierarchy. It will show the controls to instantly expand and collapse the nodes.
Also, by dropping the Total Sales in the Tooltips section, we’ll see the Total Sales per fiscal year and quarters.
***** Related Links *****
Show Cumulative Totals Unaffected By Date Slicer Selection In Power BI
How To Harvest Power BI Slicer Selections To Use Within Other Measures
Adding Workday And Weekend Numbers Into Your Date Table: Time Intelligence Technique In Power BI
Conclusion
This method is highly recommended if you do a lot of financial and budgeting analysis because it can help you gain more control and functionality over your work and reports.
All the best,


