
In this tutorial, you’ll learn about the basic concepts of data segmentation in Power BI and SSAS. Specifically, you’ll learn about the operational definition of data segmentation and its advantages.

An Overview On Data Segmentation
When you import data in Power BI, you need to click the Close & Apply option. In the case of Excel, you need to click Close and Load.
Once you click these buttons, Power BI Analysis Services performs a step called segmentation.
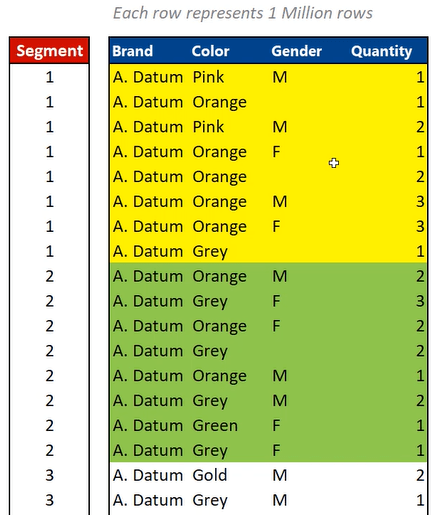
For example, if you have a dataset of 1 million rows, Power BI and Excel will store those rows in one segment. If you increase the data size to 2 million rows, they will create two segments with 1 million rows each. This pattern continues on with every 1-million row increment.
In the case of SQL Server Analysis Services (SSAS), the default segment size is 8 million rows. So if you load a 10-million row database inside SSAS, the entire database will be segmented into two tables. That is, one table will contain 8 million rows while the second will contain 2 million rows. So if you increase the row count to 16 million, there will be two segments of 8 million each.
Advantages Of Data Segmentation In Power BI
For example, you have a dataset with a hundred million rows. Once you click Close & Apply, Power BI loads and compresses the data segment by segment. Once it’s finished with the first segment, it moves on to the next. In the case of SSAS, it will try to optimize by finding the best sort order that increases compression.
By segmenting the data, the pressure put on both the CPU and RAM are significantly reduced. If a hundred million rows were processed at the same time, this would be performance intensive and will create a heavy burden on the capacity of your machine.
Another benefit of segmentation is that it assists the storage engine in scaling your DAX codes. For example, if your dataset in Power BI has 10 million rows and your CPU has six codes, the storage engine can scan six segments simultaneously.

After the six segments have been scanned and the data cache produced, it will move on to the next four segments. Once all the segments are done, they will be combined and sent to the formula engine.
In the case of SSAS, the first 8 million rows are stored in one segment. The storage engine will then move on to the next 8 million rows and continue to store them separately.
So instead of loading the entire data model of a hundred million rows at once, the engine segregates the data model into segments of 8 million rows each.
***** Related Links *****
Power BI Report: Dynamic Segmentation Insights
Data Segmentation Techniques Based On Any Measure – Advanced DAX
Power BI Banding & Segmenting Example Using DAX
Conclusion
This tutorial offers a quick overview on the basic concepts regarding data segmentation in Power BI. To reiterate, Power BI and Excel segments datasets every 1 million rows, while SSAS segments them every 8 million rows.
Segmenting helps optimize the performance of your code. This is also very important if you want to improve your report’s loading efficiency.
Segmentation is a process that happens in the background whenever you use Power BI, Excel, or SSAS. Although it’s not an overt process, it’s crucial in alleviating the computational burden on your CPU and RAM.
Enterprise DNA Experts


