
In today’s blog, we will walk you through the process of using Quick Measures Pro to create a custom measure that returns the top N items in Power BI based on a specific metric. It’s a useful technique for data visualization and analysis, allowing you to quickly identify the top performers in your dataset. You can watch the full video of this tutorial at the bottom of this blog.
Overview
In the Analyst Hub, I have created and saved a custom quick measure which I call the Top N Ranking Measure.


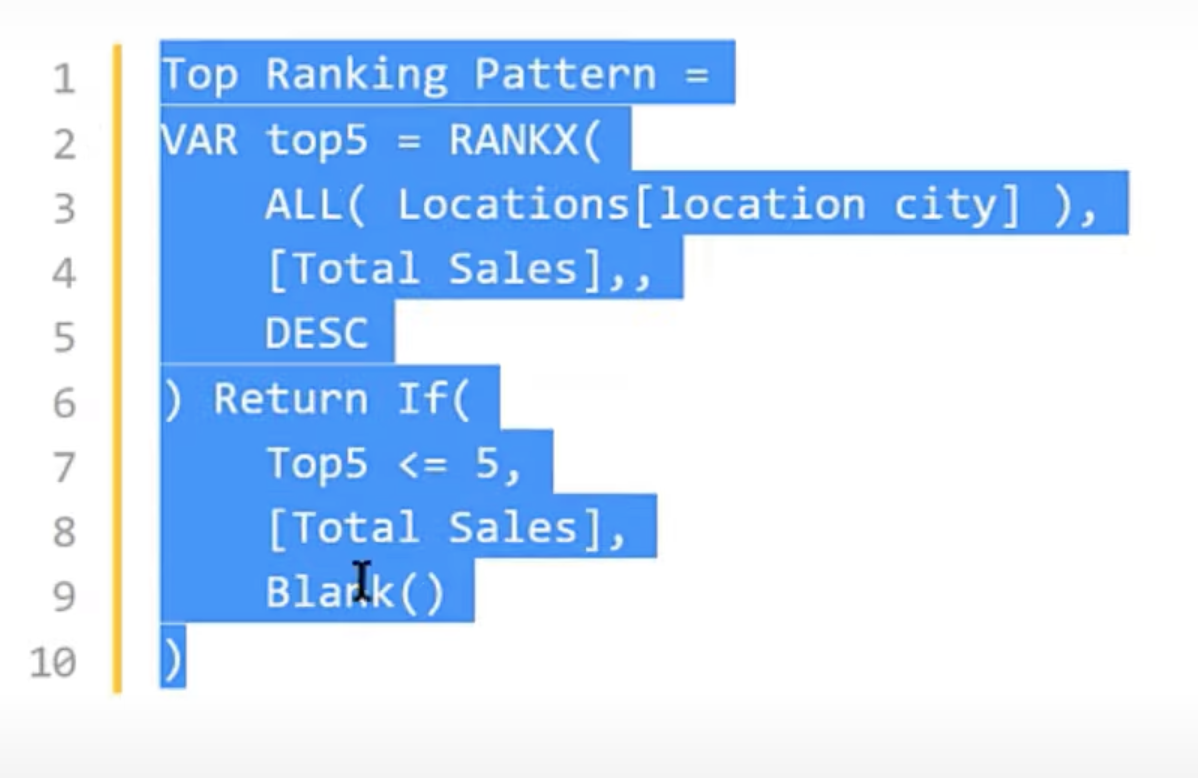
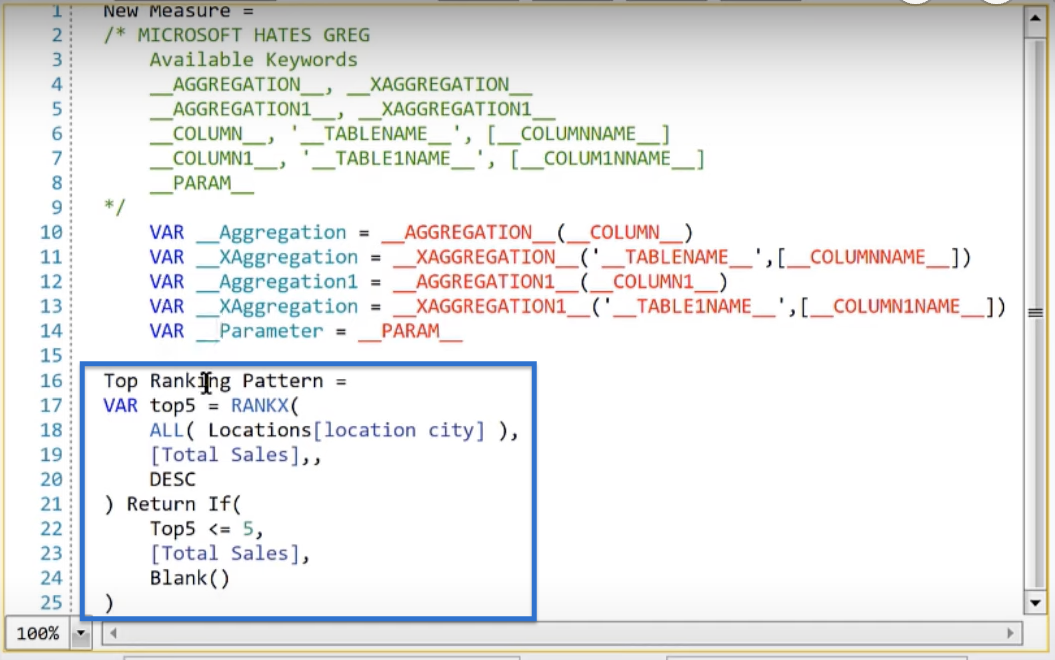
What this measure does is take a number of elements, rank them, and return the top N. Take the code below as an example.
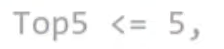
In this case, we want to get the Top 5 and rank all the Locations based on Total Sales using the RANKX function. If the item is on the top 5, the code returns the total sales, otherwise, it returns a blank.

This measure is helpful when we want to rank our data. However, this code is tied to Locations, Total Sales, and Top 5.
What we want to do then is make the code more general so it can take any element, rank it by any measure, and do any number of top N in Power BI reports.
Modifying The Top N Ranking Measure
Start by copying the DAX code.
Open Quick Measure Pro and create our top N pattern quick measure.
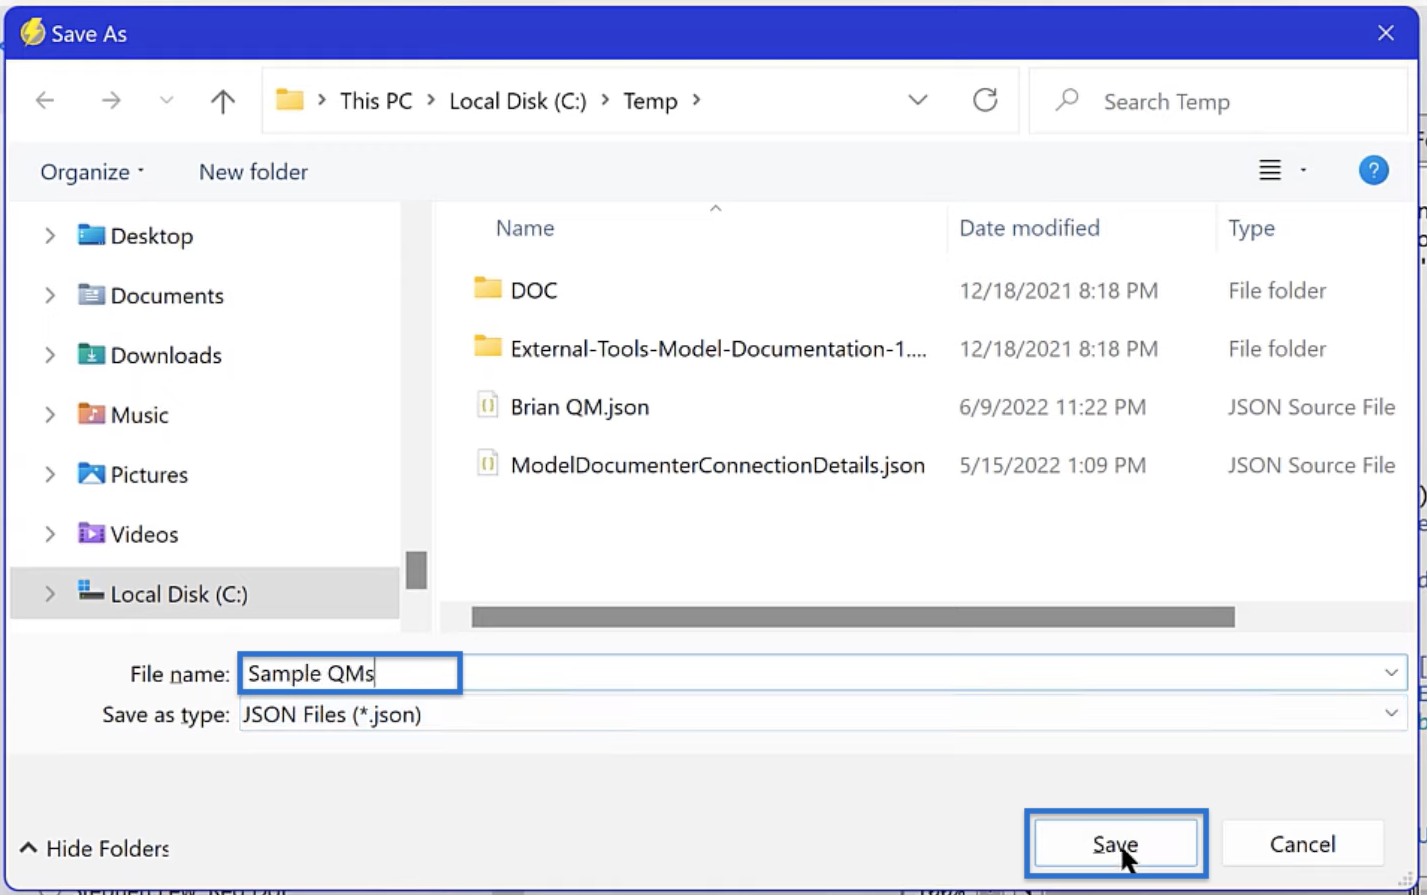
If you have never created a quick measure before, the first thing to do is create a JSON template file. For this example, we’ll name the file as Sample QMs and click Save to any directory that is easily accessible.

If we have multiple quick measures, we may need to change our default file from time to time. We can do that in Quick Measures Pro by clicking Set and opening the JSON template file that we want to use as default.
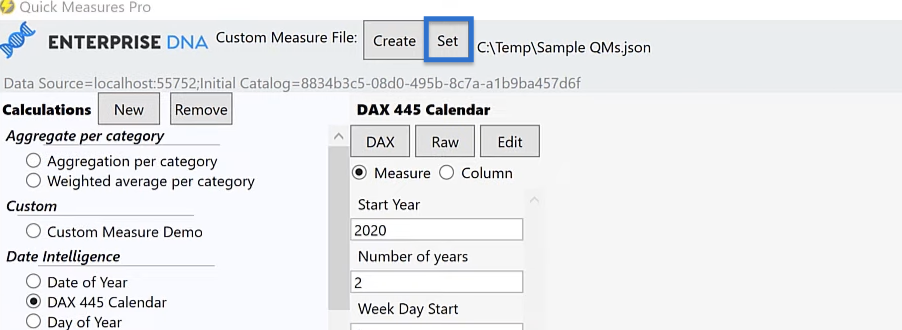
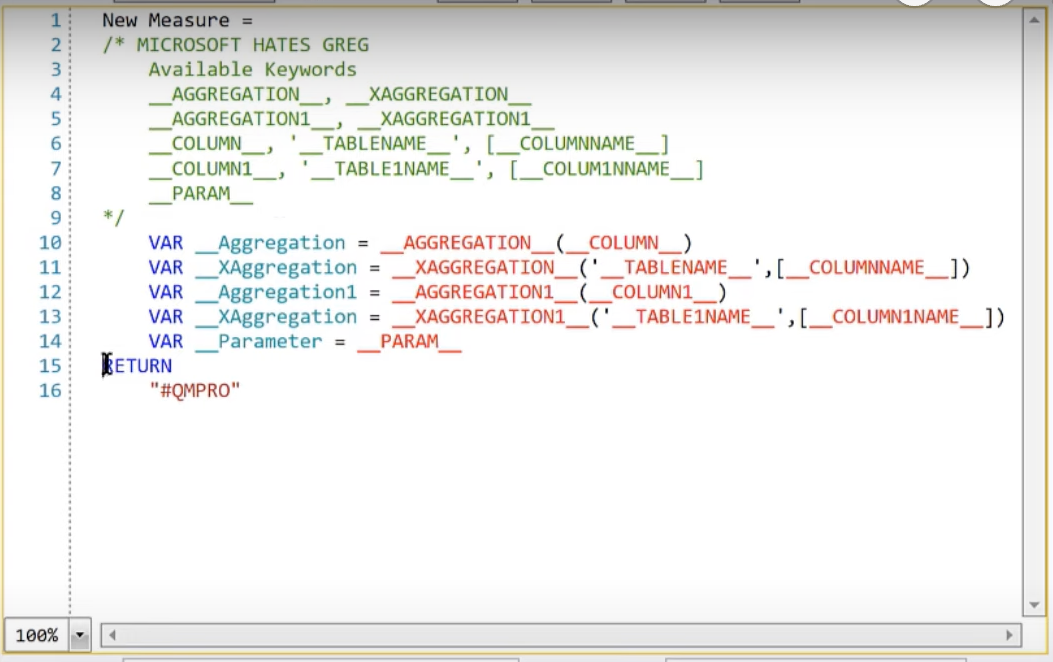
After properly setting the JSON file, go to the Custom Section, then click Custom Measure Demo. Click New and a new measure template appears.

The New Measure may look long and daunting initially, but it’s going to make a lot of sense as we progress.
Top N In Power BI: The DAX Code
Let’s go to the Analyst Hub and look at our initial DAX code measure.
Think of the elements that we want to modify in the future to make it more flexible.
In this example, there are four items that we can change.
First is the items to rank. We won’t be ranking locations all the time. In the future, we may want to rank customers, regions, products, and more.

Second is the measure used. Our current code ranks based on the Total sales but we may want to rank based on the averages, maximums, and minimums on our data.
Third is the number of elements we want to keep. We may need to get the top 3, top 4, top 10, and so on.
Last is the order which is currently set as DESC. In the future, we may want to rank our data in ascending order instead of descending.

Let’s copy this DAX code and go back to Quick Measures Pro.
Top N In Power BI: Setting Up The New Measure
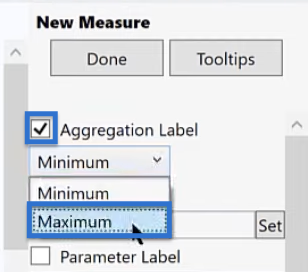
In our New Measure, start by creating an aggregation label. Tick the box beside the Aggregation Label and choose Maximum in the dropdown options to avoid having a naked column.
Enable the Column Label and rename it to Items to Rank. Click Set, then choose the item we want to rank, which in this case is City. Then click OK.

We’ll do the same for the Parameter. Click the checkbox beside it and rename it as Number of Items to Rank. Input the default parameter that you want to use. In this example, input 5.

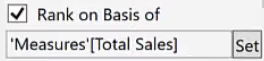
Then, we’ll need another aggregation label. Tick the box beside Aggregation 1 Label to enable it.


In this instance, tag it as Rank on the Basis of, which we will use as our measure. Then, choose Total Sales from the list of variables.
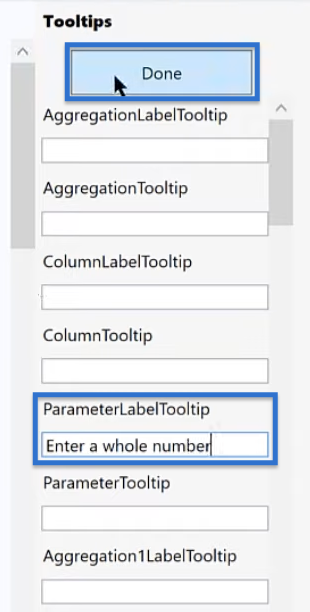
Now that we are done setting that up, we can now go to Tooltips.

In the Tooltip, input the instructions that we want for the different labels we created.
In the ParameterLabelTooltip, we can instruct it to enter whole numbers only.
Once finished encoding the instructions, click Done.
Our New Measure is ready at this point, so we can click Done.

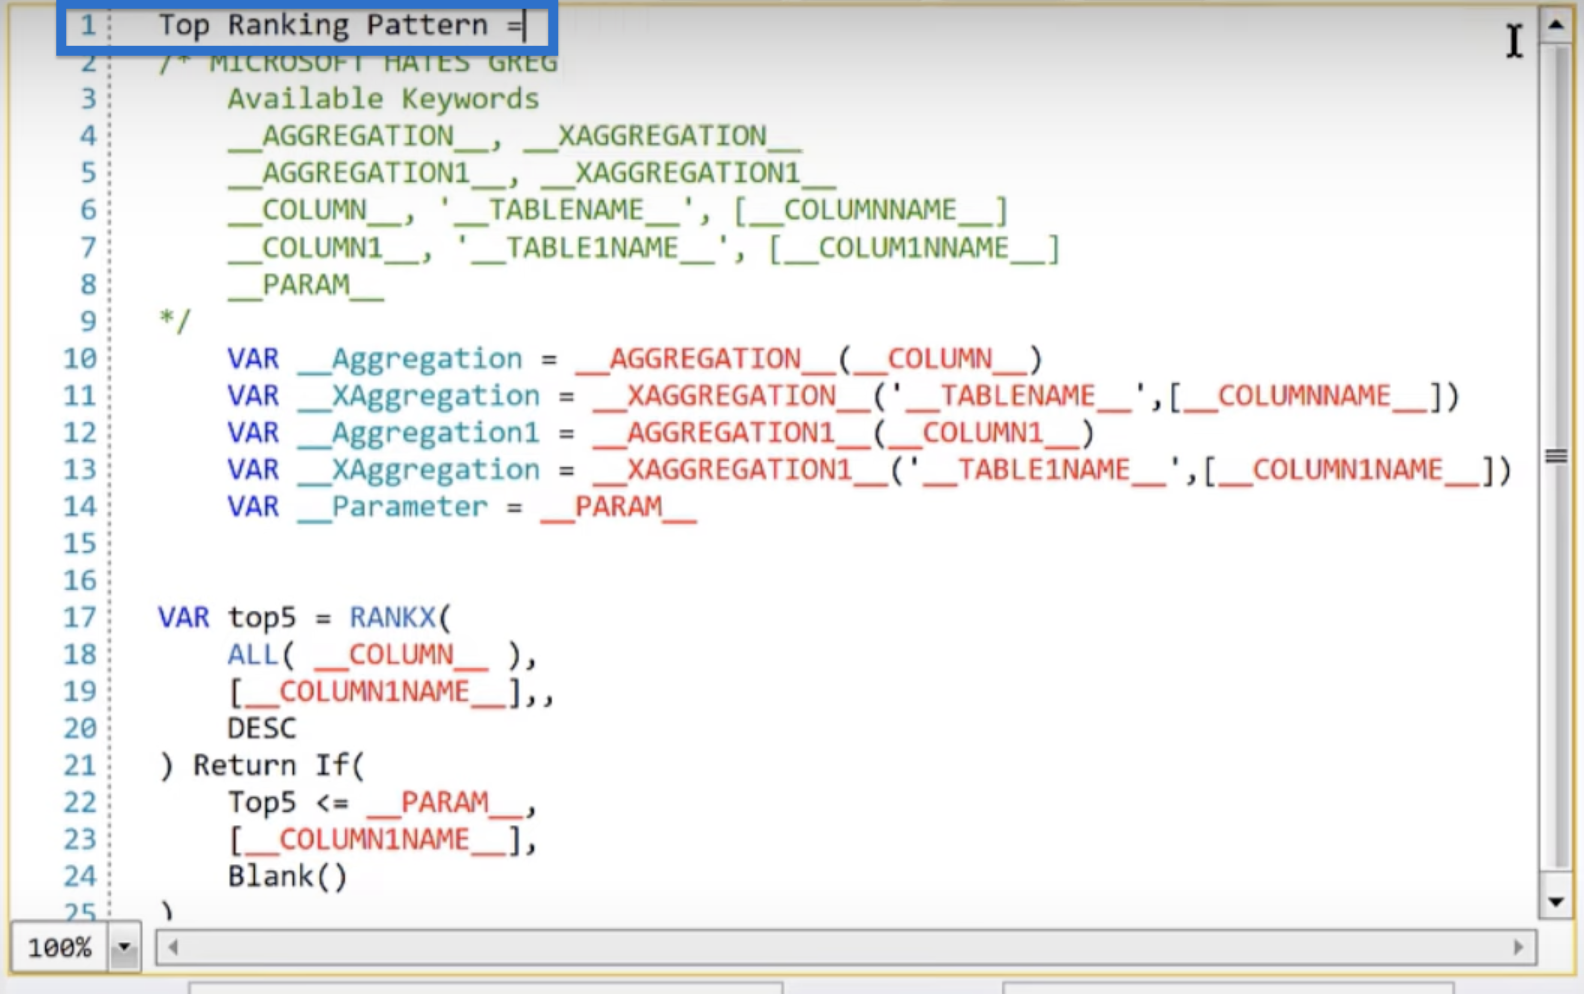
Top N In Power BI: The Custom Variables
We can then proceed customizing the code.
After we properly set up our New Measure, the interface gives us the keywords to use in ranking and setting up our variables.
But instead of using these variables, we will customize it by copying the DAX code earlier.
Delete RETURN and #QMPRO in lines 15 and 16, respectively, and paste the DAX code.
We can then customize the code.
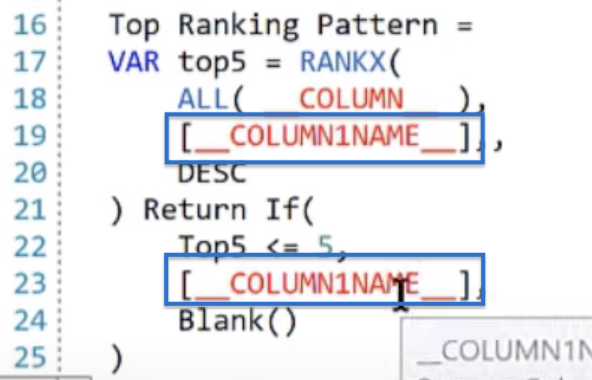
Start with the items to rank. Replace Locations [location city] with _COLUMN_, taken from the list of variables above.

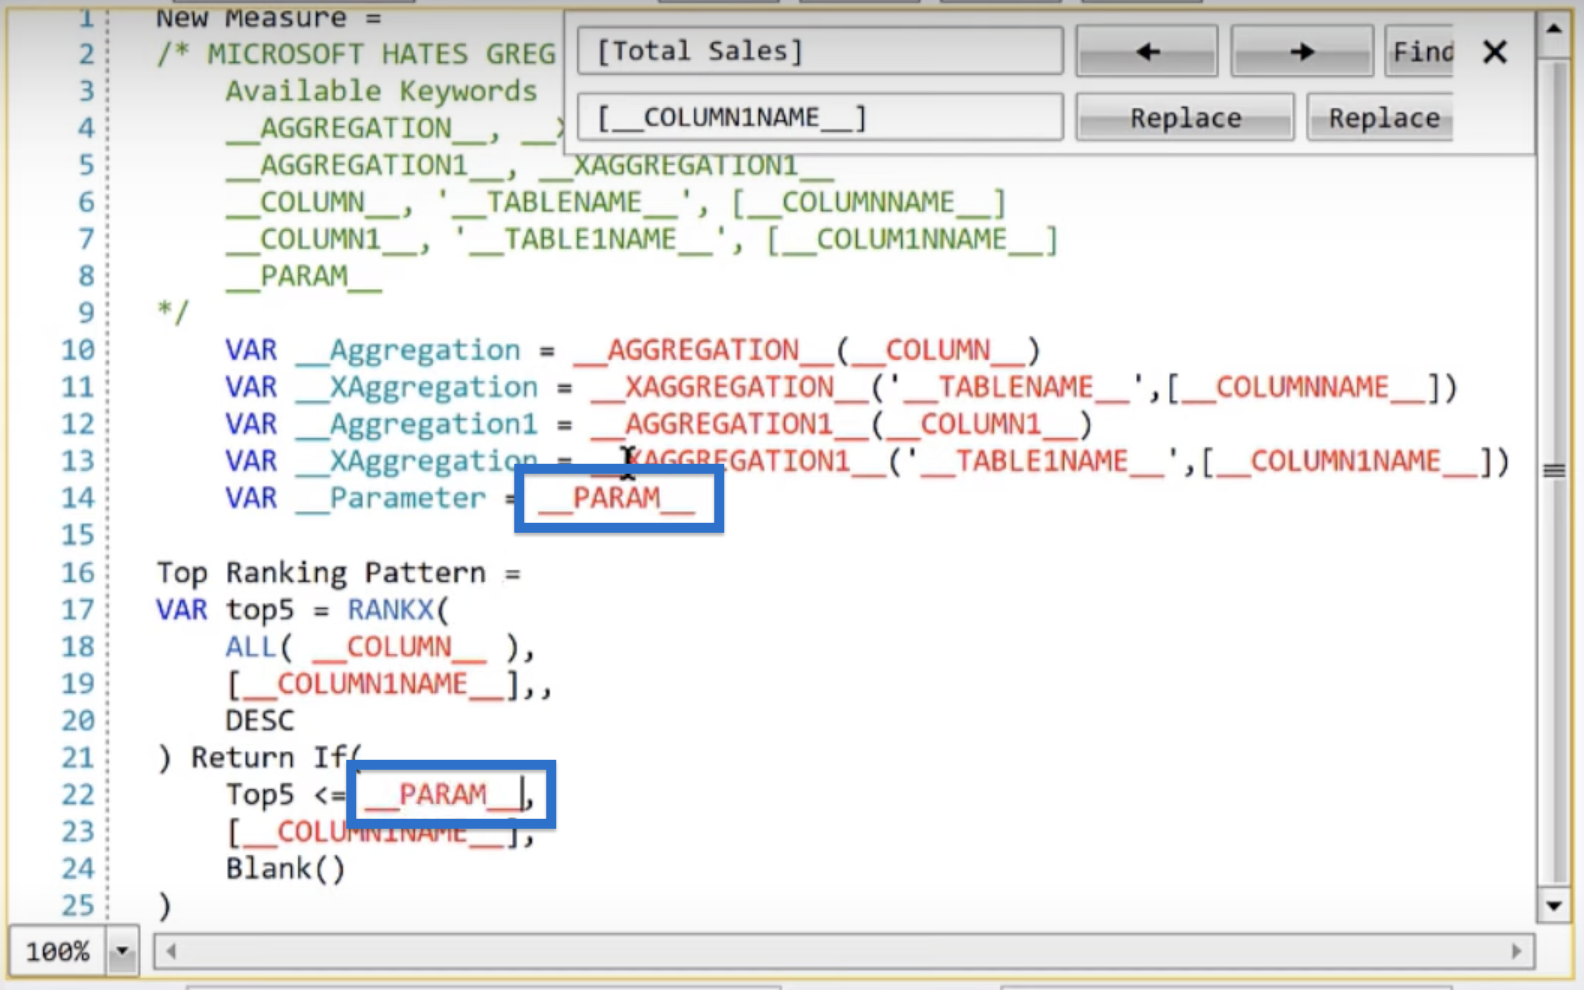
We’ll replace the Total Sales measure next. We can either replace that manually or use the find and replace feature made by Greg Deckler.
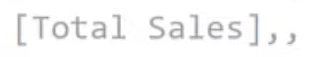
To use this feature, click Find. Type the variable to replace in the first text field, which is [Total Sales] in our case.
In the second text field, put the variable we want [Total Sales] to be replaced with. Let’s put [_COLUMN1NAME_].
Click Replace All to replace all [Total Sales] with the new variable.
Finally, let’s replace 5 with __PARAM__ as shown below.
After editing the code, the next step is to clean our new measure. We want it to look clean since this will be a permanent measure in our file.
Start by taking the measure name, “Top Ranking Pattern”, from line 16 to line 1.
Then, set our last variable as the result we want to return. To do that, follow the code below.


If we click the DAX button, we should see our code replaced with the proper variables.


This is exactly the DAX code we want to see if we did the previous steps correctly. If we want to revert back to the raw code, simply click RAW.
To further clean our code, remove the list of variables from lines 10 to 14.

We can also take the keywords from lines 2 to 9. In this case, we’ll just leave them so we’ll have them available in case we need to modify the code in the future.

The next step is to update the metadata. In the Description, let’s write “Keeps top N items based on user selections” as shown below. We can also put our measures in folders or hide them for any reason.

After editing the metadata, click Create Custom.

A pop-up window saying Measure definition created. Click OK.

In Quick Measures Pro, a Top Ranking Pattern option should appear under the Custom section.

We can change the variables for the Aggregation Label, Items to Rank, Number of Items to Rank, Aggregation1 Label, and Rank on the Basis of.
After setting up the parameters, click DAX to open the code. Then, shorten line 1 from Average Sales Top Ranking Pattern Measure to “Avg Sales Top N Ranking“. Click Create once done.

A window saying Measure Avg Sales Top N Ranking created successfully in Measures. Click OK.
Custom Measure In Power BI
If we go back to Power BI, our new measure should show up in the Fields pane.

Click on it to open the Avg Sales Top N Ranking measure that is set up exactly the way we specified in our quick measure.
Let’s say we want to create a bar chart. To do that, click the bar chart icon under Visualizations > Build visual. Drag the new measure from the Fields pane to the X-axis, and Customer name for the Y-axis.

It should filter our top 7 customers based on the average sales.

Modifying The Custom Measure
Let’s try modifying our custom measure. This time, let’s take the top 5 products based on the total sales.
To do that, go back to Quick Measures Pro. Set the Aggregation Label to Sum and choose Product Name to rank. Then, opt for the top 5 items and rank based on Total Sales.
Shorten the first line to “Product Name Top Ranking Total Sales”. Click Create then OK in the pop-up window.

In the ribbon under Measure tools, set the Name as Product Name Top Ranking Total Sales and choose Measures for the Home Table.

Drag Product Name Top Ranking to the X-axis and Product Name to the Y-axis. This will give us the bar chart with our top 5 products.

***** Related Links *****
Create Quick Measure In Power BI With Quick Measures Pro
Pros & Cons of Quick Measures In Power BI
Quick Measures Power BI: Year-To-Date Total Calculation
Conclusion
In conclusion, creating a custom top N ranking measure with Quick Measures Pro is a powerful tool for analyzing and visualizing data in Power BI. By following the steps outlined in this tutorial, you can easily create a measure that ranks items in a specific category, allowing you to quickly identify the top performers and make more informed decisions.
Remember to test your measure and make adjustments as needed to ensure that it is providing the most accurate and relevant information. With Quick Measures Pro, the possibilities are endless, and you can continue to explore and refine your analysis to uncover valuable insights into your data.
All the best,
Brian Julius


