In this Power BI Showcase, we’re going to review reports on foreign exchange risk management. This is a relatively complex area dealt by many global businesses. You may watch the full video of this tutorial at the bottom of this blog.
The ability of a firm to perform effective foreign exchange risk management depends on a number of factors.
These could be due to the currencies they’re exposed to, the appetite to hedge their exposures, the time frames on when they manage their exposures, and other forms of compliance auditing.
The six reports in this showcase will present how a relatively complex corporate topic can be made extremely intuitive.
Foreign Exchange Hedging Profile
The first report shows the hedging profile.
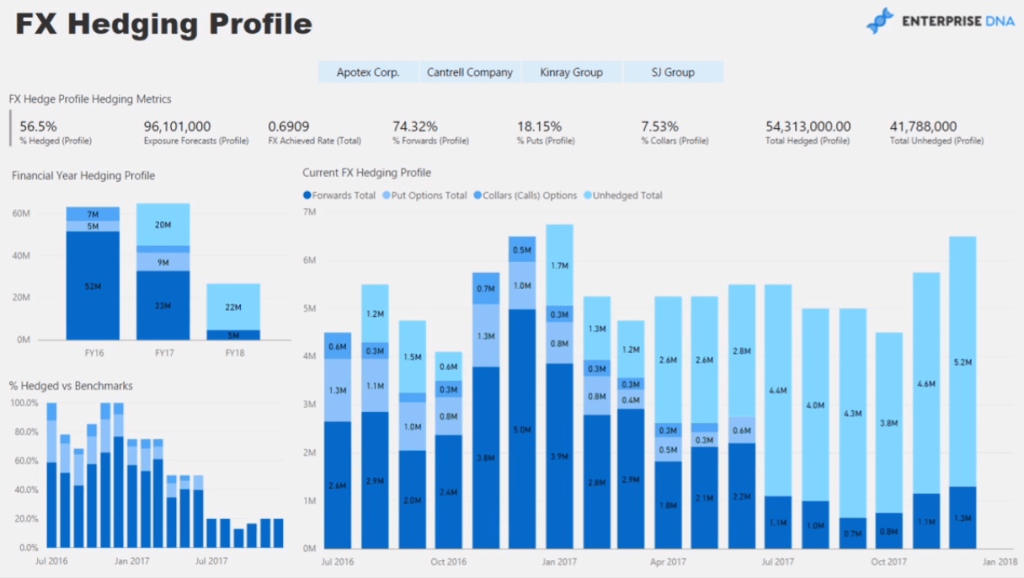
This example is about an importing organization based in New Zealand which has four different subsidiaries:

By clicking on a subsidiary, we can customize the data in the report specific to the selection made.
The foreign exchange hedging profile shows how an organization can set a benchmark level based on future forecasts or purchases using a specific currency, such as US Dollars. And throughout time, the company can continuously hedge their benchmark.
For instance, by looking at the subsidiary, Cantrell Company, we can see a summary of their data by financial year.
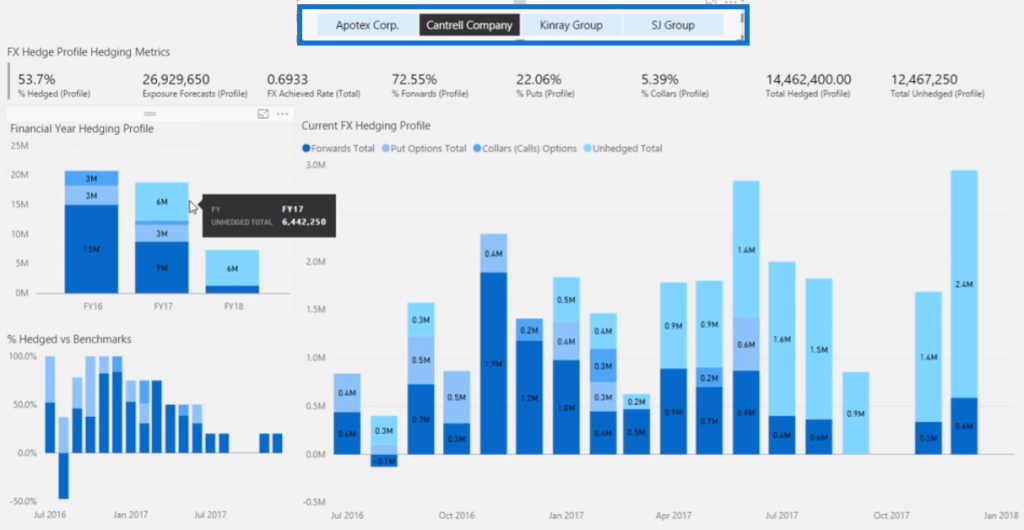
The metrics we want to look at automatically updates.
We can see how much we’ve hedged based on our forecasting, what the exchange rate will be, and how this compares to the market.
Furthermore, the information shown for this subsidiary can be narrowed down to a specific financial year.
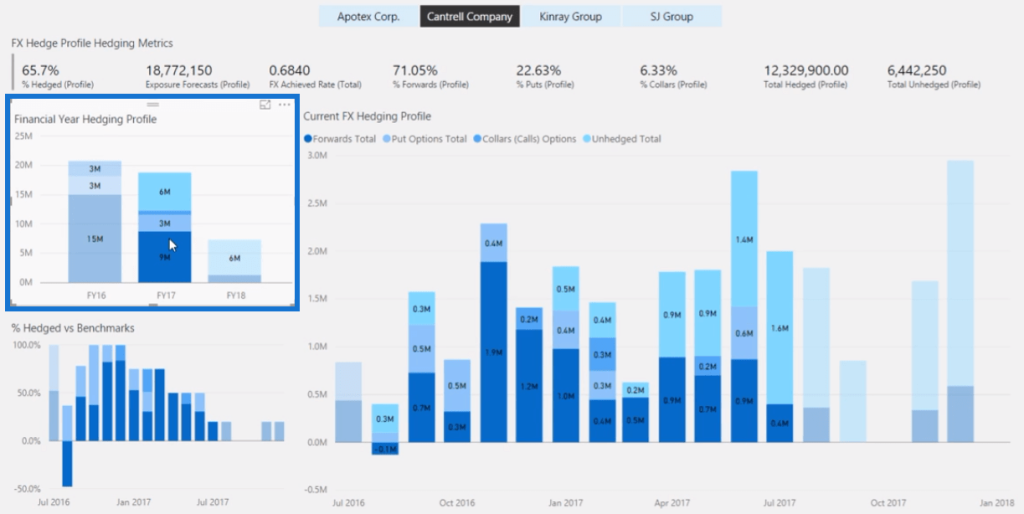
We can see the potential Total Cost in New Zealand Dollars based on the forecasted exchange rate for this financial year.
Thus, the insights and mobility we get out of this report make the executive-level decisions easier.
We can further utilize the data we get from this report and build a scenario analysis around increases and decreases in the forecast or purchases.
Hedging Analysis
The next report focuses on hedging analysis.
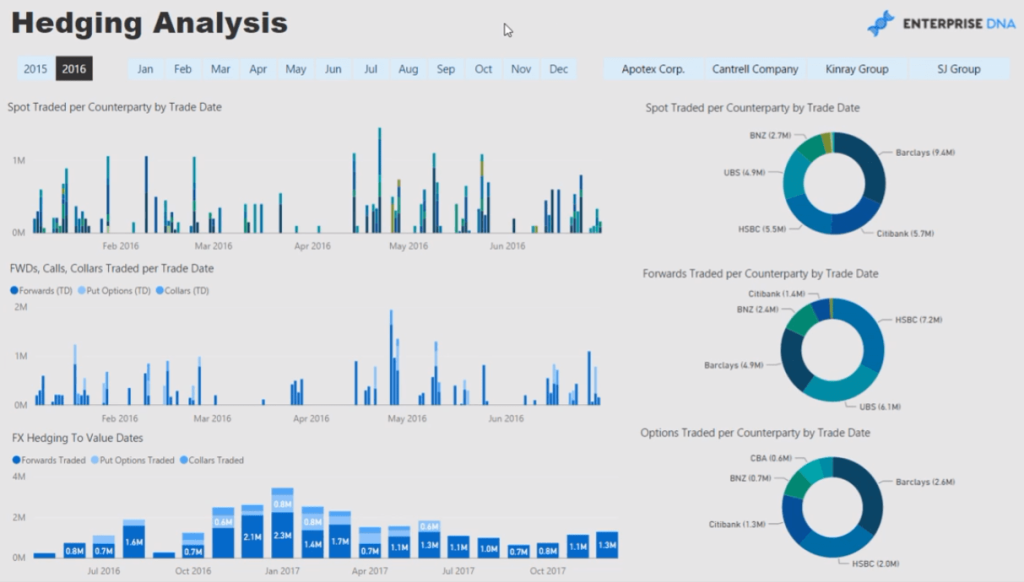
This presentation enables us to view when trades were done and with whom by narrowing the information into any of the key counterparties we have.
Similar to the previous report, we can dive into each subsidiary and specific month using the filters.

The filters make it easy to flip between different data. They make it easier to compare our trading rate to the actual exchange rate data in the market.
Foreign Exchange Hedging Achieved Rates
The third report shows the information on the rates we’ve achieved through hedging.
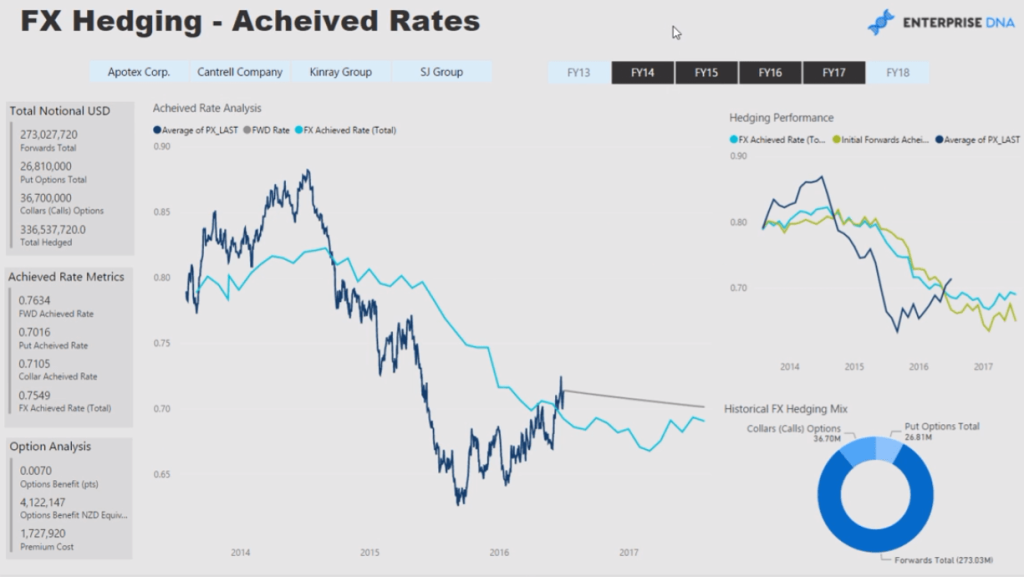
This is a great tool for getting a better picture of the company’s historical performance and how much will be achieved in the future through hedging.
We can present this information to the head office and then provide tips to the subsidiaries on how to improve their achieved rate metrics.
Hedge Timing Analysis
The fourth report in this showcase provides an analysis of the timing and appropriateness of when hedges were made.
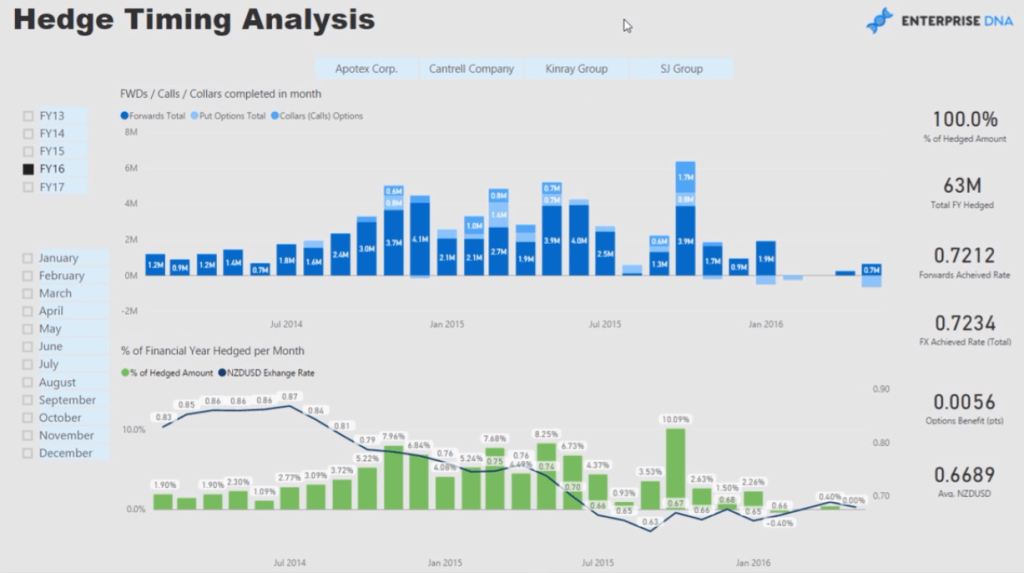
We can dive into the granular details of the selections on the filters.

It’s important to understand and analyze the timing of when hedges were made.
When we get to a specific period, we may want to look back and see how the exchange rate fared at that time.
Counterparty Analysis
This report dives into the counterparties we’re trading with.
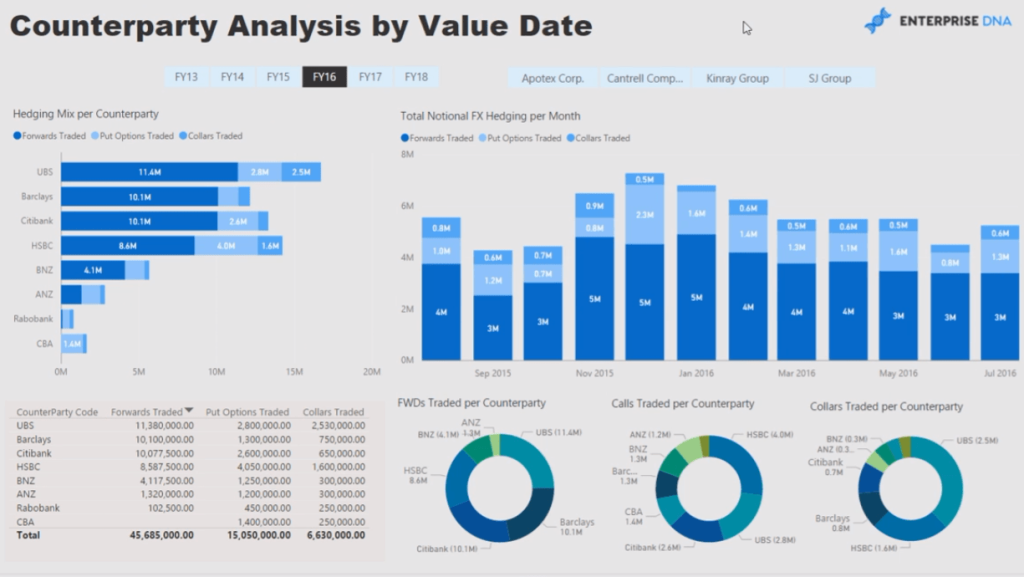
With this, we can analyze the reason why we’re trading with some counterparties more than others.
The reason could be better pricing or a highly relationship-driven partnership, among many others.
Again, we can see how the data changes through time and between subsidiaries through the filters embedded in the report.

Some of these subsidiaries might be offshore so they may be trading with different types of parties compared to what we encounter within our local currency.
Counterparty Credit Risk
The last report in this showcase is crucial when it comes to foreign exchange.
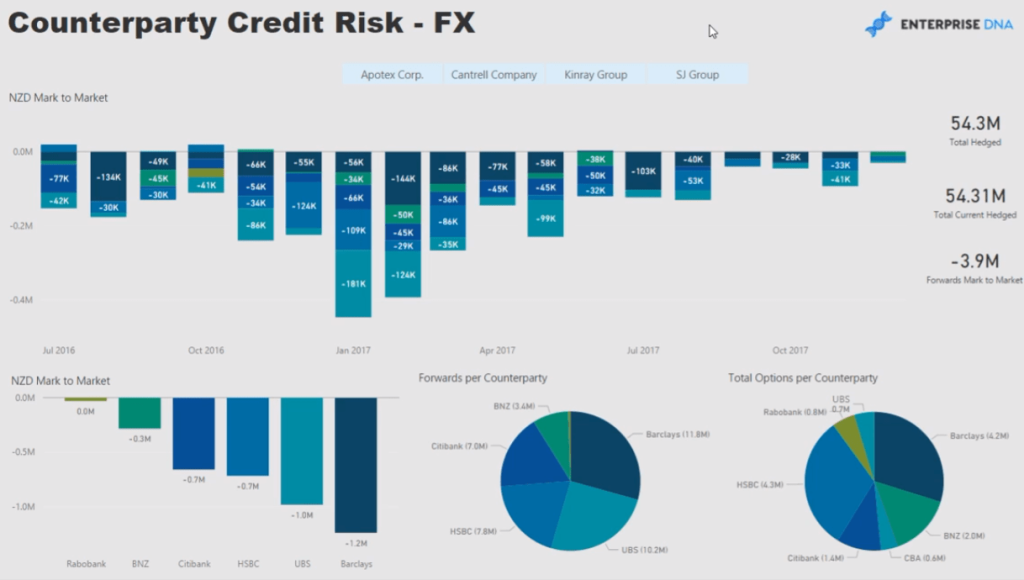
Counterparty credit risk is something that ideally needs to be analyzed on a live basis.
We need to understand our exposure to our counterparties, banks, and brokers. If that exposure gets too large over a certain time frame, we want to make sure that we can reduce it.
Again, the filters make it easy to navigate between different subsidiary exposures.
This source of live information and analysis is going to place the organization in a much better position to manage its financial risk.
***** Related Links *****
Multiple Currency Logic In Power BI – A LOOKUPVALUE Example
How To Download Exchange Rates In Power BI
Power BI Exchange Rates: An Update To Multiple Currencies Management
Conclusion
This Power BI Showcase demonstrates how consolidating all the information into one packaged report can add enormous value to the finance operation of an organization.
The ability of these reports to extract huge amounts of information, from both local and global markets, enables an organization to gain real-time analysis on their position within the foreign exchange market.
This is quite revolutionary in terms of financial functions for foreign exchange risk management.
All the best,
Sam
[youtube https://www.youtube.com/watch?v=UP0Fc8I_LDc&feature=youtu.be?rel=0&w=784&h=441]


