If you want to have a real-world example scenario of forecasting using Power BI, you’re in the right page. You’ll find in this tutorial a forecasting technique that you can surely implement in your own work environment. You may watch the full video of this tutorial at the bottom of this blog.
In the example, I compare my actual results to my forecasts and look at them cumulatively. The cumulative totals give me a much better overview and ensure me that I’ll know when a trend is appearing. If you use the forecasting technique I discuss in this tutorial, you’ll be able to achieve the same thing.
First though, you need to create the actual forecast. You may have this in a separate data source or spreadsheet, or you may need to create it because you don’t have one yet. There’s plenty of ways you can create it – sometimes it’s simple, and sometimes, in my opinion, it’s more complex than it needs to be.

Once you have that set up, developing some simple logic and utilizing formulas with DAX can really give you insights into your data.
Reviewing actual results by themselves is fine, but in many instances, you need a benchmark to really show the relative performance.
Unless you have a thorough understanding of numbers, using a benchmark or forecast (as in this case) is the best way to show this for your consumers.
Moreover, by using the other filters in your data model, you can set up your reports to dive into specific areas of your data sets effectively and see how the results have performed versus the unique benchmark. Sometimes there are a few nuances to understand, but this is another tutorial.
Creating A Forecast
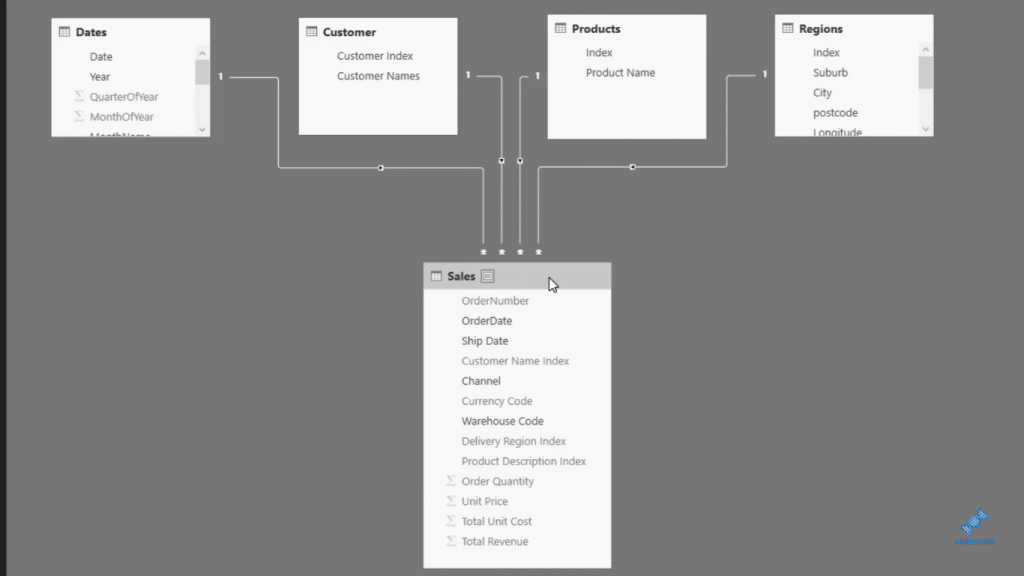
We have a simple data model here with Total Sales, which is just historical information, so we need to create a forecast. There are many ways to do this, but I’ll show you how to create a simple one.
In this demonstration, I’m going to project what we’ve achieved in 2015 to 2016. I use CALCULATE with Total Sales, and then go SAMEPERIODLASTYEAR and put in Dates.

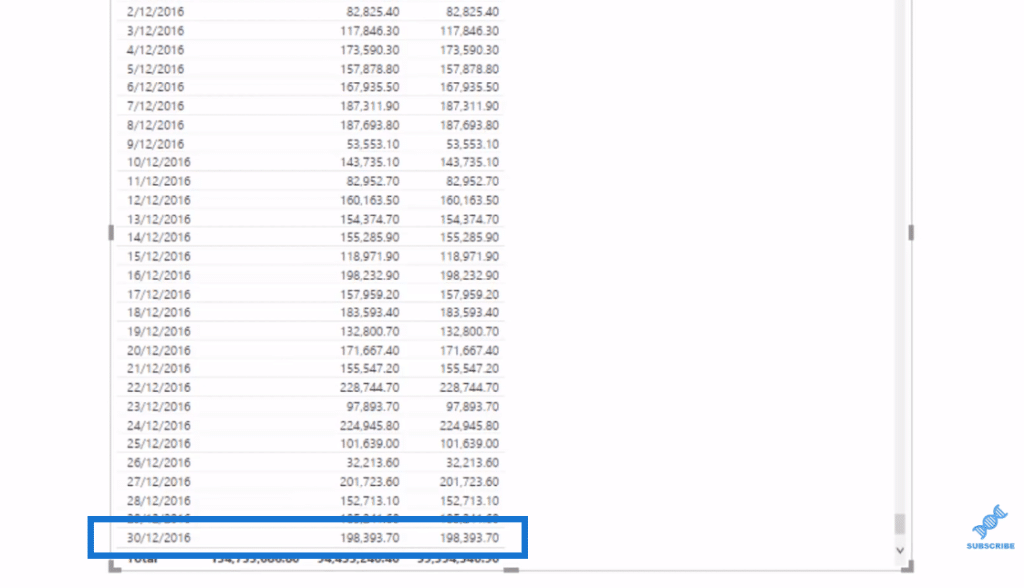
This is going to give us the sales last year. We can see that in our table here that the first data inputted was on the 1st of June 2014.

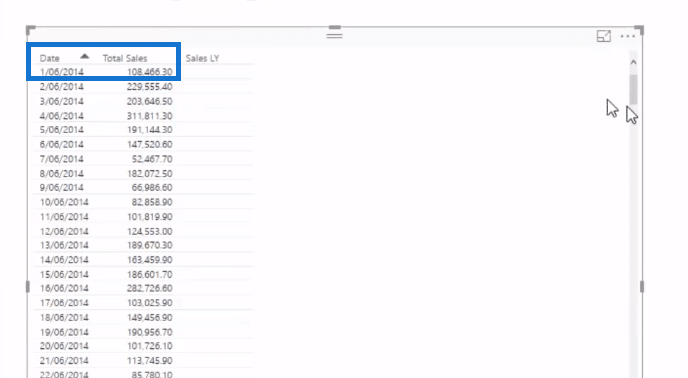
Now it’s reflected in our 2015 (the sales last year total).
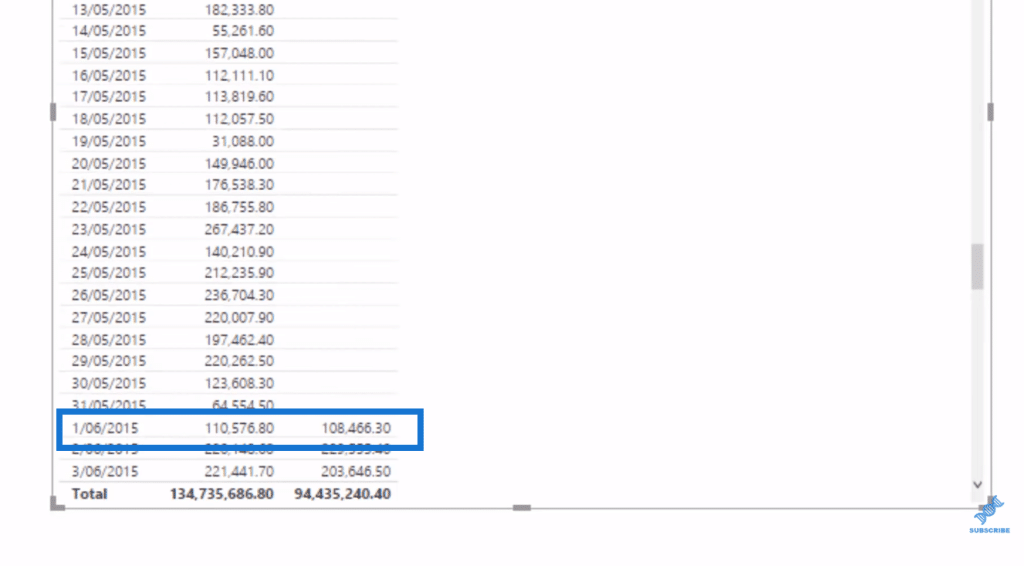
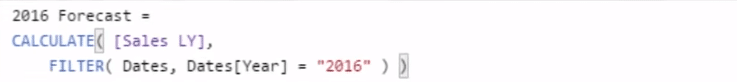
However, we need to go one step further. We want to forecast 2016, so we’ll have our data start from January 2016, and then go for the entire year. To do that, we change the context of the calculation (using CALCULATE), but we’re filtering out information that isn’t in 2016 (with a FILTER statement). And so we filter the Dates table where the year is equal to 2016.
This is literally going to get rid of or blank out any date that is not 2016 for this forecast. Let’s drag it into our table and we’ll see that our data starts from January 2016.

We now have 2016 forecast.
When we show it on a chart, we can see our Total Sales by day and our Sales Forecast, which is just a projection of the year before.

Working Out The Cumulative Forecast
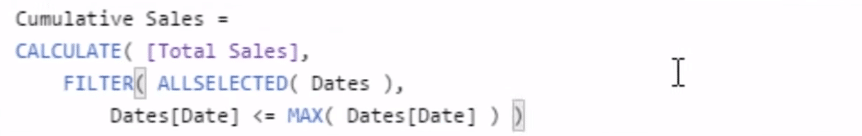
Now we’re going to turn these into cumulative totals and we’re going to look at these cumulatively, which enables us to get better insights. The first thing we need to do is calculate Cumulative Sales.
We can then reuse this to work out our Cumulative 2016 Forecast. All we need to do is sub-in the Total Sales with 2016 Forecast.
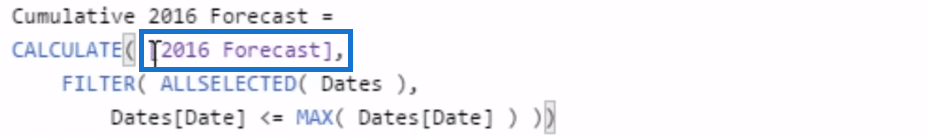
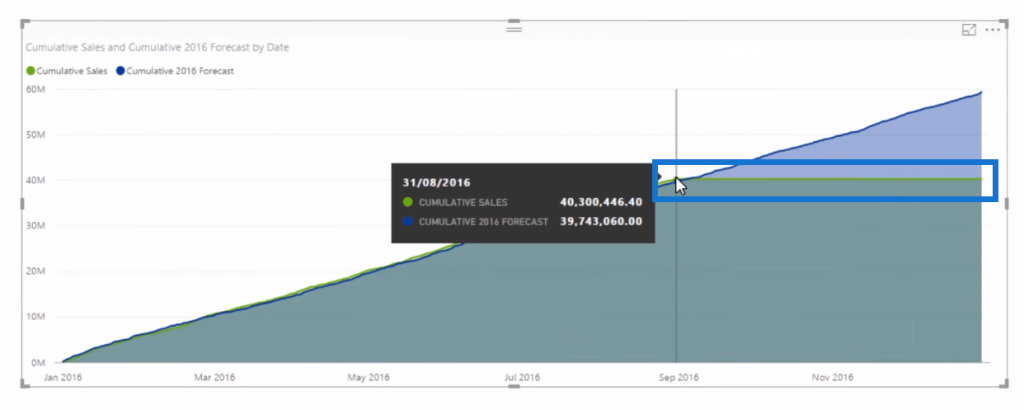
Now we have the cumulative total of the 2016 Forecast, which is just the projected 2015 results. We’ve turned them into a cumulative total, which we can compare to our Cumulative Sales of this year.
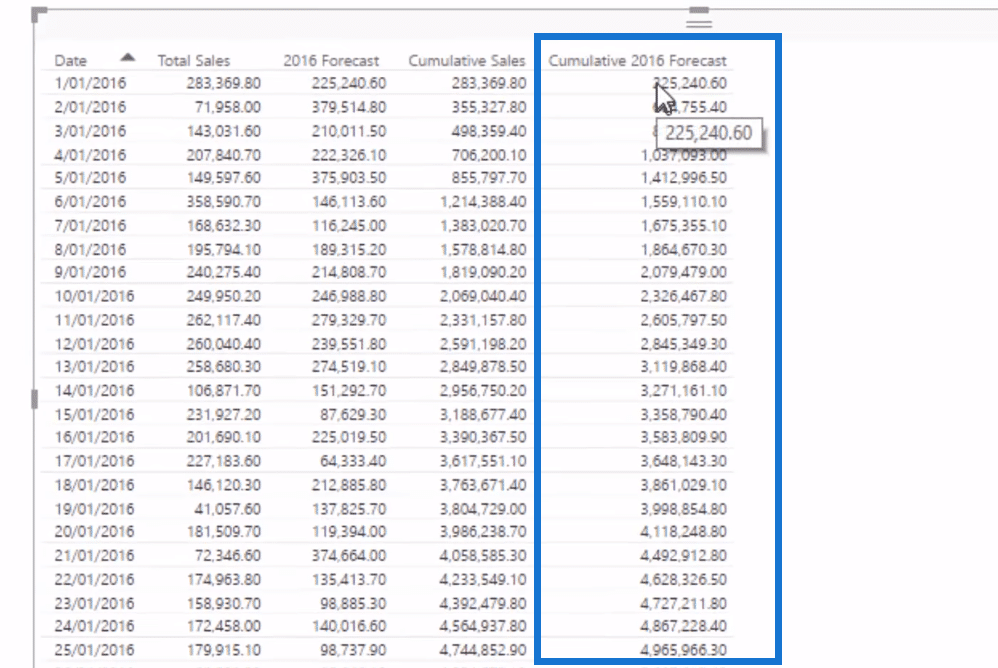
We can turn this into a visualization and be able to analyze this information on how we’re going cumulatively. There’s a little bit of an issue here wherein the cumulative total is projected all the way, even though there’s no information and we probably don’t want that.
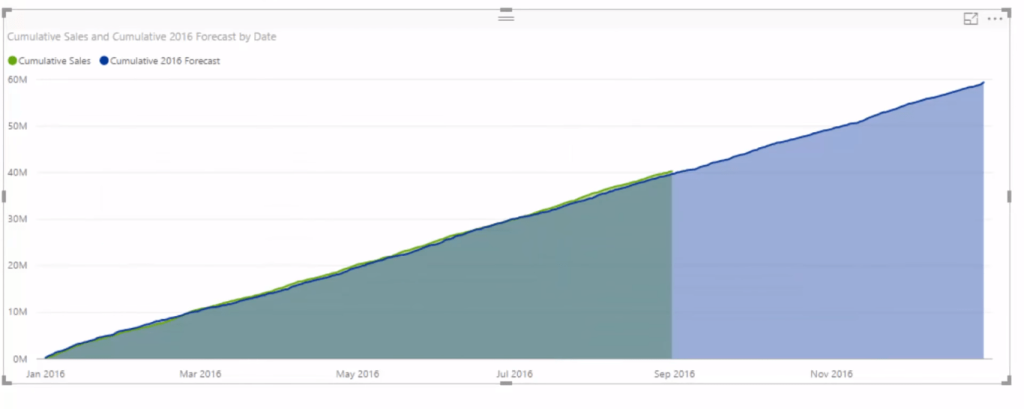
We can fix it very easily by adding IF ISBLANK in our formula. So if there’s literally no sales on that day, this will return BLANK. This is going to get rid of all information that is forward from a particular date.
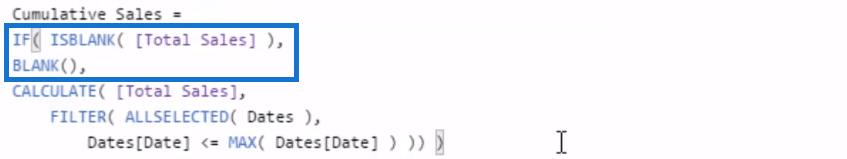
We push Enter, and we’ll see in our chart that the line disappears, as we’re overlaying our current sales versus our sales forecast.
Forecast Versus Sales
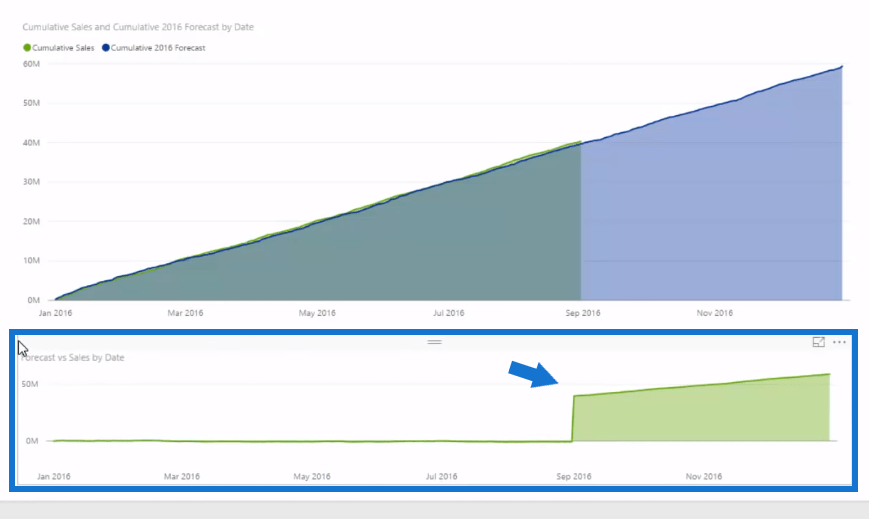
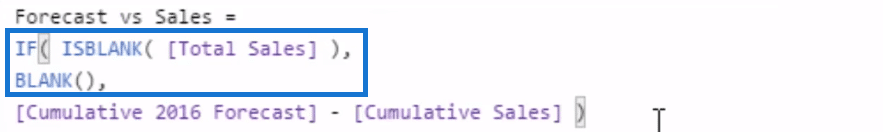
From here, we can compute our Sales versus our Forecast through measure branching.

And we could turn this into a visualization alone, but it doesn’t really generate any insight for us at the moment because we have no data from September to December and it’s just taking it as zero.
We can fix this again by putting in that ISBLANK logic.
And with that, we can now see how we’re going through time versus our cumulative forecast.


Furthermore, since this is connected in the data model, we can bring in our Products, for instance. We turn it into a slicer and see how we’re going on each of our products.

We can dynamically select all our products and see how they’re tracking.
***** Related Links*****
Forecasting Analysis Techniques In Power BI With DAX
Creating Forward Forecasts In Power BI Using DAX
Create A New Table In Power BI: How To Implement Budgets & Forecasts Automatically Using DAX
Conclusion
This is a unique forecasting technique that I have demonstrated in this tutorial. First, we created a forecast, we kept it pretty simple, and then we used a cumulative total to visualize it better. After that, we compared it and were able to track through time and see how all the sales were going.
It’s all about the business applications with this. I actually cover a lot of similar applications around forecasting in my Solving Analytical Scenarios virtual course. This is worth checking out if you want to learn more about the forecasting technique, budgeting, segment and grouping techniques, and scenario analysis to name a few.
I hope you will be able to find a way of incorporating this forecasting technique into your own work.
All the best!
Sam
***** Learning Power BI? *****
FREE COURSE – Ultimate Beginners Guide To Power BI
FREE COURSE – Ultimate Beginners Guide To DAX
FREE – 60 Page DAX Reference Guide Download
FREE – Power BI Resources
Enterprise DNA Membership
Enterprise DNA Online
Enterprise DNA Events