In this Power BI Showcase, we’ll be focusing on financial information management reports for an enterprise involved in the global food distribution industry. You may watch the full video of this tutorial at the bottom of this blog.
The data set presented in the reports are common metrics received by an organization at the end of a financial year.
These financial metrics include Total Sales, Cost of Goods Sold, Gross Profits, Budgeted Sales, Variance to Budget, and Total Discounts.
This Showcase is broken down into three reports.
Revenue & Profitability Management
The first report page drills into the revenue and profitability of the business.
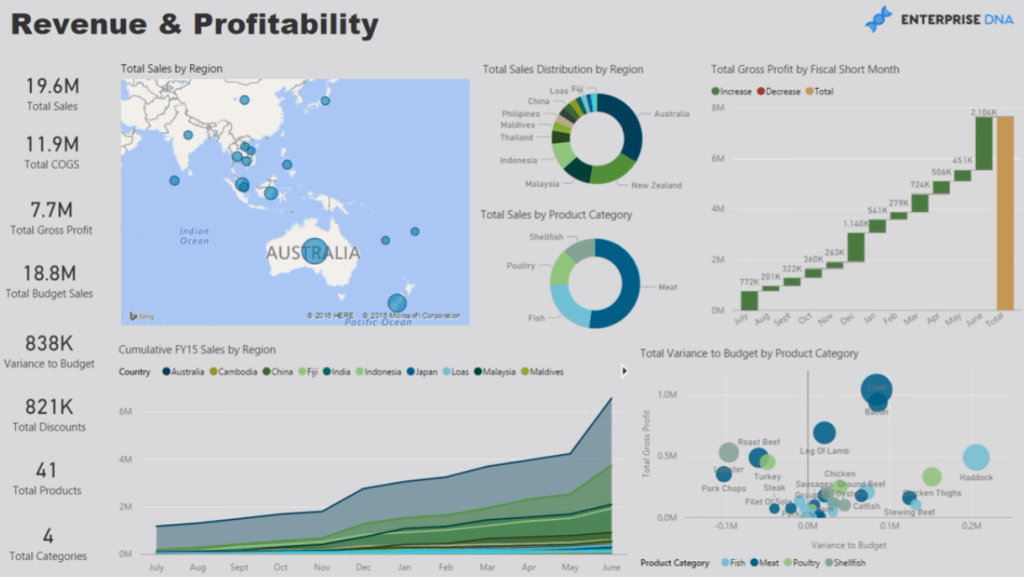
We can easily navigate around the key subsidiaries within the organization and see financial trends for a specific time period, product, or product category.
This allows us to build up the financial intelligence within the organization to optimize product allocation and sales team management.
The information in this report is also dynamic. If we want to look at details on the subsidiary in Indonesia, we can select the Total Sales Distribution by Regions chart.
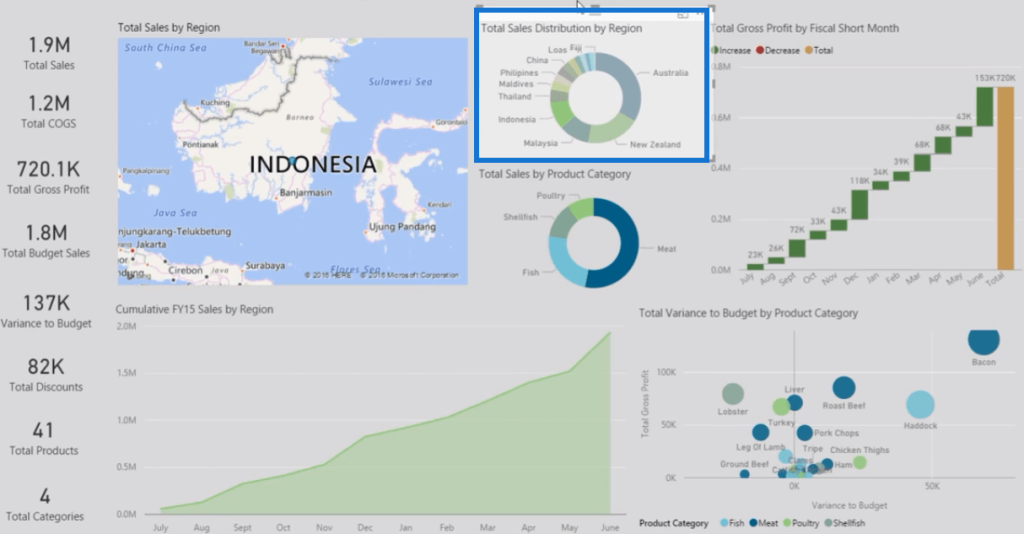
By making this selection, all the other key metrics in this report automatically update.
We can also look at our biggest selling entity in Australia.
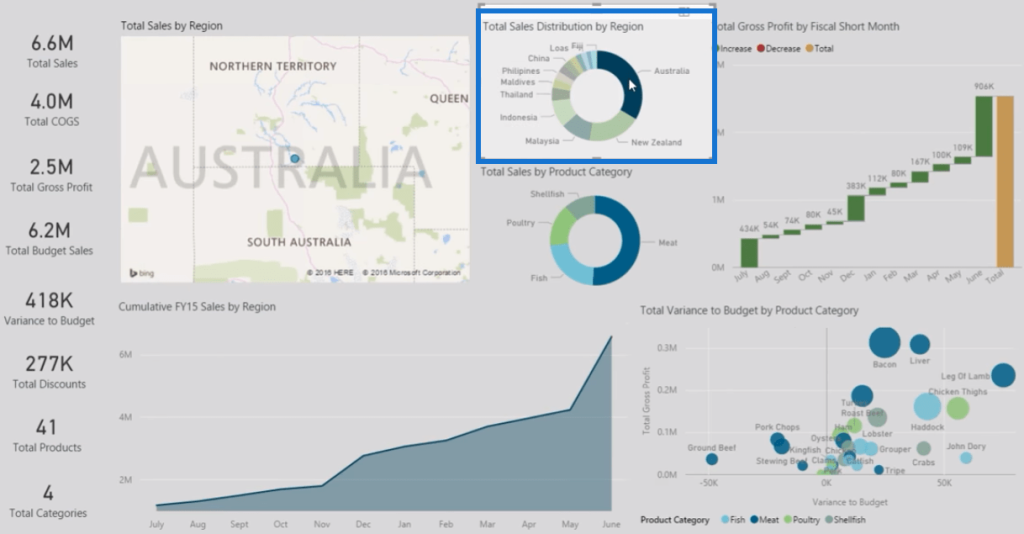
The chart in this report makes it easy to see how well our products have been selling in the Australian market.
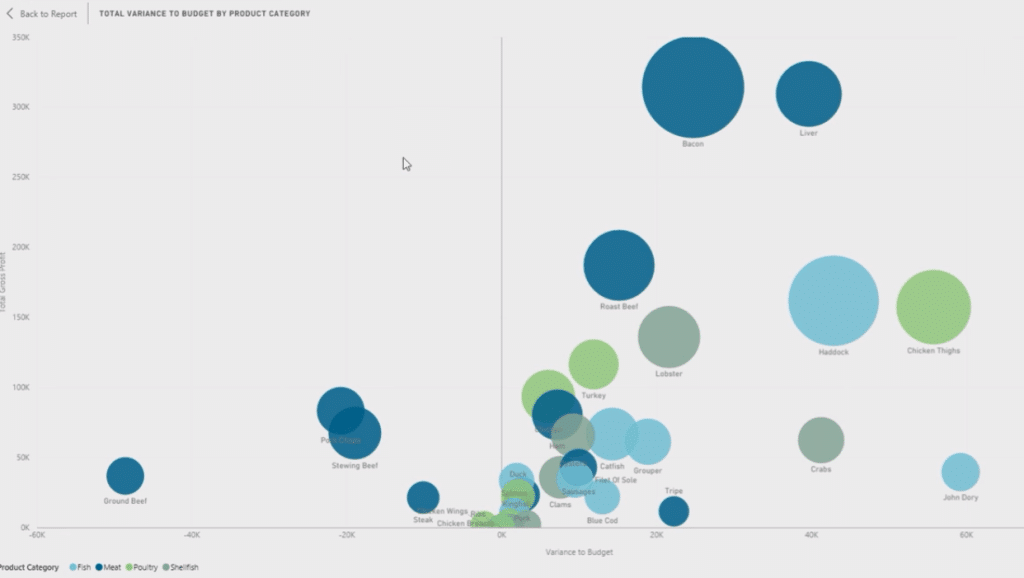
This is a great way to identify which products are selling well and in what location these high Sales are coming from.
Product Performance Breakdown
The next report page gives a breakdown of each product the company is selling globally.
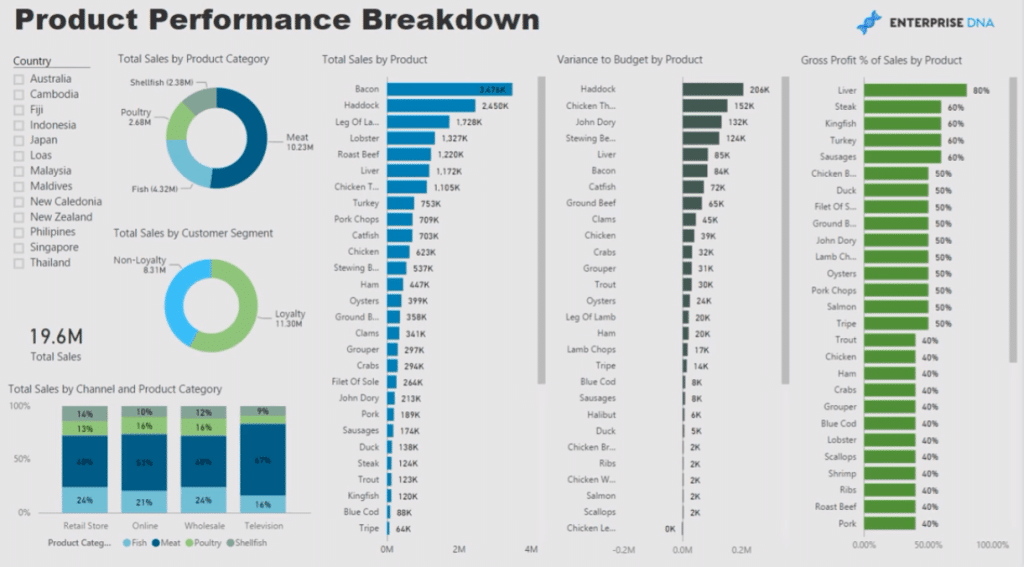
We can see the different category breakdowns by product. There’s Total Sales, Variance to Budget, and Gross Profit Margins.
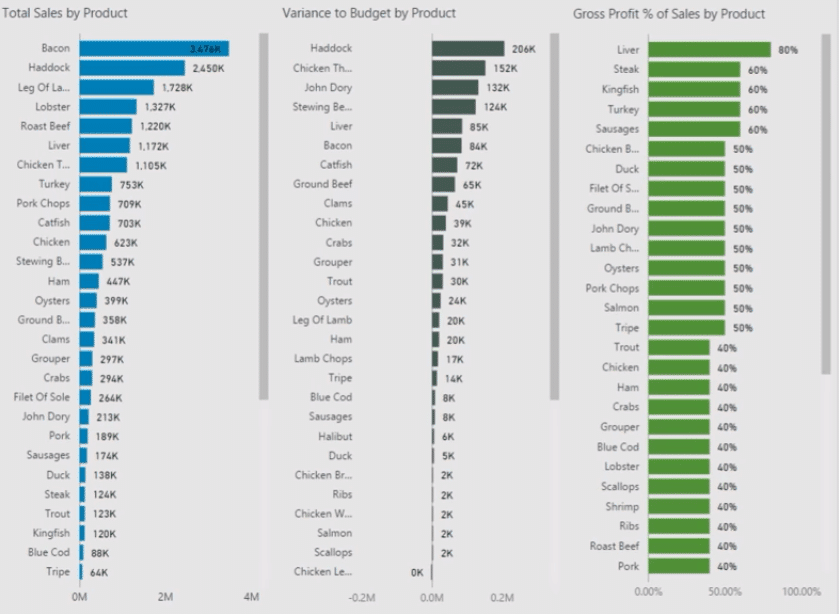
Gross Profit Margins are key in identifying why there’s a variance in Sales for different regions.
This helps in deciding where we want to potentially send more goods so we can obtain the highest Total Net Profit by the end of the financial year.
We can drill into a specific country, like Malaysia, and see which products are not performing well within that area.
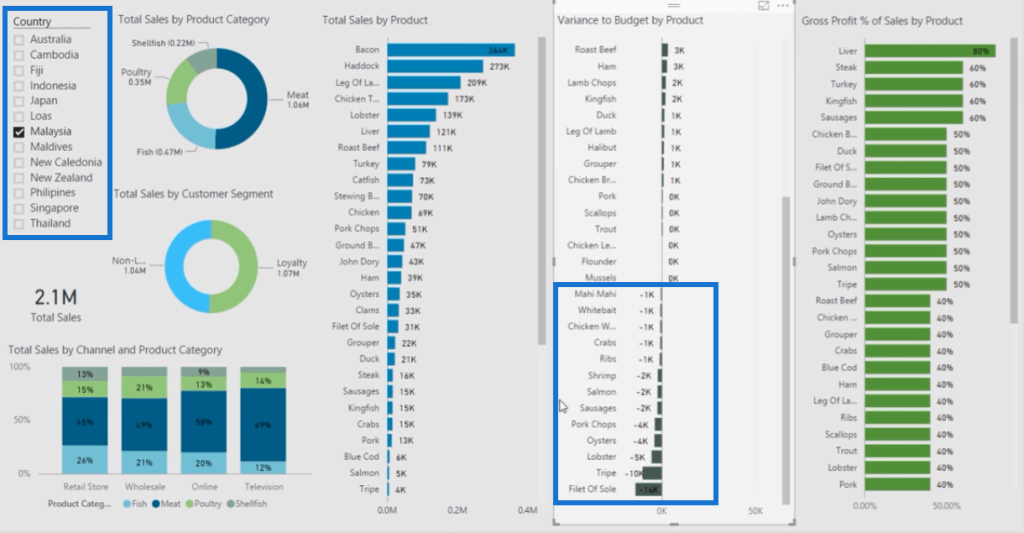
This gives us a better understanding as to why these trends or numbers are occurring.
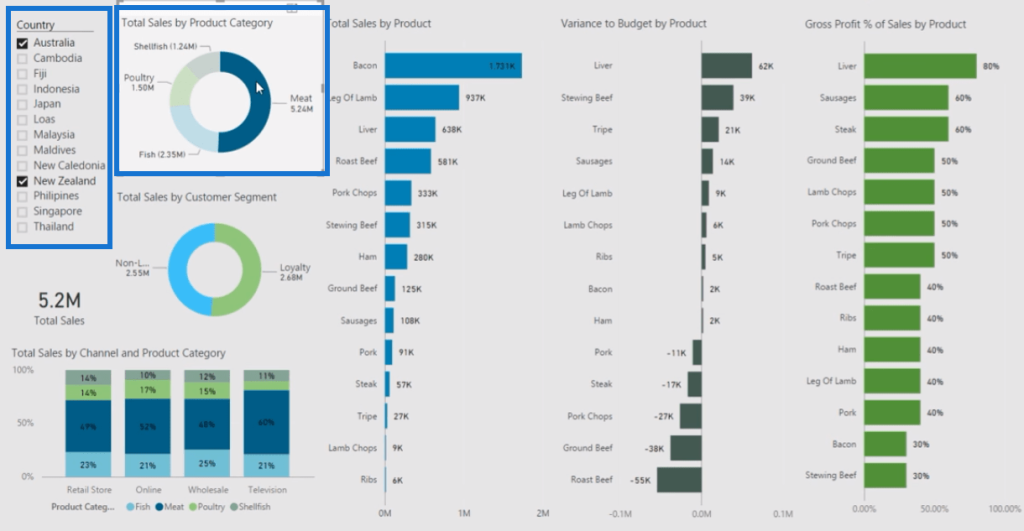
We can also multi-select countries and specific product categories. For instance, we can look at how our meat products are performing in Australia and New Zealand.
Channel & Customer Segments
Lastly, we have a report on our channel and customer segments’ financial information.
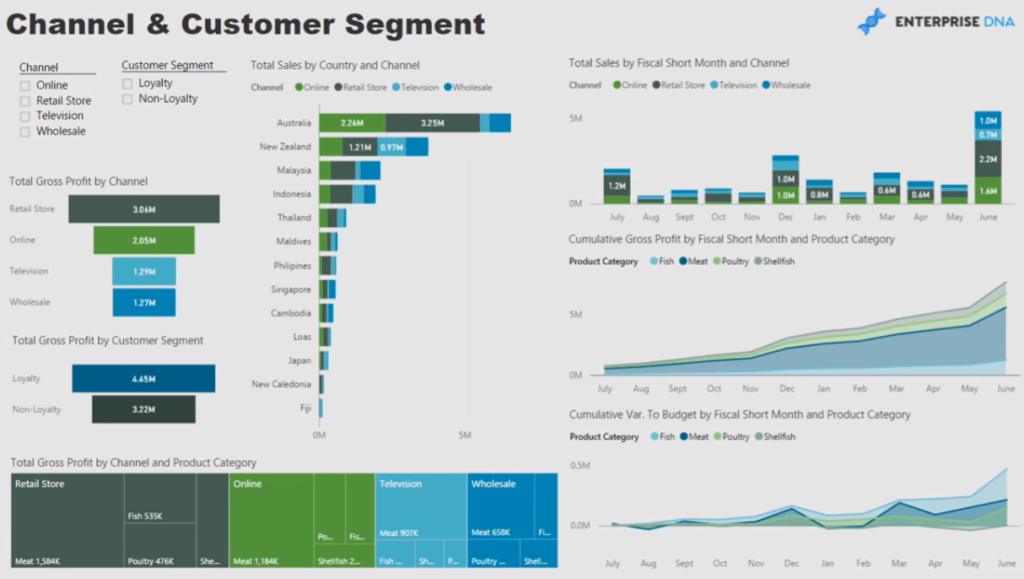
In this example, we have four channels and two customer segments:
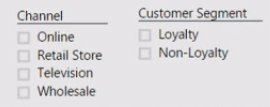
By clustering our financial information into these groups, we can easily identify which area we should place more focus on to make the most out of our Sales.
Let’s look at our Wholesale Channel:
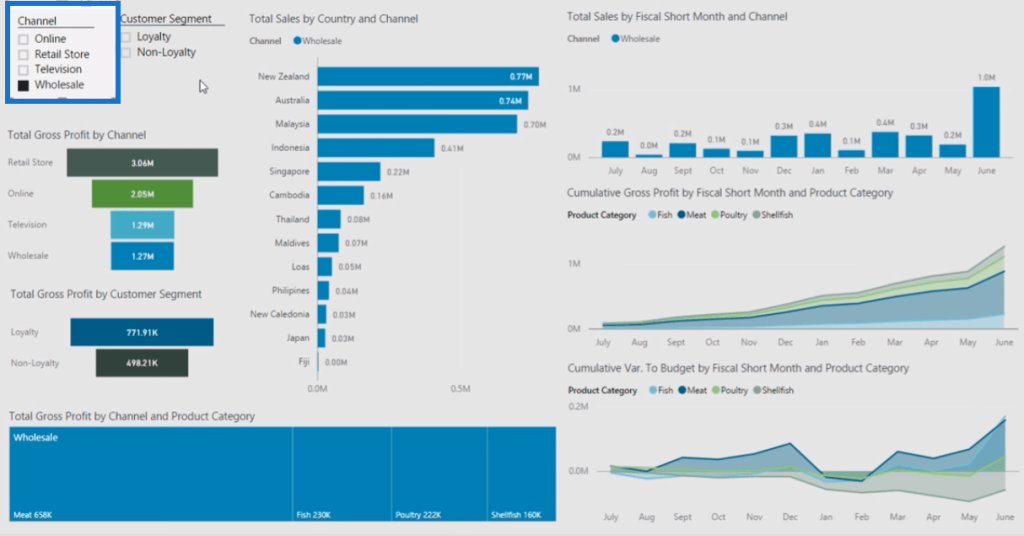
With this, we can easily see our cumulative financial information throughout the year.
In this chart, we can see that there’s a big dip in our Variance to Budget between the months January and February.
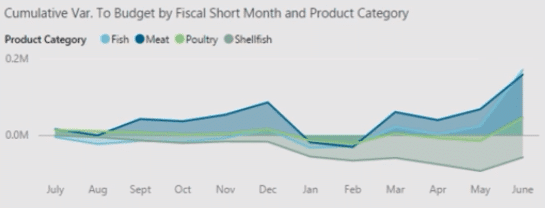
We can proceed to investigate why this has happened and then start creating strategies to ensure that this won’t happen in the future.
***** Related Links *****
Power BI Financial Reporting Tips And Techniques For Accounting & Finance
Creating Compelling Power BI Dashboards With High Quality Insights
Power BI Reporting Templates Expanded – Power BI Visualization Concepts
Conclusion
The reports presented in this Showcase offer great insights on financial information management.
This is a great help for businesses that want to optimize their Sales and product allocation.
Power BI is a great tool to use in financial analysis because it makes it easy to drill down into specific parts of our data set.
All the best,
Sam


