To ensure that we have a good story to tell, effective data storytelling by asking the right questions is the key.
In the previous tutorial, we discussed about the questions to ask in details we should pay attention to when starting to create a Power BI project. We now understand the needs, the context, the set up we analyzed, and the data performed.
As a result, we are comfortable enough with both the needs and the data we have. Also, we have a good idea of the end goal and the big picture of the report.
Now that we have all the pieces of the puzzle, how can we make sure that our story idea is sound?
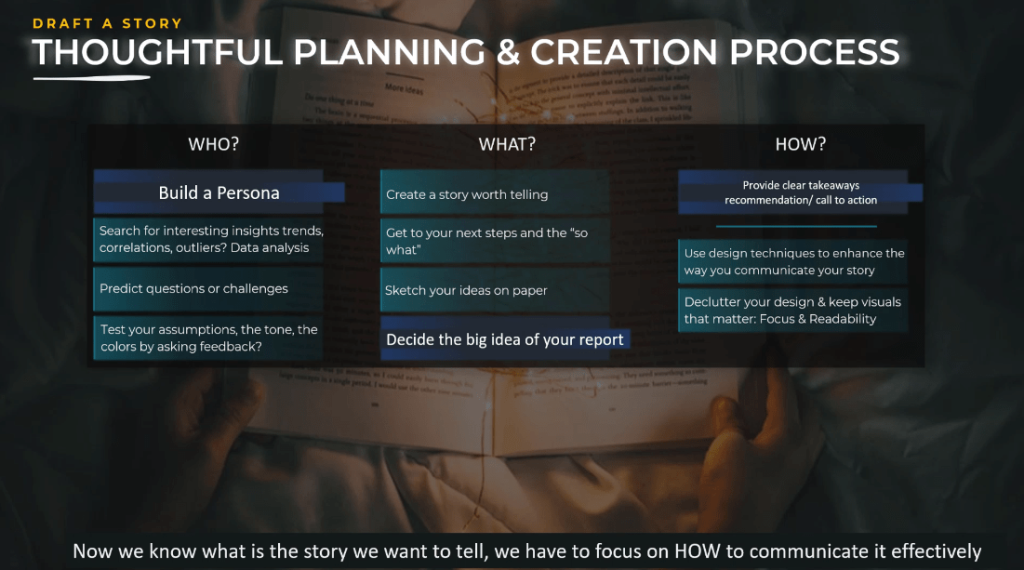
Let’s now talk about the last phase of preparation. In this phase, we will learn how to make sure we have a good story to tell. I divided the ideas into three main questions – Who, What, and How.
Effective Data Storytelling: Build A Persona
The first section is Who.
Making sure that we always have our audience’s insight is significant. We should never forget them and ensure we see the information through their eyes.
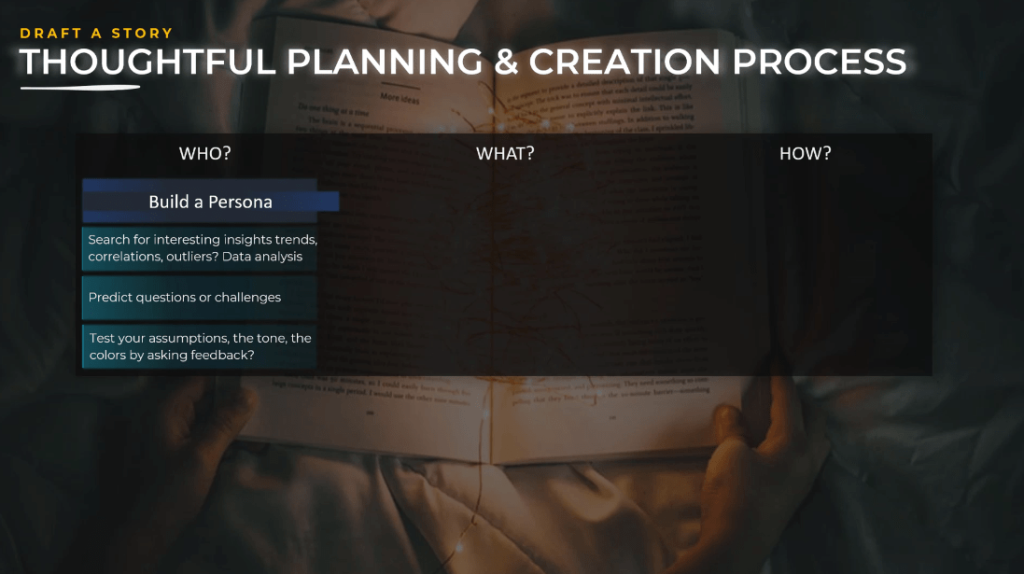
In line with this, we start by building a persona. What is a persona? A persona is a fictional character that we create to represent the different user types.
Using the report, creating personas will help you understand your audience’s needs, experiences, behaviors, and goals. Creating personas can help you step out of yourself. It can help us recognize that different people have different needs and expectations.
In addition, it can help you identify with the users you are designing for. They guide your processes, and they can help you achieve the goal of creating a good user experience for your target user group.
When searching for a story, we start looking at our data. It is worth looking for insights, trends, correlations, and outliers. Our analytical skills are put to test with all ideas that you find interesting.
Once you have your data exploration in data analysis, finalize it, look at your personas, put yourself in your audience’s shoes and think about their reaction.
What will they see? Will they understand what they see? What questions or challenges will they face? Do not forget to test your assumptions by asking questions. Let’s keep in mind that perception is important; hence, feedback is mandatory.
Given these points, check that the overall tone you give to the report is also matching the expectations. Make sure the colors are well understood, and that they help stand out important information.
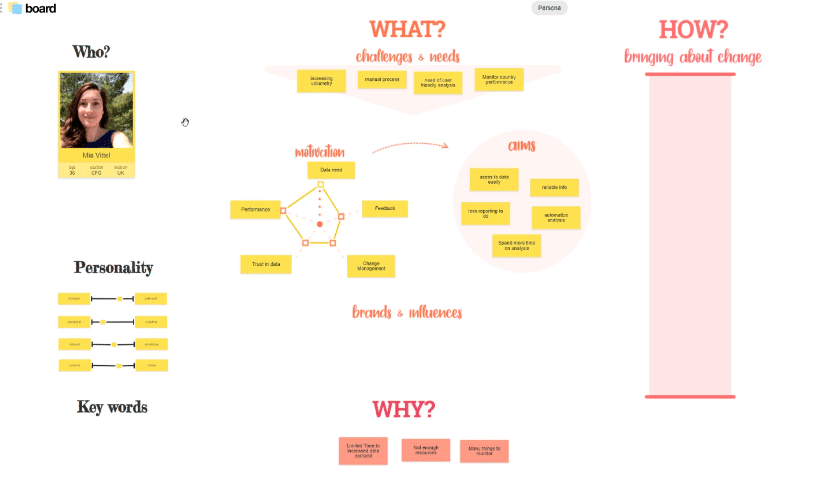
There are different persona templates on the internet. I usually use the application called Klaxoon. This program has different templates, and the one that is called Persona is very useful.
When using a template, we should have the information that we need to know, such as who is our audience or who is our persona.
We can give them a name, a position, and age. Then we can have their personality so we can see what type of personality our persona has. We should also know their skills, their motivations, their aims, their challenges, needs, and more. This is how we can create a persona, and we can use whatever template we consider fit.
Effective Data Storytelling: Decide The Big Idea Of The Report
Let’s now move to the next section, the What.
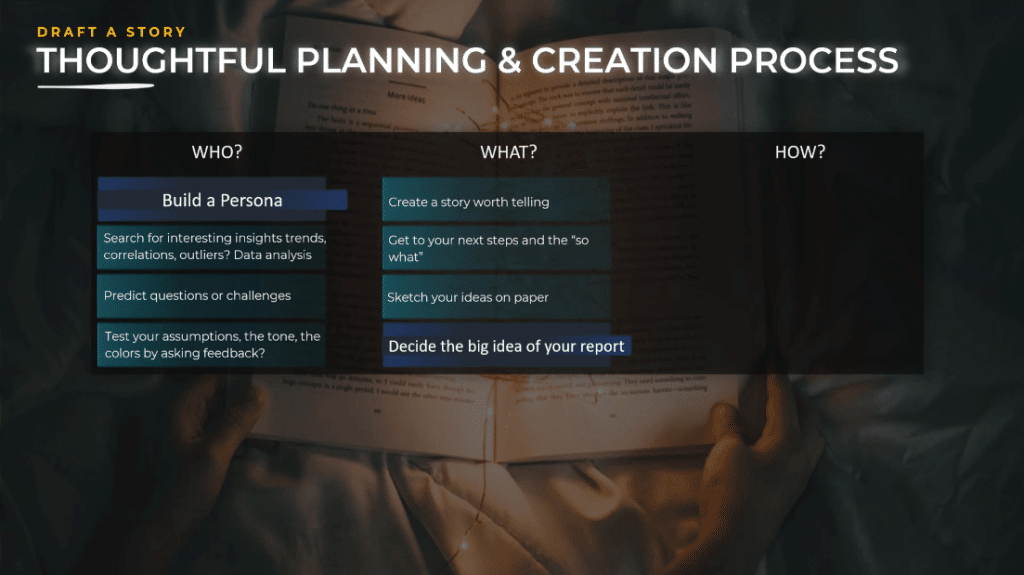
Effective data storytelling creates a story worth telling. It brings valuable information that has an impact. Also, users want to see interesting facts, look at the data in a way they never did before, and learn new things.
Get to your next steps and know your “what.” Once again, context is everything and if you present a figure, always ask yourself the following questions.
For example, is a copy good or bad? How do I know if it is bad or good? Do I have enough context to find out this information by myself? And if values are bad, since when they are bad? What caused this? Is this an exception? Do I have more detail about this? Should I care about it? Should I worry? Does it need urgent action from my side?
The “what” will guide us to develop our story, and the order of the questions we need to answer will help us develop the story.
Sketch your ideas on paper. Why on paper? Because we need a sound logic flow.
Needless to say, all the ideas and information we have must be arranged in a logical order. Writing on paper is a good practice that allows us to create different possible scenarios.
Decide the big idea of the report after sketching our ideas on paper. Making a decision on which path to take after sketching your ideas plays an important role.
Is it crystal clear to you what you want to achieve? Can you summarize the idea of your report in just a sentence or two?
Deciding the big idea of our report will help us develop a story that is focused and easy to understand for the end users.
Providing Clear Takeaways In The Story
Finally, let’s discuss the last section, the How.
Now that we already identified the story and the logic of how we would develop it, ensure that we also provide clear takeaways in a story.
The end is very important because it is like the signature on a painting. A clear takeaway is the signature of the data analyst.
***** Related Links *****
Enhanced Data Visualization And Reporting Frameworks
Data Storytelling: Thoughtful Planning & Creation Process
Power BI Feature Bookmark Navigator: Tutorial & Review
Conclusion
Like an actor, we need to put ourselves in the shoes of our audience. Knowing them such as their work, their pain points, and their processes is a critical part of creating a story.
The more we understand our audience, the more we will be able to answer their needs.
If we have our audience in mind and think in terms of how the report consumer will use and interact with the report design, we will produce useful, effective, and visually appealing reports.
Now it’s time to put your knowledge to practice. If you really want to improve your skills and improve your Power BI reports by incorporating meaningful stories, you need to practice by participating in Enterprise DNA Challenges. This is open to everyone.
You will gain experience, build your own portfolio, and will also receive feedback from a very supportive community.
All the best,
Alex


