
If you are a business selling products in many different stores or across many different regions, then you will want to understand if there is any commonality in your top or bottom selling products. You would want to discover your top products per region. You may watch the full video of this tutorial at the bottom of this blog.
In this example, I run through how you can find your top 2 products using DAX calculations in Power BI.
I can see this being also really valuable if you were looking for outliers in your data over time. Maybe you identify that some products sell very well in particular regions over others, and there may be an opportunity to take advantage of this with promotions, upsells, etc.
There are so many opportunities to add value with these types of insights.

In this tutorial, I run through the DAX formula required to achieve this particular insight, focusing on how to use TOPN inside the CALCULATE statement.
Why Isolate Your Top Products
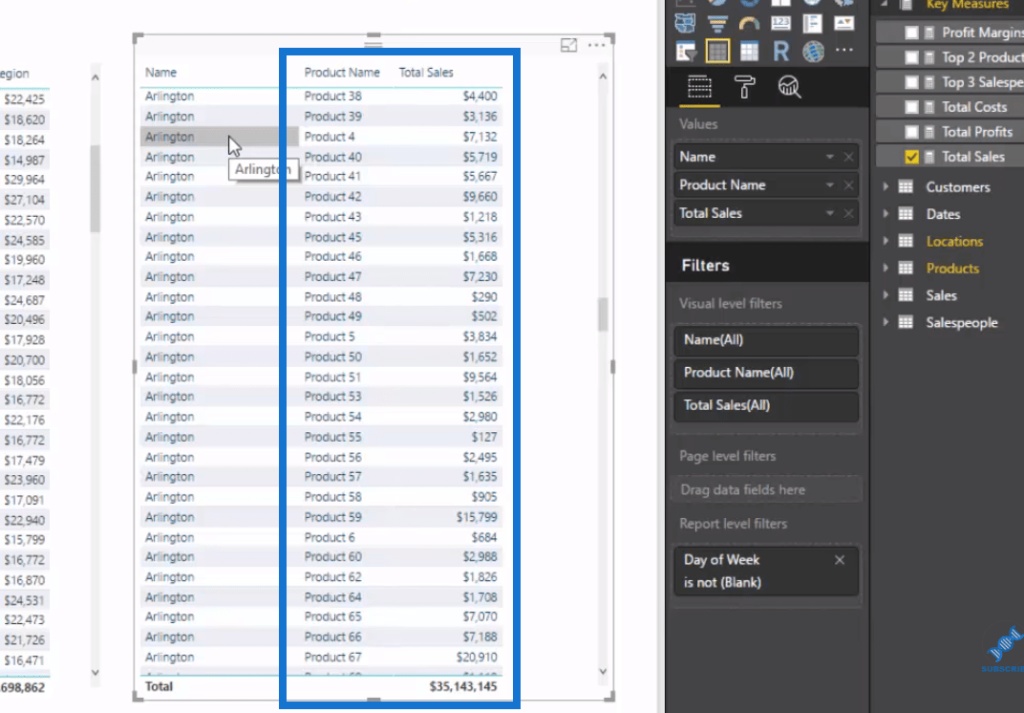
It’s easy to work out the total sales of every product per region. However, it can get us a really busy chart when we only want to focus in our top products.
We see in this table that we sell a lot of products and that list can get really long. It’s quite hard to see any trends, or to see the calculation or the insight that we seek.
In this example, we want to see our top 2 products, so we need to somehow make the ones that are not on the top two appear as blank. That way, they wouldn’t show up in our visualization.
The technique that we’re going to use in this tutorial is very useful for a range of different scenarios, not just selling products. It could be best customers, best selling regions, top sales people, etc. We could even isolate profit margins, or costs.
The great thing about this pattern that we’re going to use is that we can change the context of the calculation and it will dynamically adjust the table.

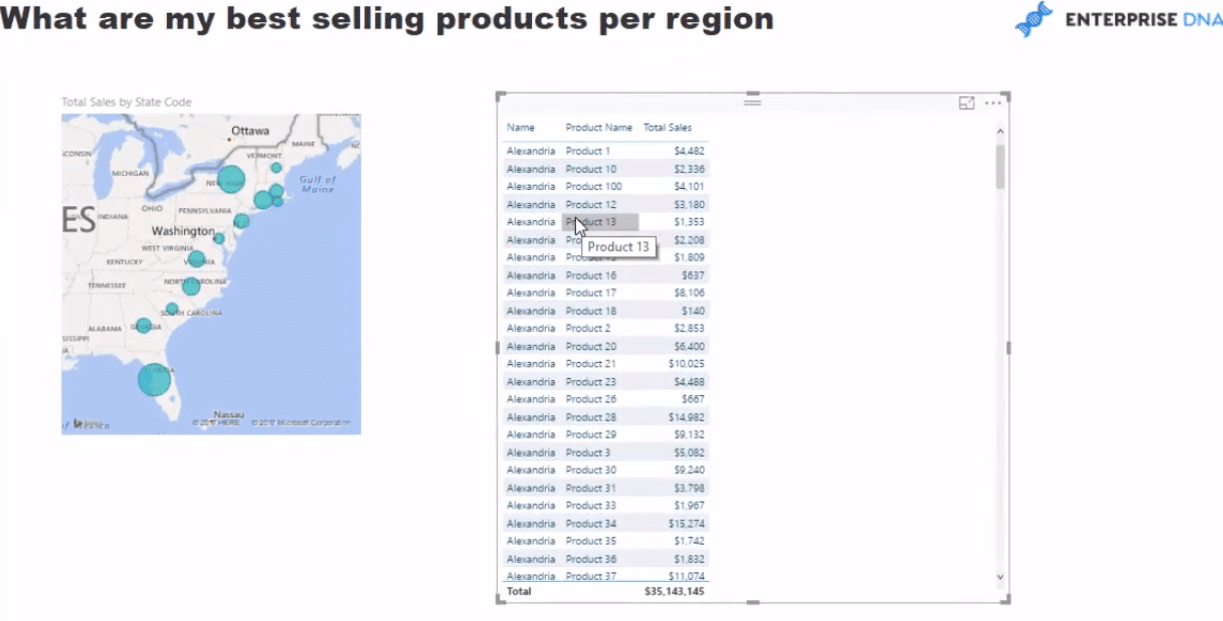
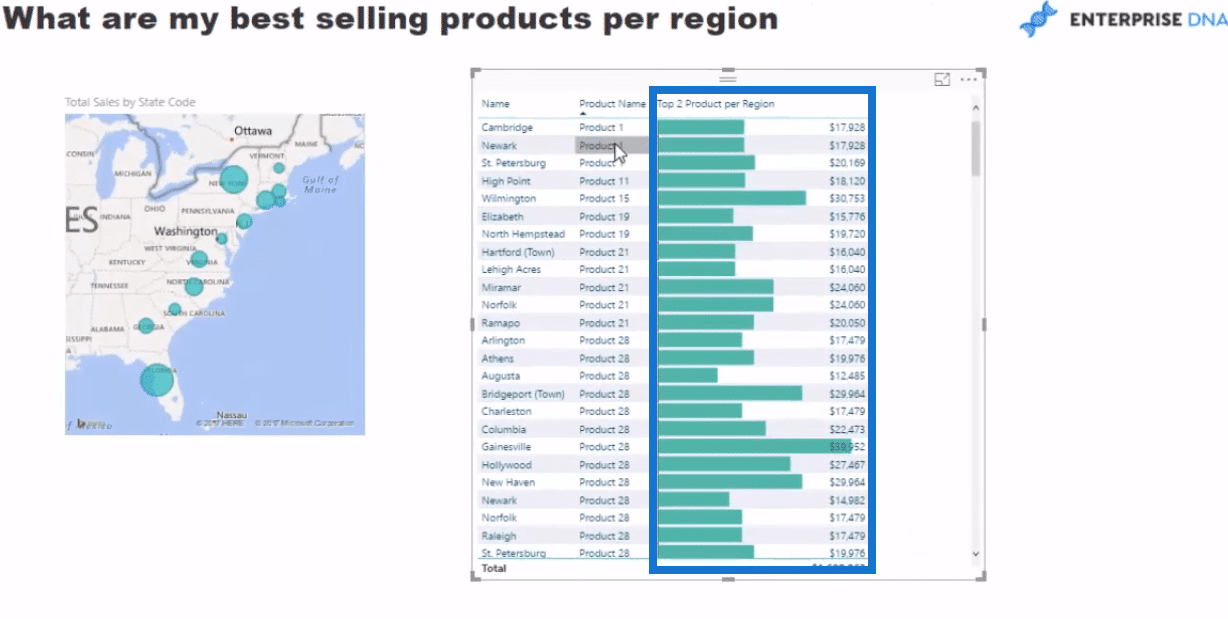
In this visualization, it’s very easy to see are all the places we sell, sort it by the product name, and we could see our best selling products, etc. We could use all the insights here for marketing promotions, advertising new deals, for example, and so on.
How To Find Your Top Products
I’m going to show you the formula that enables us to find our top products.
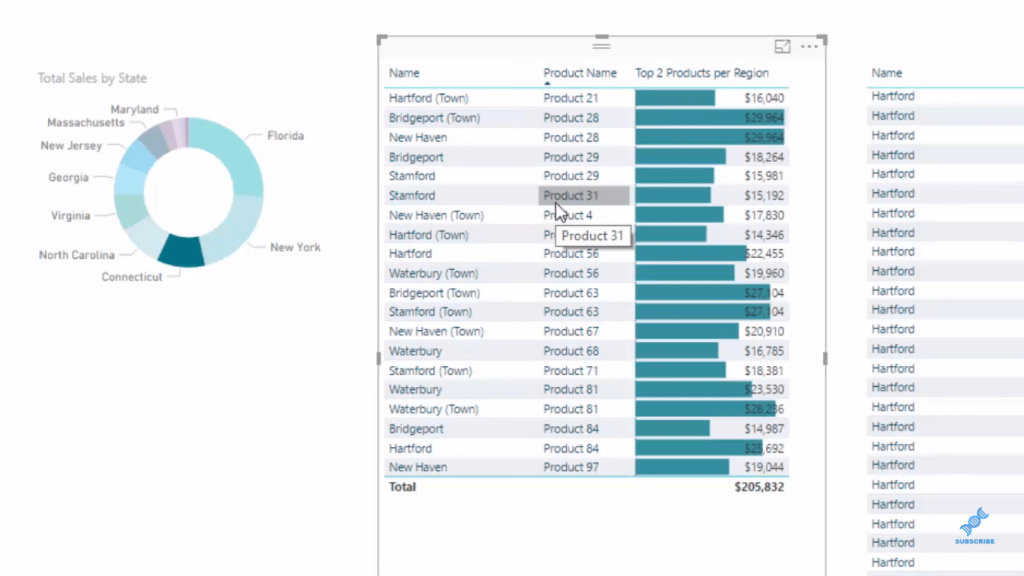
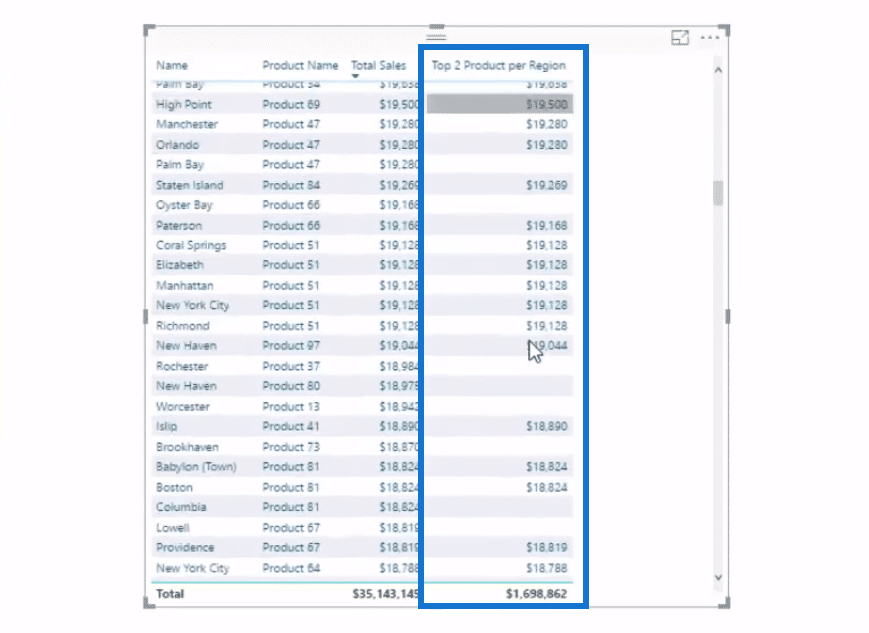
Here, we have our Total Sales by State Code, and the other table is showing the sales for every single product for each location. In this example, we want to show only the sales of the top 2 products in each region, then blank out everything else.
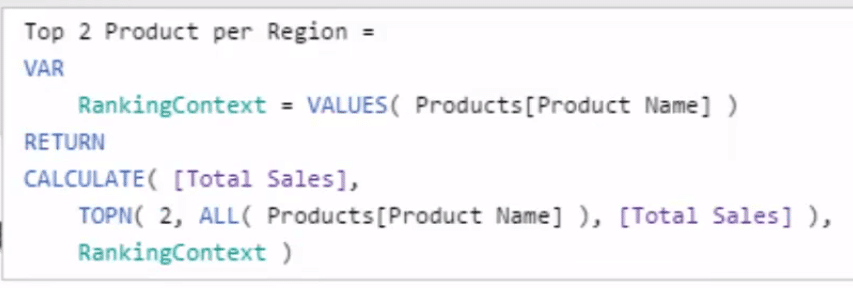
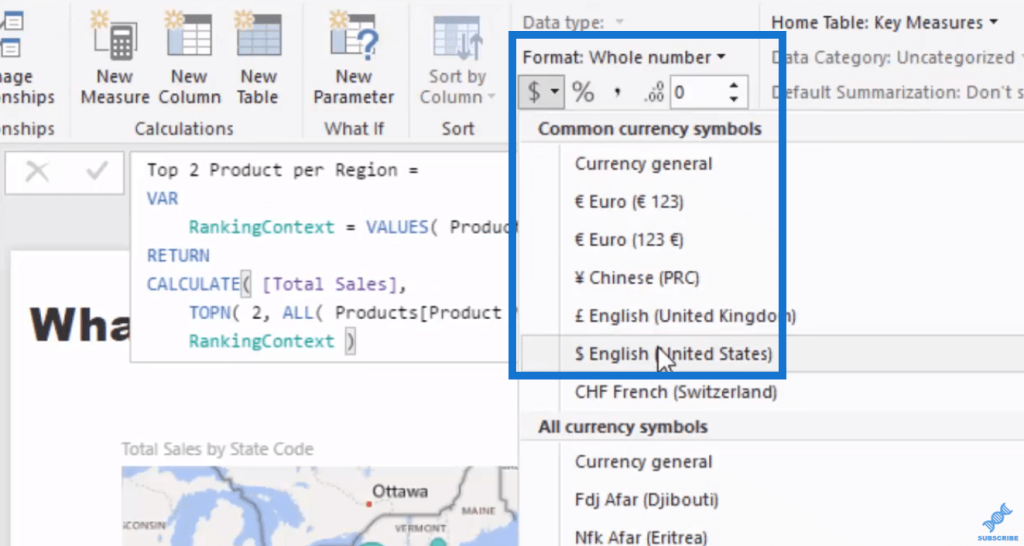
To do that, we create our formula, which I call Top 2 Products per Region. We use VAR (variables) here, and put a RankingContext on the next row with our Products because that’s actually what we’re going to rank. On the next line, we go RETURN, and then use CALCULATE Total Sales.
Then we go TOPN with the N value as 2, as we are looking for our top 2 products, in this example, and so we have ALL Products as well. After which, we rank it by Total Sales.
Lastly, because of this ALL statement in our TOPN function, we have to bring back the context of the Product Name. And to achieve that, we put this RankingContext.
Once that’s done, we click OK and we make sure that it’s formatted correctly.
If we bring this into our table, we can see now that there are blank values for all of the products that are not in our top two. All the rest of the values are of our top two products in any specific region.
And this, of course, links back into the data model just like most of the calculations we do. We can also improve this visualization by adding the Data Bars, bringing in some color to our table.
***** Related Links *****
Where Are Your Best Sales By Product? Advanced Analytics with Power BI
Showcase The Top Result Name Within A Card Visualization Using Power BI
Ranking Insights Using TOPN In Power BI
Conclusion
As I mentioned, you could reuse this formula pattern in many ways with any dimension that you can think of that you have in your data model. You could use this technique and bring some great insights into into your reports.
This technique is a great one to learn really well. Understanding how TOPN internally calculates a ranking on the fly, and then creates a context inside of CALCULATE, which isolates the top (in this case) products for sale, is very useful for you as you go about with Power BI.
The VALUES function is equally important as well. You need it to bring back the product name context to get this calculation to work properly.
As always, DAX is an amazing analytical language, which is worth learning really well if you are getting into Power BI. Really, if you not learning DAX, than you are missing out on 90% of what you can achieve inside Power BI.
Enjoy learning about this technique and make sure to look to apply it in your own environments to embed the concepts in your minds. Check out the full video below.

Cheers!
Sam


