In this tutorial, I wanted to go over new customer sales and teach you how to calculate it using your Power BI model. You may watch the full video of this tutorial at the bottom of this blog.
When you’re working out who your new customers are, you first of all need to make sure you have a sound understanding of how you classify a new customer.
The calculation and logic that you utilize to work out the new customer sales (or revenue) is very similar to just working out the absolute number of new customers. The only difference is that you need to structure our DAX formulas in a slightly different way. That’s what this tutorial focuses on.
Advanced Insight From New Customer Sales Data
The main difference around calculating new customer sales versus new customers is that you need to utilize a virtual table inside the filter context of the CALCULATE function.
Once you have successfully incorporated the necessary formula, you’ll be able to come up with a New Customer Analytics report just like the one below.

Within the sample report, you can see a chart right here that compares the total sales and the new customer sales by month and by year.
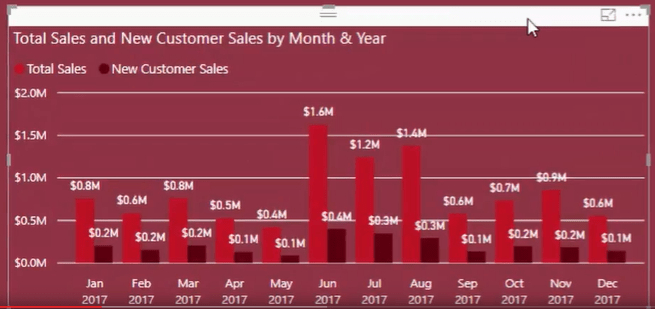
To come up with this insight, you need to break out who your new customers are or at least classify what you consider as “new customers.”

After that, you can then compare new customer sales to the current month’s total sales. From there, you can derive the percentage of new customers and new customer sales just like the data below.
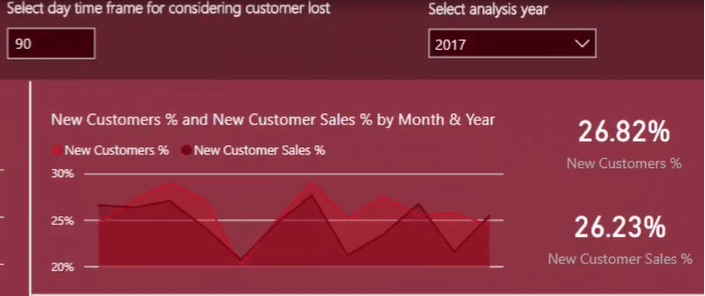
Those are some of the interesting insights that you can derive from this New Customer Analytics report that I’ve prepared. Now, here comes the tricky part, I’ll teach you how to come up with these churn analytics.
Evaluating The List Of New Customers
Before you can calculate your new customer sales, you still need to identify who your “new customers” are. You can check out a detailed discussion about new customers here. After that, let’s jump to this page that I’ve set up.

In short, new customers can vary across any business. For this demo, I consider customers to be new if they have purchased in the current month but they don’t have a prior purchase history in the past 90 days. You can actually change the time window depending on your parameters. You can set it to 180 days or you can go lower to 30 days, for example.
Take a look at the formula for new customers.

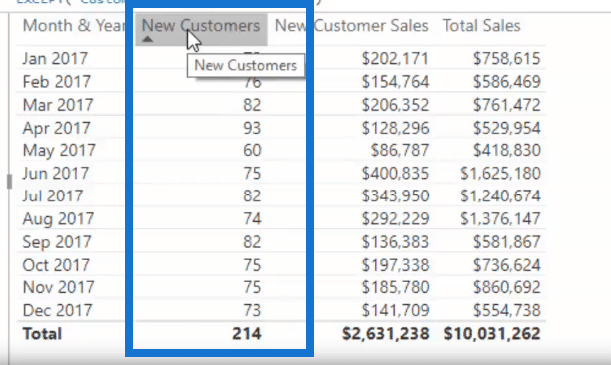
The CustomerTM and PriorCustomers formula calculates the customer set within the 90-day window and looks into the customer set in the current context.
Then, the EXCEPT function returns another table for the customers that are in the first parameter but not on the second. Lastly, the COUNTROWS function will count those customers.

The whole formula will bring us the data for this column below.
Breaking Out New Customer Sales
Next, let’s calculate new customer sales using this formula.

If you’re already familiar with the previous formula for New Customers, this one’s going to be easy. That’s because you’re just using exactly the same formula as before.
What makes all the difference is the stuff that you do after the RETURN function.

Instead of COUNTROWS, I’ve set up a new formula now. I’ve changed it to CALCULATE, because you need to change the context of our Total Sales formula.
And the values below in the New Customer Sales column are what you need to break out through the formula. That’s because this formula only evaluates a specific subset of customers that you consider new.
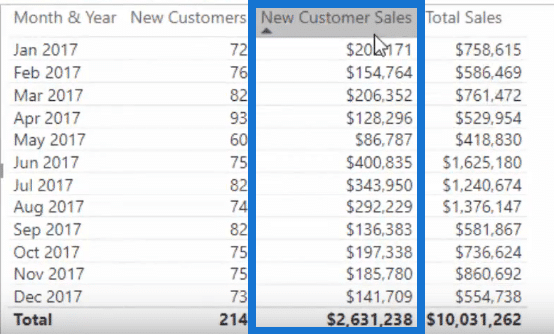
In another example, when you try to change our context for new customers, the results would also change. For instance, I will consider customers as new if they have purchased before a 180-day window. The data for new customers, new customer sales and total sales would also change dynamically.
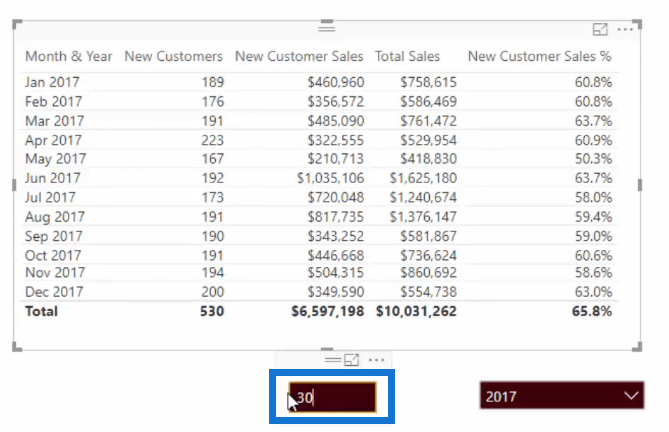
I hope you can understand better now on how you can branch out into greater insights. Finally, if you think of calculating steady customers, it wouldn’t be difficult. Steady customers are the opposite of new customers, right? So all you have to do is create a new measure.
Working Out The New Customer Sales Percentage
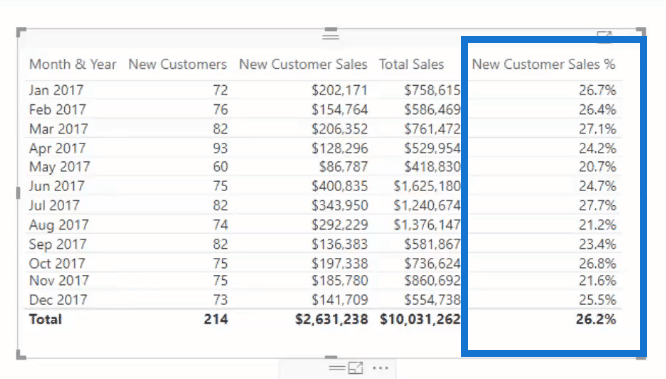
Next, what about if you calculate the percentage of new customer sales? Take a look at this another formula.

After adding the formula, just bring it into the table so you can see the applicable results in the New Customer Sales % column.
***** Related Links *****
New vs Existing Customers
New Customer Analysis Using Advanced DAX
Attrition Analysis: Finding Lost Customers Using Power BI & DAX
Conclusion
Understanding new customer sales is an important metric for a lot of organizations. Therefore, you’ll get to know how much of your sales are from existing customers versus new customers.
In a lot of cases, having existing customers purchase more can be of a much greater benefit to a lot of organizations because it is often a significantly less expensive way to generate more sales. Certainly, this is open to debate because it depends on the cycle that the business is in and whether it’s a start-up or an existing company.
Hopefully, you can get a lot out of this tutorial and also see how to implement some quite advanced logic inside your Power BI models.
Good luck with this one!
Sam


