This tutorial will talk about the Diagram View in Tabular Editor 3. You’ll learn how to maximize this tool to create your data model in an efficient manner. You’ll also learn how this option can improve your data development skills in Power BI.

Opening The Diagram View
To get the diagram view of a data model loaded in Power BI, go to the File toolbar. Then, select New and click Diagram.

Another way is to click the New Diagram icon in the toolbars pane.

Adding Tables In The Diagram View
To add a table in the diagram view, drag and drop a table from the TOM Explorer. You can resize and rearrange the table inside the diagram. In this example, the ProductsData table is used.

Another way is to right-click on the diagram view and select Add Tables.

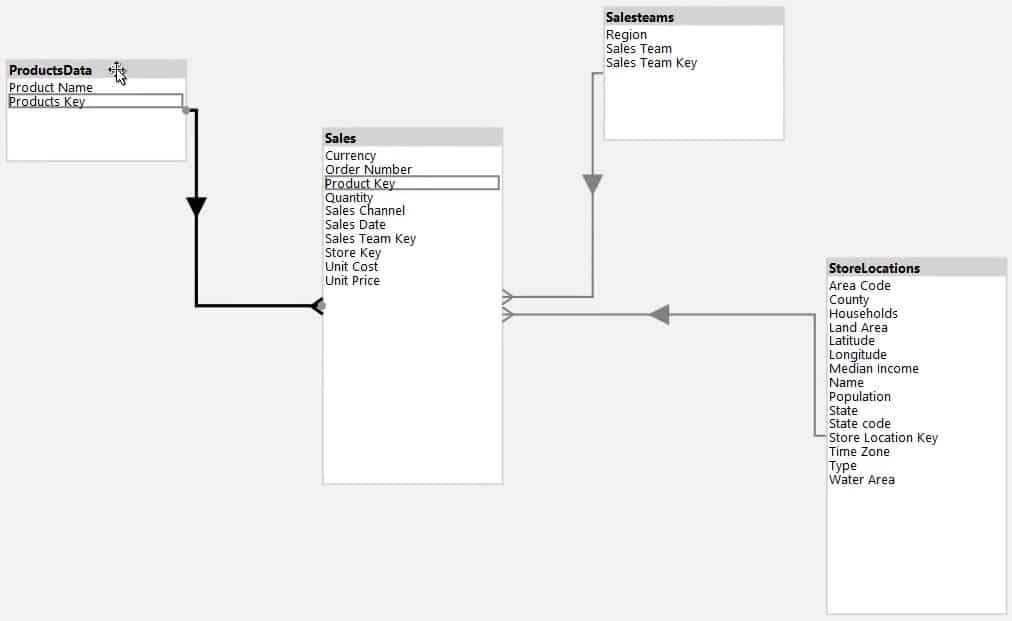
In this example, the Sales table is added to the diagram. You can also see that it formed a relationship with the ProductsData table.

Technically, it didn’t make a new relationship. It simply made a diagram based on the relationship that already exists in the Power BI model.
Opening Related Tables In Diagram View
If you want to add tables based on relationships, right-click on the Sales table and select either Add Tables That Filter This Table or Add All Related Tables.

If you click Add Tables that Filter This Table, you can see all the tables filtering the Sales Table.
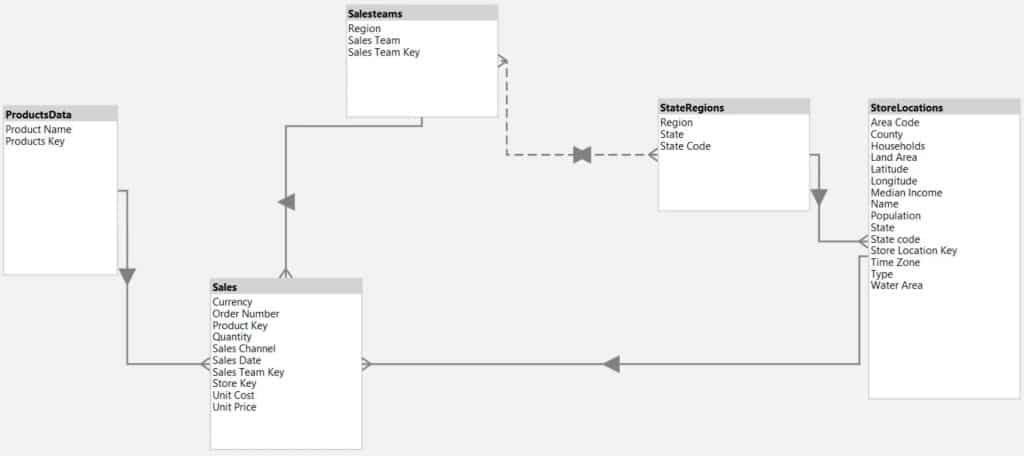
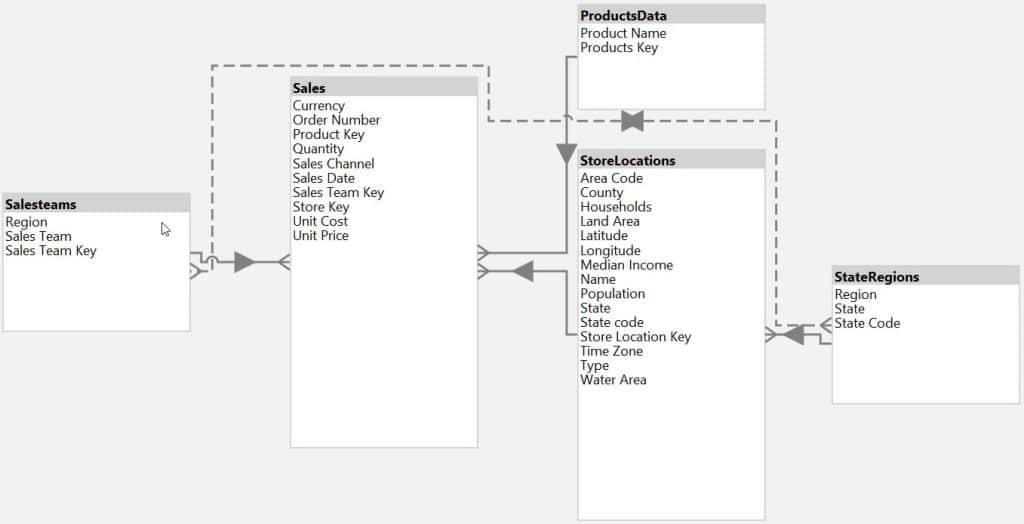
On the otherhand, if you select Add All Related Tables, you can see all the tables that are directly related to the Sales table.
The Fit To Page option fits all the tables inside the diagram, while the Auto-Arrange option automatically arranges them. The Tabular Editor decides the best layout of the diagram view based on its internal coding.
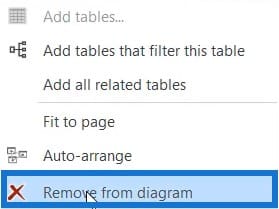
To remove a specific table from the diagram, right-click on the table and select Remove From Diagram.
You can open a diagram while developing measures or calculated tables and columns. Drag and drop the Diagram View at the left or right side of the Expression Editor pane.
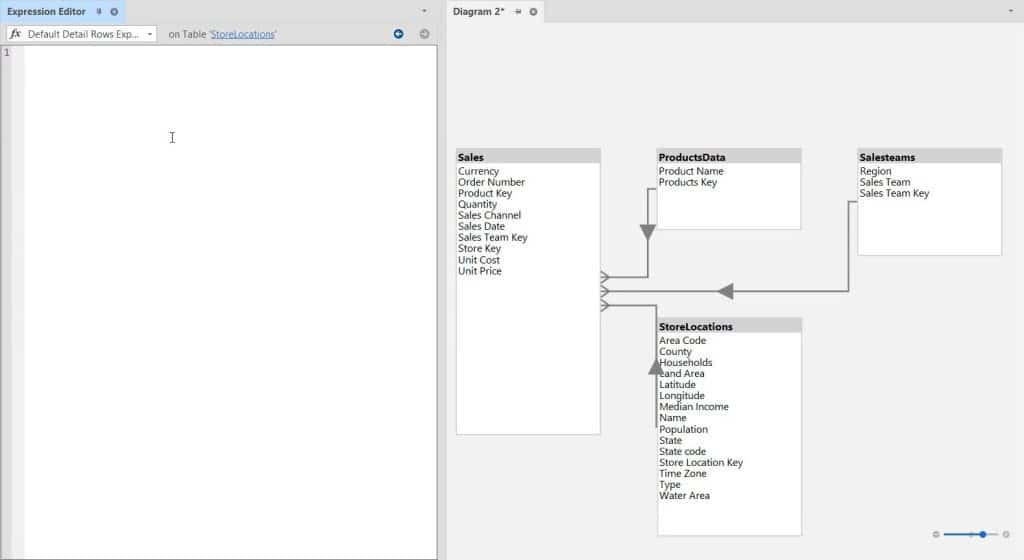
Putting them side by side helps you conveniently create measures. It also saves you time from opening the Power BI Desktop to check the data model and review the active and inactive relationships in your tables.
***** Related Links *****
Power BI Tabular Editor 3: Automate With A Script
Tabular Editor 3: Beginner To Advanced
Tabular Editor Power BI: Version 3 Review & Tutorial
Conclusion
There are a lot of things that you can do with the Diagram View to be efficient when it comes to data development. Maximize these techniques to make compelling and insightful data reports.
Enterprise DNA Experts


