
I want to focus today on something I call the hidden DAX trap. If you encounter this situation, it will make you feel like you’re losing your mind because your DAX is going to look right, but it’s not going to work. I’ll walk you through when that occurs and what you can do about it, and in the process, also talk about some general DAX optimization best practices. You can watch the full video of this tutorial at the bottom of this blog.
Let’s first take a look at what we’re working with here. We have about 10 years of data from the Internet Movie Database. The fact tables are pretty simple, and we have rating data, budget data, and gross data.
Today, we’ll be looking at worldwide grosses.

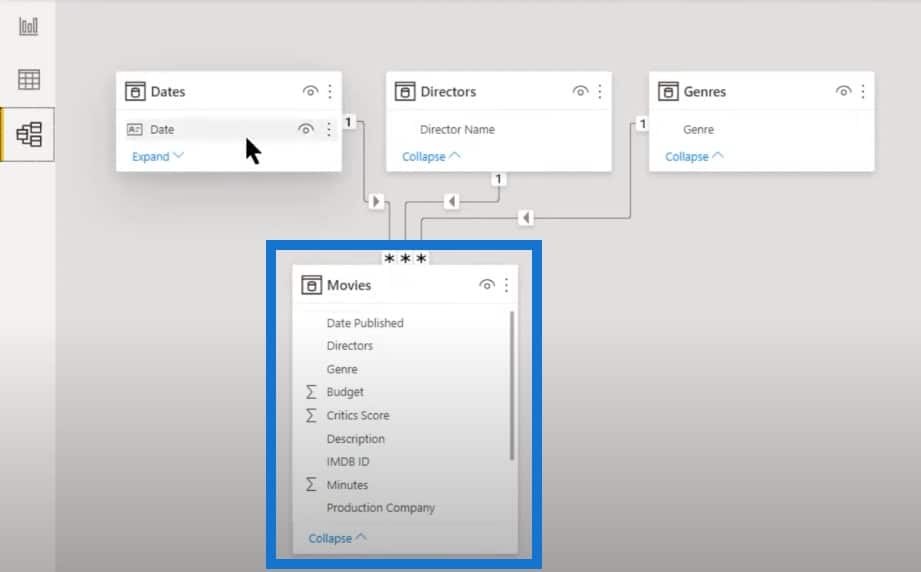
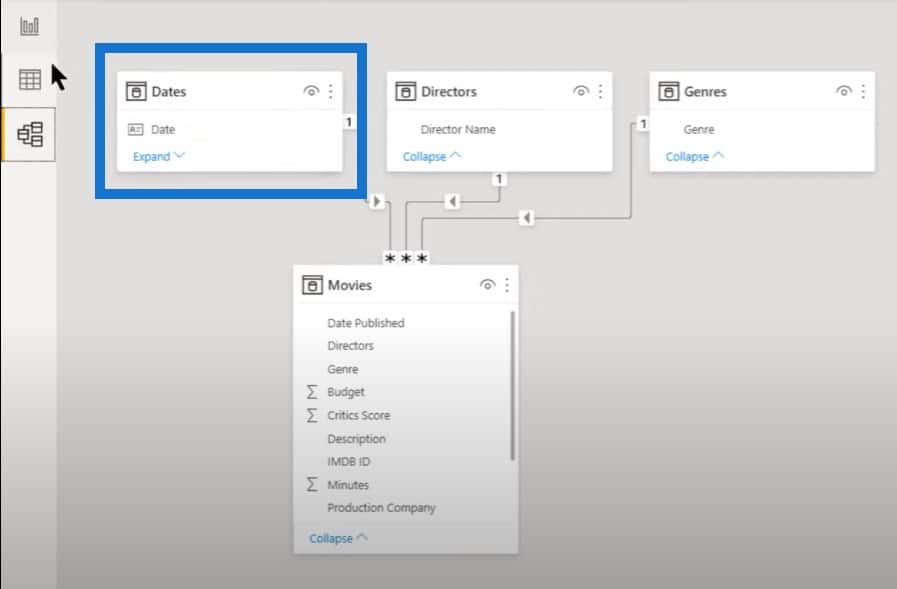
We also have our extended date table. This is going to be a time intelligence analysis based on the date table and the fact table.
Total Worldwide Gross Per Year
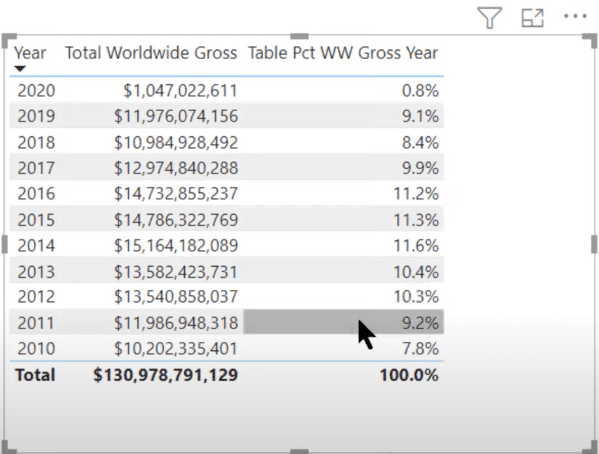
We want to do something really common and simple. Our Total Worldwide Gross is just a very simple aggregate sum measure, which we want to convert into a percentage.
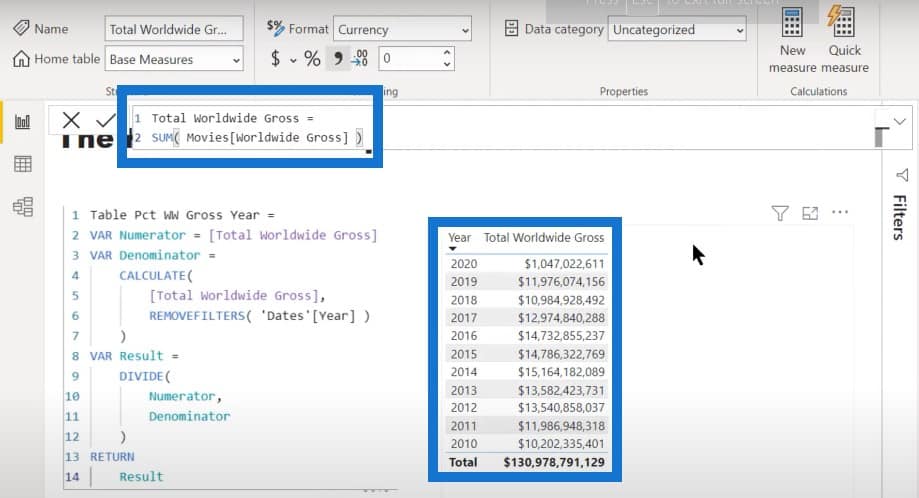
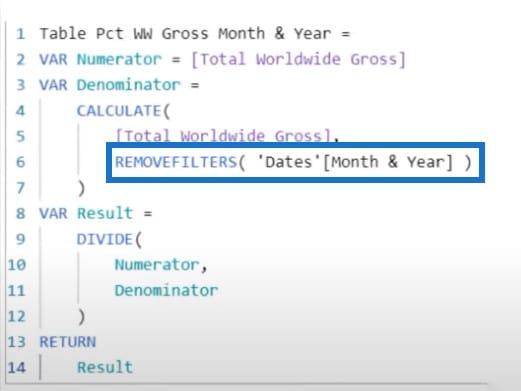
To do this, we take the numerator (Total Worldwide Gross measure) and the denominator (Total Worldwide Gross measure, but removed the context from the year filter).
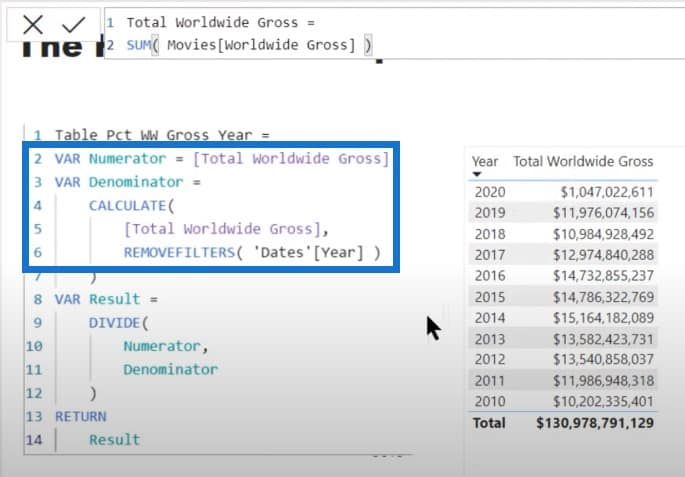
I used the REMOVEFILTERS function because I think it’s more intuitive when you read the code, but if you prefer the ALL function, that works just as well. We just divide the numerator by the denominator to get the result.
If we take the resulting measure and drop it into our table, you’ll see that it does exactly what we expect it to do. We get 100% at the bottom and we get the years converted into their individual percentages. So far so good, and we haven’t encountered any problems yet.
Total Worldwide Gross Per Quarter
Let’s take a look at a similar situation where we go by quarter. This measure could be useful because there is the hypotheses that grosses from the summer movie season is different from the beginning of the year, and toward the end of the year leading to the Oscar season.

Again, we have the exact same measure with the REMOVEFILTERS function on the quarter numbers instead of the year.
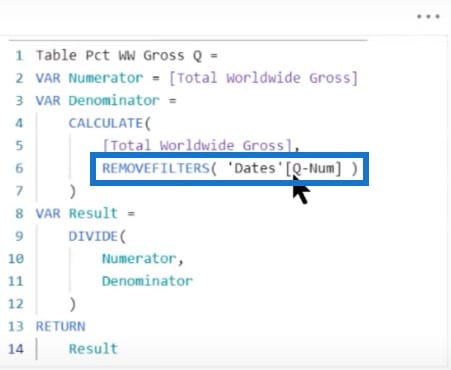
And if we drop the measure we just made into the table, it also does exactly what we expect.
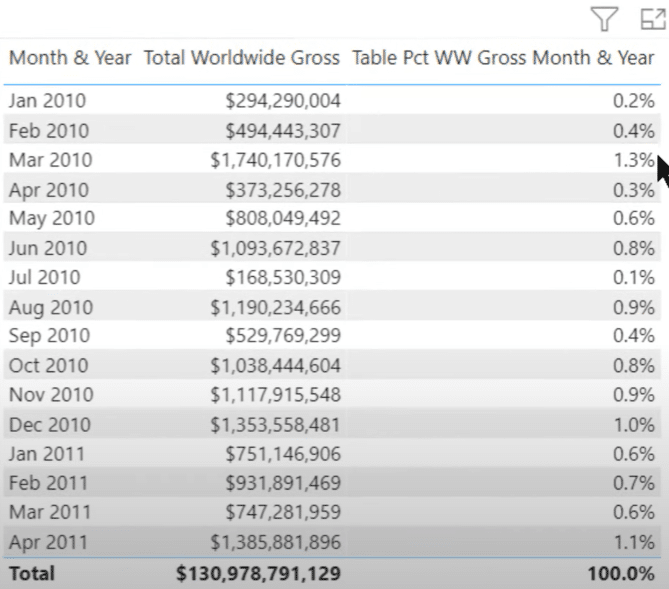
Total Worldwide Gross Per Month & Year
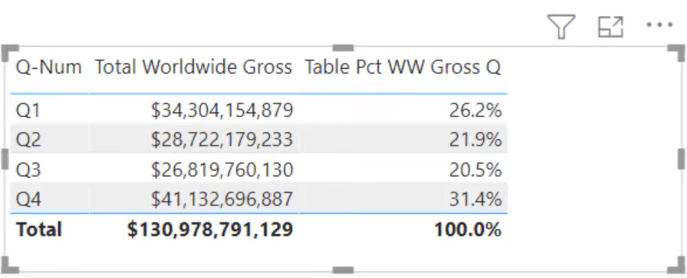
Let’s take a look at the third case, which can be really common, where we want to look by month and year.
And again, we’ll use the same measure as before. But this time, we’ll remove the filter on month and year.
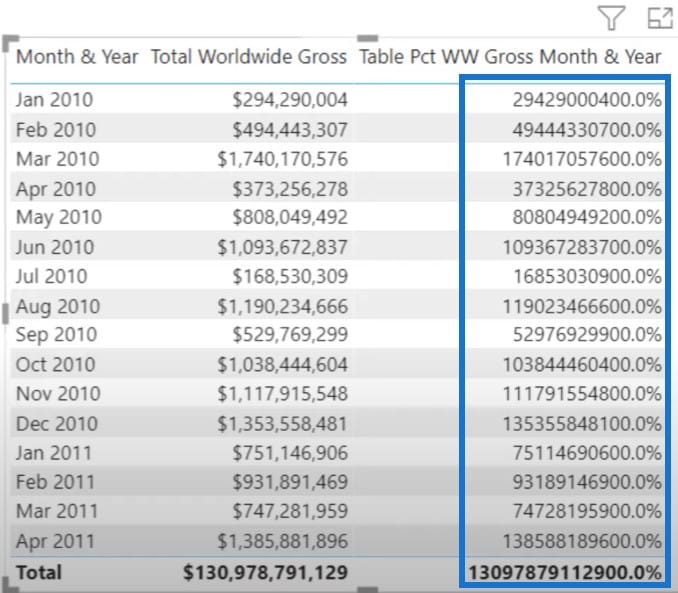
Let’s drop that one into our table. All of a sudden it doesn’t work.
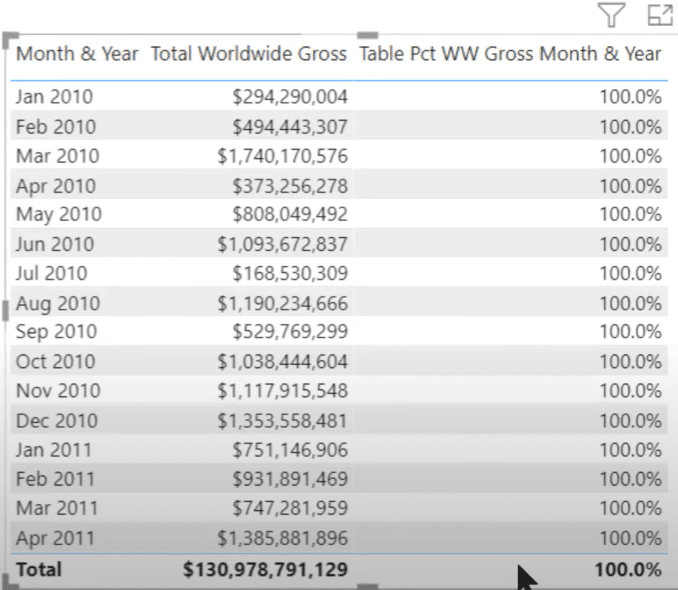
We can tell what’s not working about it. We know that the Worldwide Gross measure works, so that means that the numerator is fine, but the denominator isn’t. In each of the previous cases, the REMOVEFILTERS function removed the filter properly, but in here, it clearly did not.
We can actually test this out by changing what we returned here in the result.
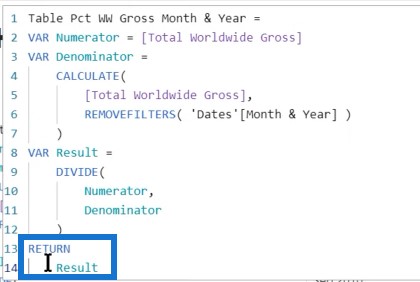
Instead of Result, let’s use Denominator. Keep in mind that this is going to be formatted in a percentage so it’s going to look a little funny.
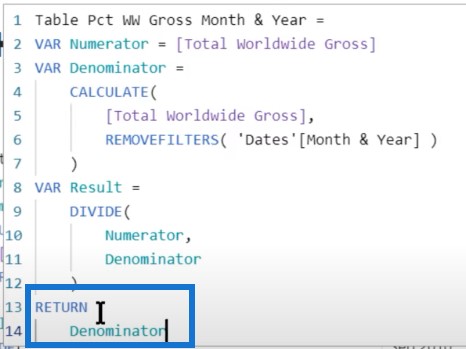
What we should be getting for the denominator is the same number in every row, but it’s not.
We can tell it’s not removing the filter on month and year, and think it’s because the Month & Year is in text.
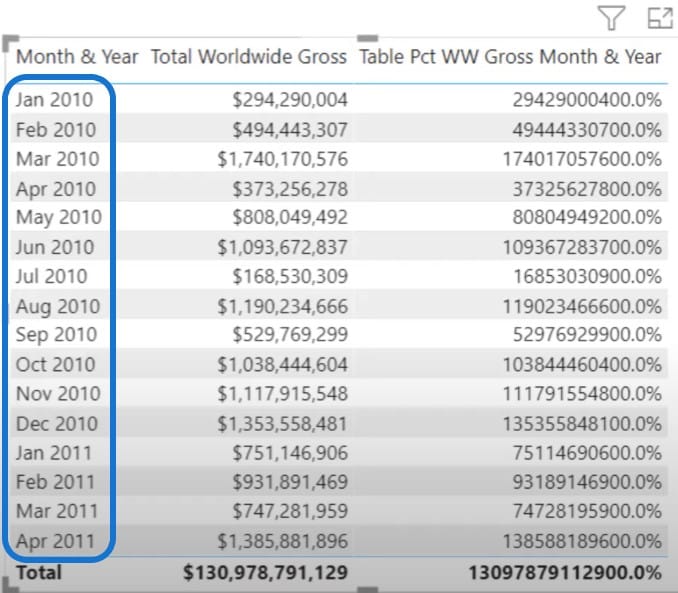
But the previous one for quarter was also expressed in text, so it’s not simply because its text. It only needs to be sorted out. Once you drop the field without sorting it, it’s going to sort alphabetically.
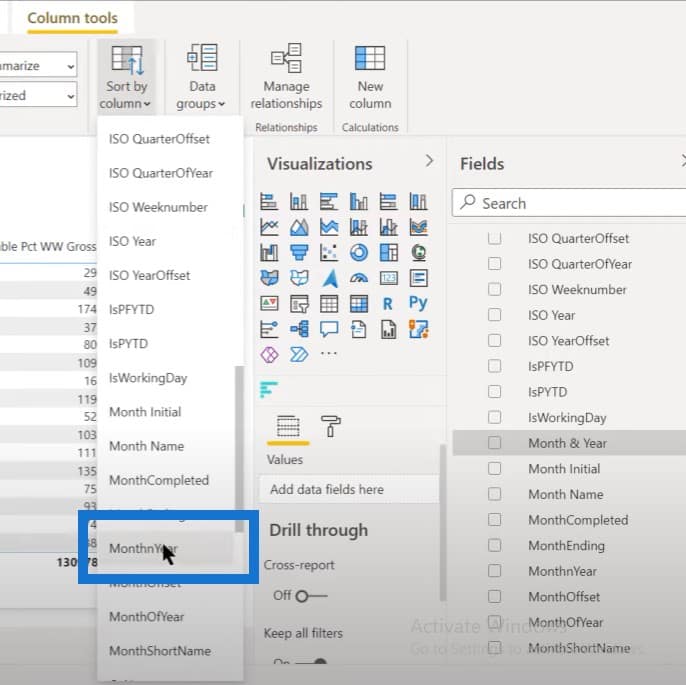
In the extended date table, let’s take a look at that field called Month & Year. If we look at it in the Sort by column, we’ll see something interesting.
We’ll see that that column is sorted by a numerical called MonthnYear. When you sort one column by another, that sort column actually becomes part of the filter context. This is what’s throwing this calculation off.
Let’s go back to our measure and remove the context of the month and year that we’re using as our sort.

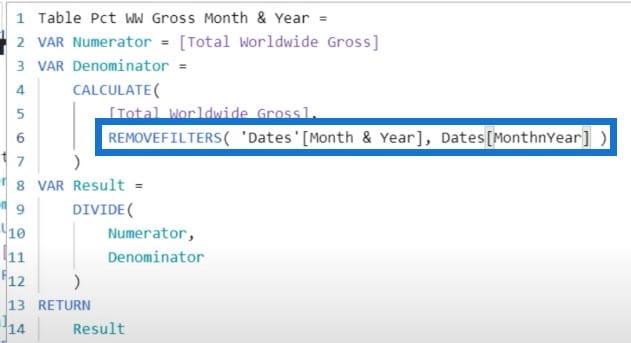
We are now getting exactly what we should, which is the month and year calculated as a proper percentage.
When removing a filter context, it will take two fields to do this when it’s sorted. You may ask that instead of having to do two fields here, why can’t we just remove filters on the entire date table?
The answer is we can, and this will work for the three examples that we talked about because each of those columns is part of our dates table. Removing all the filter context on that table will work for all three cases, but this is actually a bad idea.
As a general DAX optimization principle, you need to remove as much filter context as needed to get the result you want.
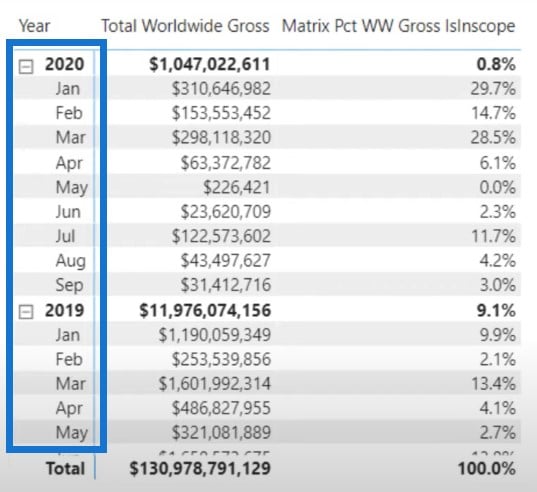
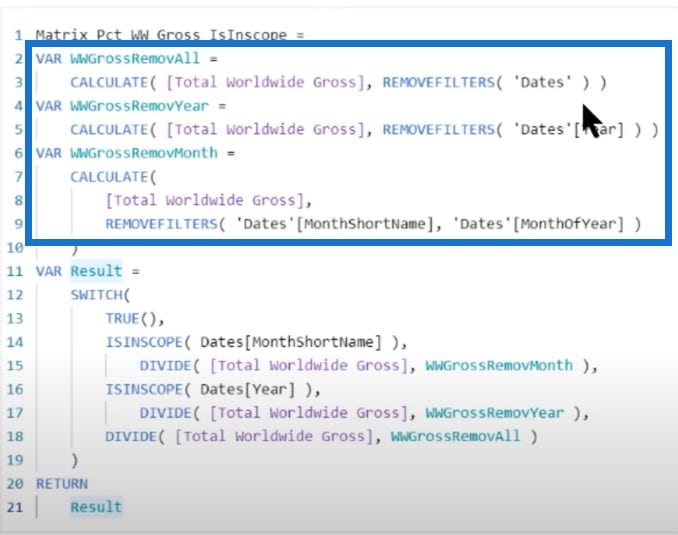
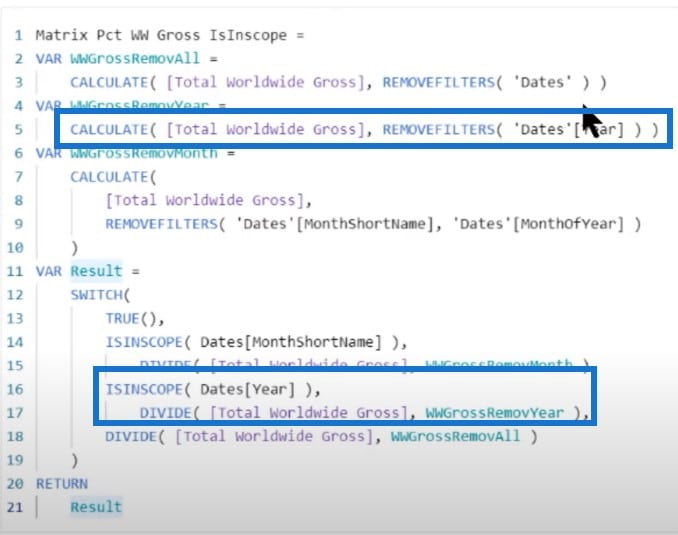
In most cases, you’re not going to present this in a tabular format. You’ll present it as a matrix, and you’ll need a more complex measure because you have two different granularities in the same column. This measure looks complicated, but it’s really not.
This is just an extension of what we’ve already done. The first part of this DAX optimization calculation shows the denominators for the different granularity. We remove the filter context for a month, for the year, and for the entire table.
For the second part of the calculation, we used SWITCH TRUE. For this function, you have to go from the most specific to the least specific. Month is our tightest and most specific scope, so this is where we start. We’ll need to remove context using those two fields that we identified.
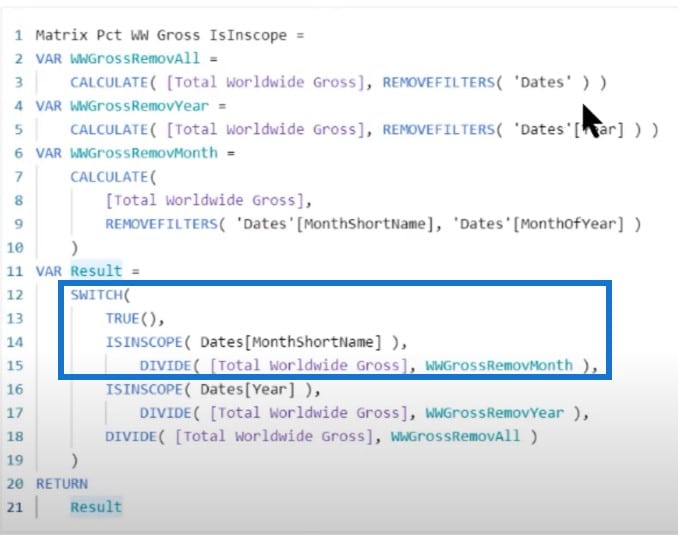
For the scope of year, we have to remove the context on year, and remove the context on the entire table.
Let’s take a look at what happens if we are to take and remove the context on the entire date table. We’ll use a different measure that removes the context on the entire date table for all three cases.
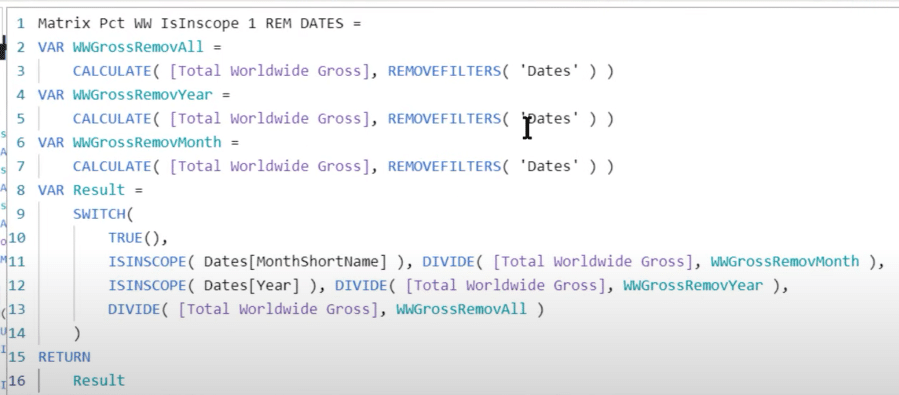
We’ll see that the measure is over-removing context. Instead of calculating the contribution of each month to that year, it’s calculating the contribution of that month to the entire data set. This is not what we want to happen because removing context from the entire table is really just a blunt instrument when a scalpel is needed.
***** Related Links *****
How To Fix Matrix Totals In Power BI
Matrix Visual In Power BI: Controling Totals & Subtotals
DAX Measure Analysis: Breaking Down Long DAX Measures
Conclusion
There are many instances where you have a matrix and you need to carefully control what context you remove. To just remove the context on the entire table is going to cause these sorts of problems.
I hope when this situation comes up (which invariably will, at some point), you’ll recognize it as the hidden trap that we’ve discussed on this DAX optimization post, and you’ll be able to avoid it without the same frustration that it caused me when I first saw it and couldn’t figure out why my DAX wasn’t working properly.
If you enjoyed the DAX optimization topic covered in this particular tutorial, please subscribe to the Enterprise DNA TV channel. We have a huge amount of content coming out all the time from myself and a range of content creators, all of whom are dedicated to improving the way that you use Power BI and the Power Platform.
Brian


