Iterating DAX functions in Power BI or iterators are key concepts to learn and understand well. I made several tutorials around how and when to use these functions in DAX formulas. However, I’ve seen a few confusions with these functions in the Enterprise DNA Forum, so I thought it would be a good idea to discuss some of these issues encountered by Enterprise DNA members and show you the solutions.
As you learn more and go deeper into DAX formulas, you’ll find yourself using iterating functions more often than you think. They’re more versatile than simple aggregation functions, such as SUM or AVERAGE, and I demonstrate that in this first forum post.
Using AVERAGEX Instead Of SUM
In this forum post, the member was trying to summarize safety statistics from observations made by an individual, which was recorded with the date. The observers can enter an observation on same date, and they can enter multiple observations each day. He wanted to determine the average over a period, and these were the calculations he created:

The solution was quite simple for this type of analysis. I suggested to him to use AVERAGEX instead of the logic he made. I recommended to him some of my tutorials around iterating functions especially on AVERGEX.
I also shared to him the tutorial on how to calculate the total of averages. The important thing to learn here is to know what you want to iterate through with your iterating function. You need to understand how AVERAGEX function works.
Using SUMX With IF Function
Another example scenario, which shows that iterating functions are key to use, is this forum post. The member had a column with 0 & 1, depending on specific Intern criteria. He needed to retrieve an amount from column X if it’s 0 and an amount from column Y if it’s 1. He had difficulty creating the row by row verification context in Power BI. This was the data he was working with:

And this was his calculation in Excel:
IF(CellA1=1 ; True ; False)
In this case, this Excel logic he made can and should be completed in a measure in Power BI. This is where the power of iterating functions come in. This is the sample formula I gave him:

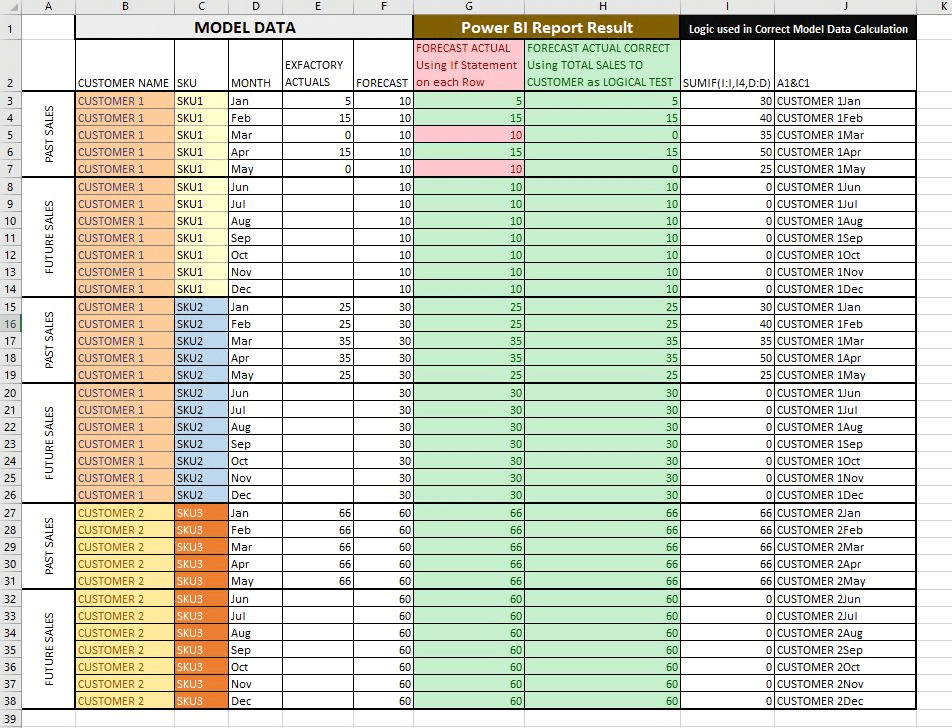
Here I use SUMX with the IF function, but you can also use FILTER with CALCULATE in a similar way. Another example of how and when to use SUMX and IF functions is this forum post, where the member was trying to create a combined plan/actual forecast for the rest of the year. This is how he’d do it in Excel:

His concern was that the Annual Total was incorrect. The formula he made assumes that ExFactory has a value for the year, taking that value rather than calculating each month, and then summing up all the Monthly results.
After I reviewed the data he made in Power BI, I found out that the issue was not only on the formula, but also on the fact that the member used calculated columns instead of measures for his calculations. My suggestion, as I always mention when working with DAX, was for him to start from the simplest measures such as this one:

From this, he can then use iterating functions so that he can work through each row and run some logic.


Iterating functions allow you to iterate through a table, whether a virtual or a physical table and run logic at each row.
When logic is completed at every row, the final calculation is completed. Once you understand this, you’ll find it easy to incorporate iterating functions into your calculations.
Another key thing to note is to keep things simple, not only with your calculations but also with your models. This will make things easier for you to get the results you want from your analysis using iterating functions. Check out my course on data modeling to learn more about organizing your models correctly and effectively.
Iterating Functions And The Model Structure
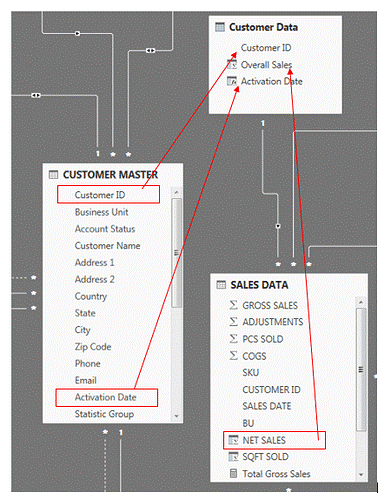
I have encountered numerous concerns raised in the forum with problems primarily caused by models that are too complicated. Here’s one example, wherein the issue could be just solved easily by using iterating functions, but the model set up was incorrect in the first place.
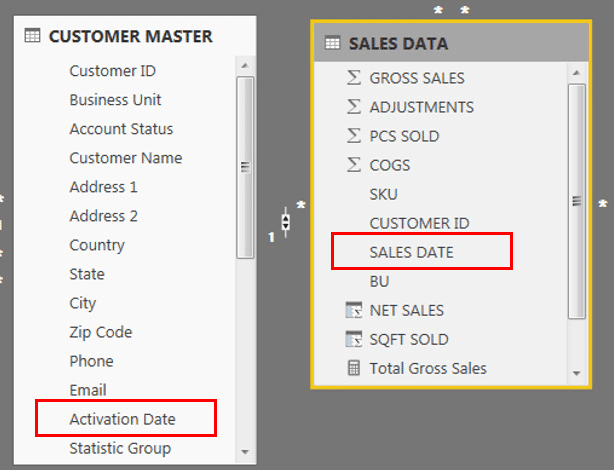
The member wanted to establish control over activated accounts but have no sales, counting the accounts, and being able to identify the customers’ names.

In this scenario, it should be just a combination of the CALCULATE and FILTER functions, or use iterating functions, such as SUMX, COUNTX, and AVERAGEX. Understanding iterating functions can help you solve issues like this at a row level. However, when I looked at the model, the overall set up really concerned me.

There are some relationships that don’t seem right, and the lookup table was not necessary. The member had to re-organize the model first to get the correct formula to work.
***** Related Links*****
Working With Iterating Functions In DAX
Iterating Functions In DAX Language – A Detailed Example
Using Iterating Functions SUMX And AVERAGEX In Power BI
Conclusion
The examples I highlighted in this post are questions raised by members in the Enterprise DNA Forum. These are common scenarios when using DAX functions in Power BI, wherein calculations have erroneous results because the functions used are incorrect. The formulas should have iterating functions that are used in the correct way.
Moreover, the data model can also contribute to the issue of the calculations when there are relationships in the model that aren’t working. This usually happens when the model is too complicated and not set up well. After you sort this out, you can then work on your formulas with the correct DAX combination.
As I always recommend, it’s important to get a good understanding on the concepts of DAX functions in Power BI, especially iterators. I hope you could learn from this post and implement it in your own Power BI reports.
All the best!
Sam

***** Learning Power BI? *****
FREE COURSE – Ultimate Beginners Guide To Power BI
FREE COURSE – Ultimate Beginners Guide To DAX
FREE – 60 Page DAX Reference Guide Download
FREE – Power BI Resources
Enterprise DNA Membership
Enterprise DNA Online
Enterprise DNA Events


