
This tutorial will feature the best practices for DAX calculations when developing reports in Power BI. You can watch the full video of this tutorial at the bottom of this blog.
DAX calculations are one of the four pillars of Power BI development. In this post, you’ll learn tips on how to maximize your DAX in order to obtain correct and valuable insights easily.

DAX Editor Tips
Using a DAX calculation is easier with these DAX editor tips.
The first tip is to adjust the zoom of your code.
When editing a code, it’s helpful to set the size of the formula to make them clearer to see.
To do this, open the measure you want to adjust. Hold CTRL and use the mouse wheel to change the zoom level.
The zoom level stays even if you open another measure.
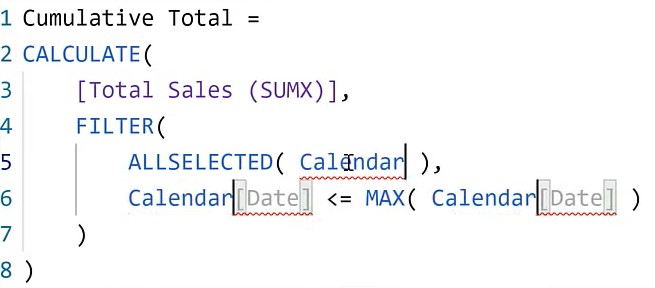
The next tip is how you can easily replace a name inside your code.
Again, open a measure and select the word you’d like to change. Hold SHIFT+CTRL+L and then type the new word.

In this example, the word Dates has been changed to Calendar simultaneously.
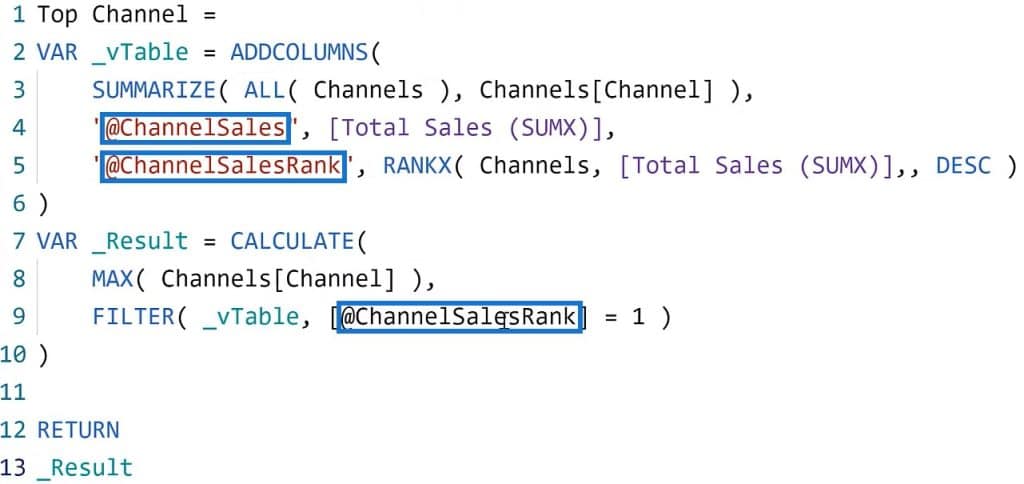
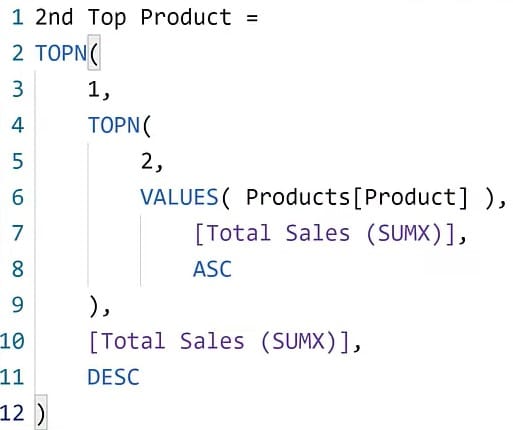
The final DAX editor tip is to use the “@” sign as a prefix in noting added columns in a virtual table.
This ensures you’ll choose the correct column and subsequent lines.
Here is an example measure. You can see that there’s an “@” symbol before the added columns.
Format DAX Calculations In Power BI
Formatting your DAX codes makes them understandable and readable to people.
If it’s not formatted, it’s not DAX.
The DAX Clean Up Tool is a tool in Enterprise DNA that helps format your code.
To open the tool, go to the Enterprise DNA website and click on Resources.

Next, go to the bottom of the page and click DAX Clean Up.

Copy your code from the DAX editor in your Power BI report and paste it into the DAX Clean Up Tool. Then, click Format.
Once that’s done, copy the formatted code back to the editor in your Power BI report.
Also, if you have complex functions inside your code, it’s best to put explanations as comments. This helps other people understand the purpose of the functions used.
Specify Names And Variables
When using variables in your DAX code, use an underscore as a prefix for the variable name to help choose the correct value in subsequent lines. This reduces the list presented by IntelliSense.
In this example, you can see that when you put an underscore it only presents two options.
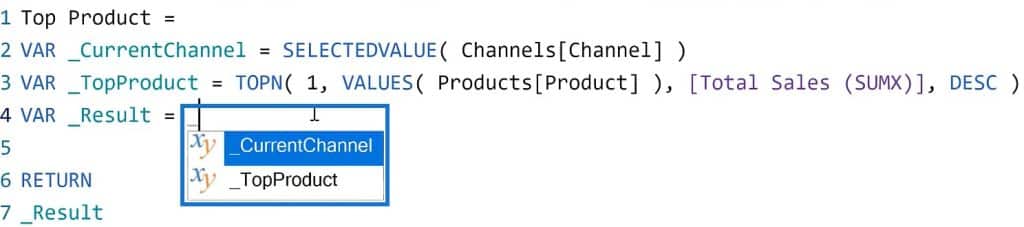
Another technique is to use the RETURN RESULT construct. This makes it easier to incrementally develop and debug your DAX code.
Having similar column names in multiple tables happens frequently so you need to be specific with naming them.

This is an example of tables that have the same column names:
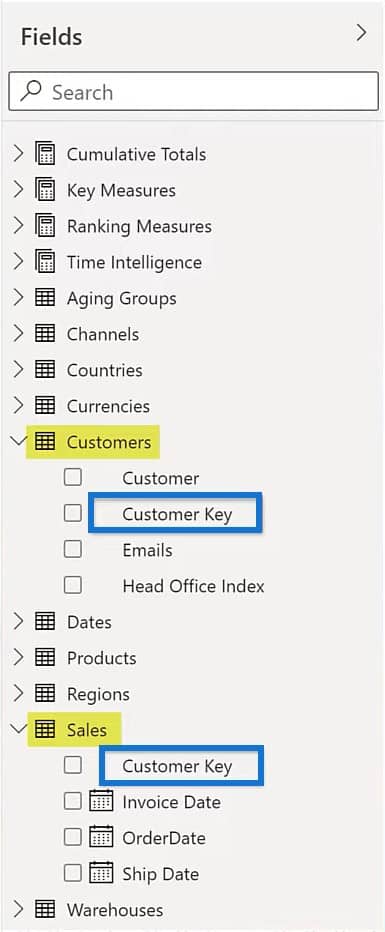
Even if the columns contain the same data, you should always qualify column names to get your desired results. However, you can’t do this for measures because they can be moved from one table to another. Qualifying your measures will make your DAX fragile.
Understand DAX Functions In Power BI
CALCULATE Function
CALCULATE is the most important DAX function. This function doesn’t perform a calculation but rather changes the context of your calculation.
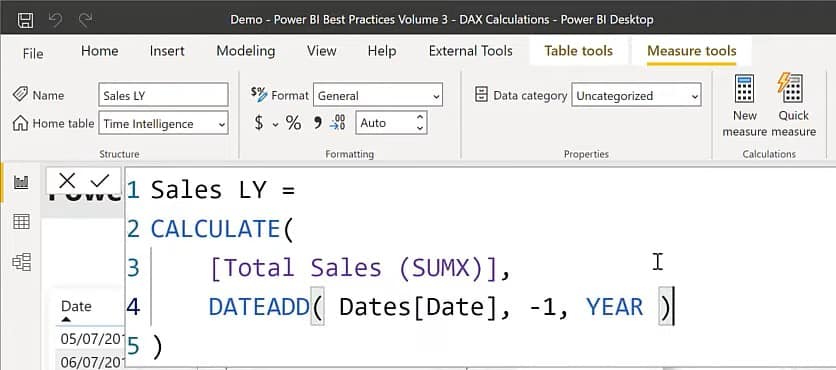
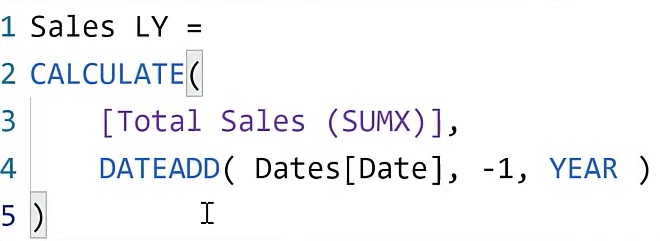
In this example, the CALCULATE function is used to change the context of the calculation of Total Sales to one year before the current evaluation.
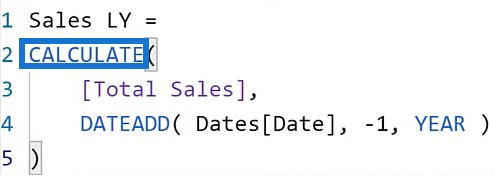
One of the key concepts in writing a proper DAX code is to understand how CALCULATE can be used to manipulate the context.
There are many time intelligence functions available in DAX. DATEADD is one of the most versatile DAX functions.
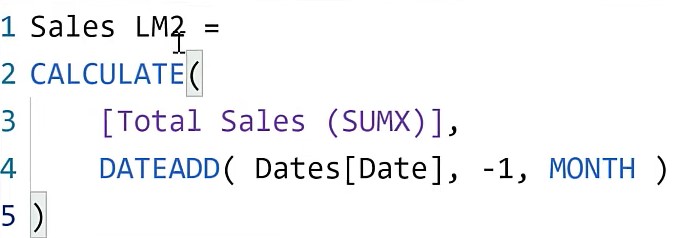
Once a measure is written using DATEADD, you can easily copy and paste the code and make minor changes to create new measures.
This is an example of a Sales Last Year measure.
Copy the whole code and paste it into a new measure. You can change the name and replace a different timeframe.
DIVIDE Function
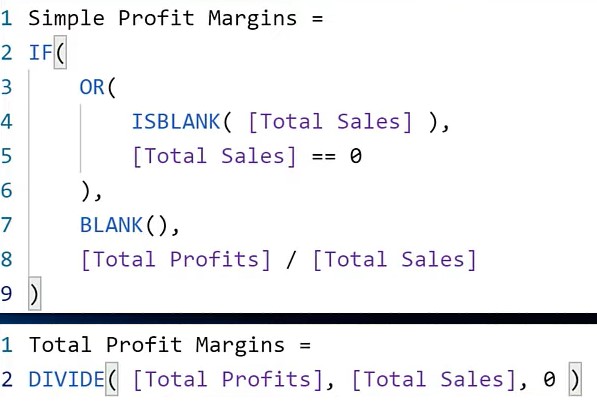
Division in Power BI can be done in many ways.
A DIVIDE function handles all cases including a Divided by Zero case. It also permits you to add an alternate result.
SWITCH And TRUE Functions
Another best practice to make your codes easier to understand is to use a SWITCH TRUE function.
You can use it if you have multiple conditions to evaluate. It also gives you the flexibility to modify your codes and adjust or add new conditions.
This is a Selected Metric measure.
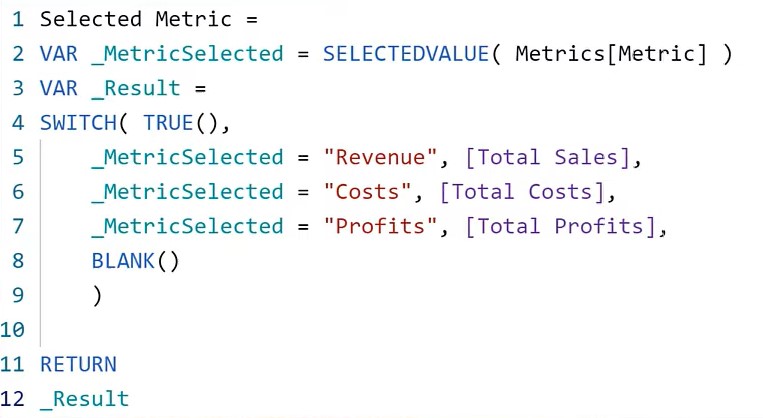
It has different measures returned for different selections. This shows the values of the selected metric in the selection slicer.
Virtual Tables In Power BI
Understanding virtual tables is a real benefit when developing DAX solutions.
They can be helpful especially when combined with variables. They also help compartmentalize the complexity of your code and make it much easier to see.
When constructing a virtual table in your DAX code, use SUMMARIZE to group the columns into a base table and then surround it with the ADDCOLUMNS construct to add columns to the base table.
Make sure to use the “@” sign prefix on columns added by ADDCOLUMNS to prevent ambiguity and to ensure that you choose the correct virtual table column.
You can use DAX Studio or Tabular Editor to aid in the development of your virtual tables so that you can easily see their contents.

Relationships In Power BI
In a pair of tables in Power BI, there can be many relationships. You can have many inactive relationships. However, there can only be one active relationship.
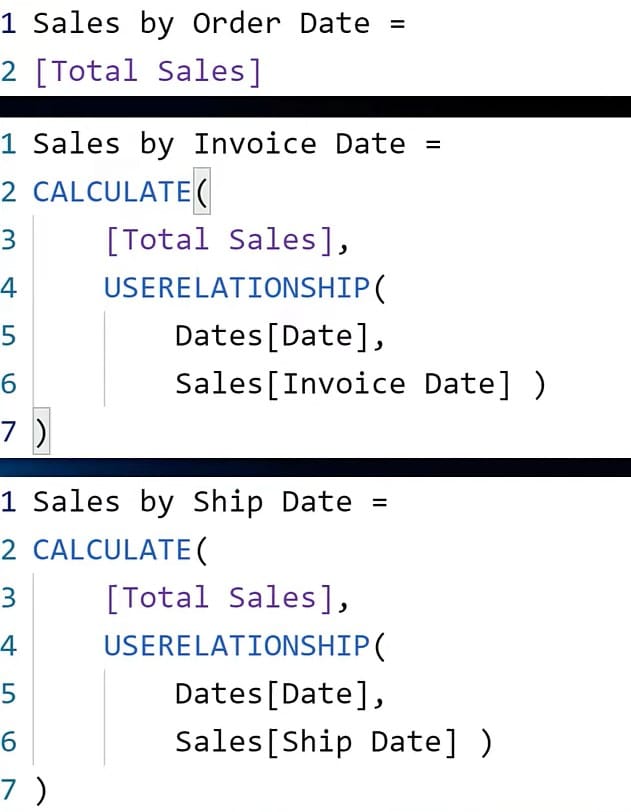
The DAX code will use the active relationship by default but it can use a particular inactive relationship through the USERELATIONSHIP function.
Here are brief sales scenarios:
You can see that there are many relationships between the Date column of the Date Table.
The Sales by Order Date is the active relationship; the Sales by Invoice Date is the inactive relationship.
If you hover over the solid line in the data model, you’ll see the active relationship between Date and OrderDate.
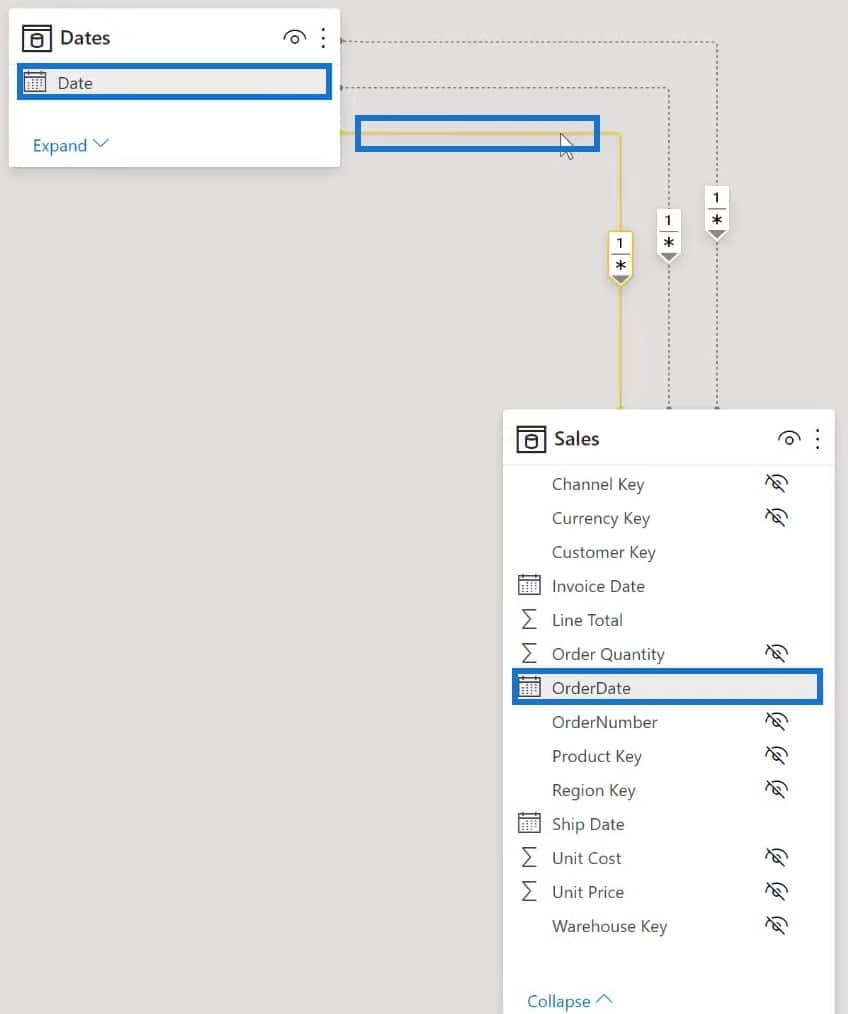
The dotted lines represent the inactive relationships between Date, Invoice Date, and Ship Date.
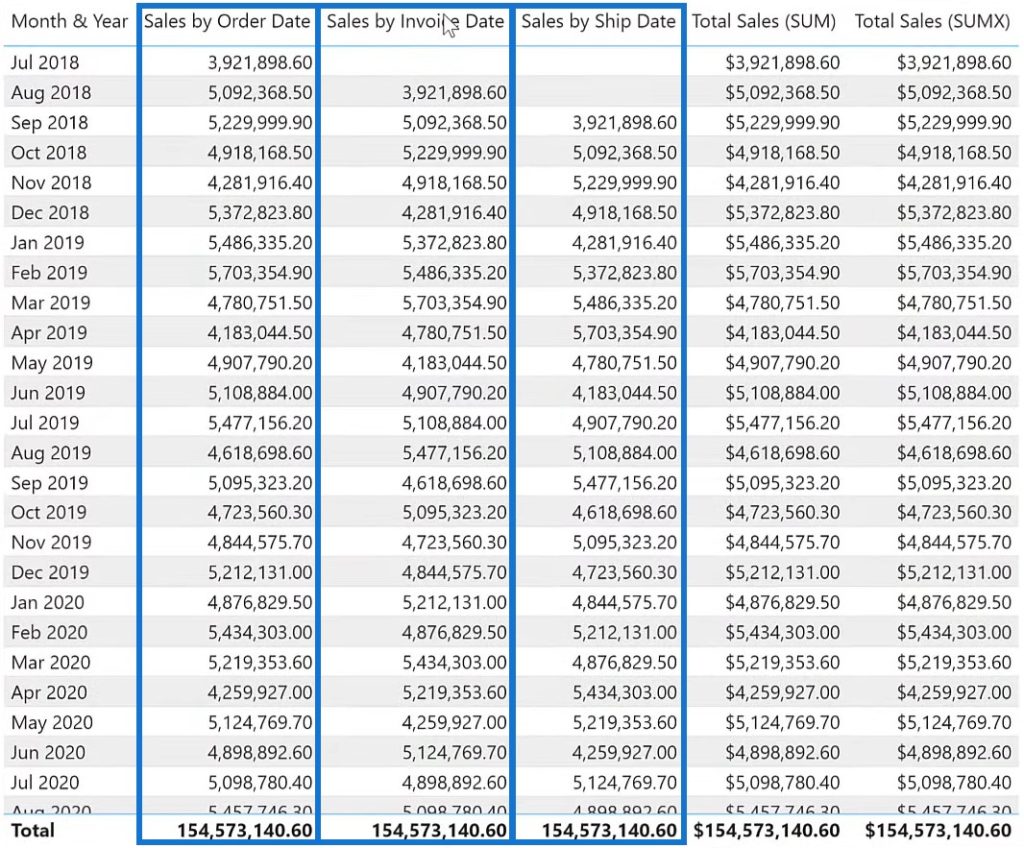
Through the USERELATIONSHIP function, you can see the difference between the Sales by Order Date, Sales by Invoice Date, and Sales by Ship Date columns in the report.
Measures And Calculated Columns
In Power BI, using measures over calculated columns is recommended.
Measures are like virtual calculations that sit on top of your model. When you use measures, the calculation is only done when it is used in a visual.
Meanwhile, calculated columns are part of your model. This means that the calculation is always done every time the files are refreshed.
Calculated columns can be used in slicers and can increase the physical size of your data model compared to measures.
The most valuable technique in Power BI is measure branching and using measure groups.
When you perform complex calculations, measure branching modularizes your code. It makes them much easier to read and understand.
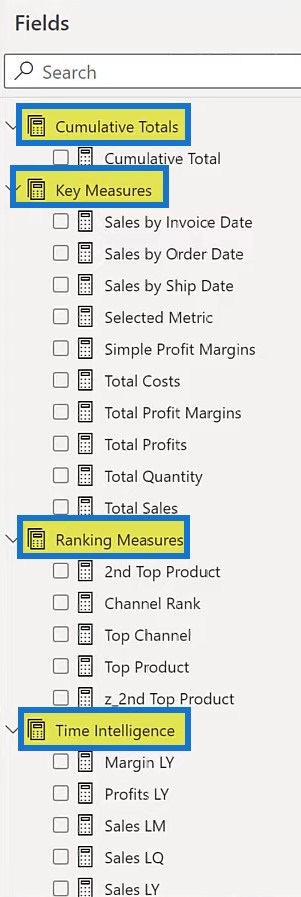
Using a measure group is also advantageous in keeping your measures. It helps make your report look clean and it organizes your measures making them easier to locate and understand.
Context Of DAX Calculations In Power BI
One of the main strengths of Power BI is the context. It’s also one of the concepts that’s difficult for Power BI developers to understand.
Context is the environment in which a calculation is performed.
There are 3 contexts in DAX calculations:
- Evaluation Context
- Row Context
- Filter Context
Not fully understanding contexts is often the cause of difficulties during report development.
Functions Of DAX Calculations In Power BI
There are two main classes of functions in DAX and Power BI:
- Aggregation Functions
- Iteration Functions
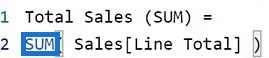
Aggregation functions aggregate the values of a single column using SUM, MAX, MIN, etc.
Iteration functions compute an expression for each row in a table. They’re also known as X functions. Examples of iteration functions are SUMX, MAXX, MINX, etc.
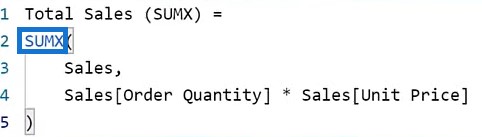
They have two parameters: a table to iterate over, and the expression that performs the calculation which can use multiple columns from the base table or from related tables.
***** Related Links *****
Data Loading And Transformation Best Practices
Data Modelling In Power BI: Tips & Best Practices
Calculated Columns Power BI: Tips & Best Practices
Conclusion
These best practices for DAX calculations in Power BI will help you develop your reports. The techniques discussed in this tutorial provide a good background on the DAX functions, codes, and context that you’ll encounter when creating Power BI reports.
If you find it hard to make a clean and organized report, you can use and apply these best practices. These will surely help you obtain correct results and improve your development skills in Power BI.
Greg
[youtube https://www.youtube.com/watch?v=NtZnlOP3MoY?rel=0&w=784&h=441]


