I’m going to talk about the solution I came up with for the 7th Problem of the Week. The problem required a dynamic report that uses multiple DAX calculation groups. You can watch the full video of this tutorial at the bottom of this blog.
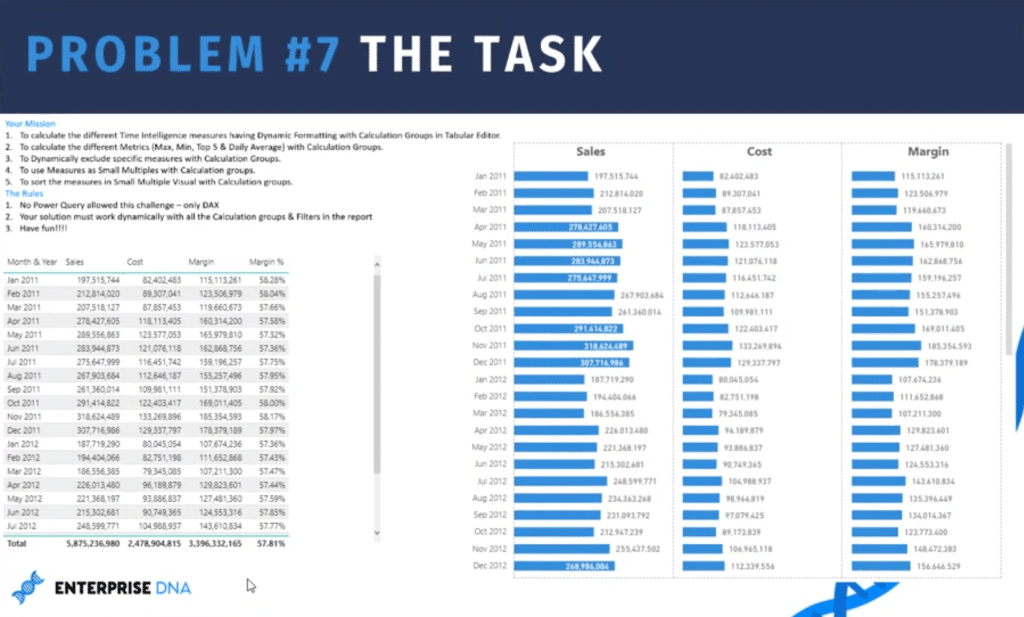
The Problem of the Week happens every 1st and 3rd Wednesday on the Enterprise DNA Forum. The problem posted on the 1st week requires a DAX-based solution, while the 3rd week problem asks for a Power Query-based one.
Calculation Groups Used
To solve problem #7, I used three DAX calculation groups all in all.
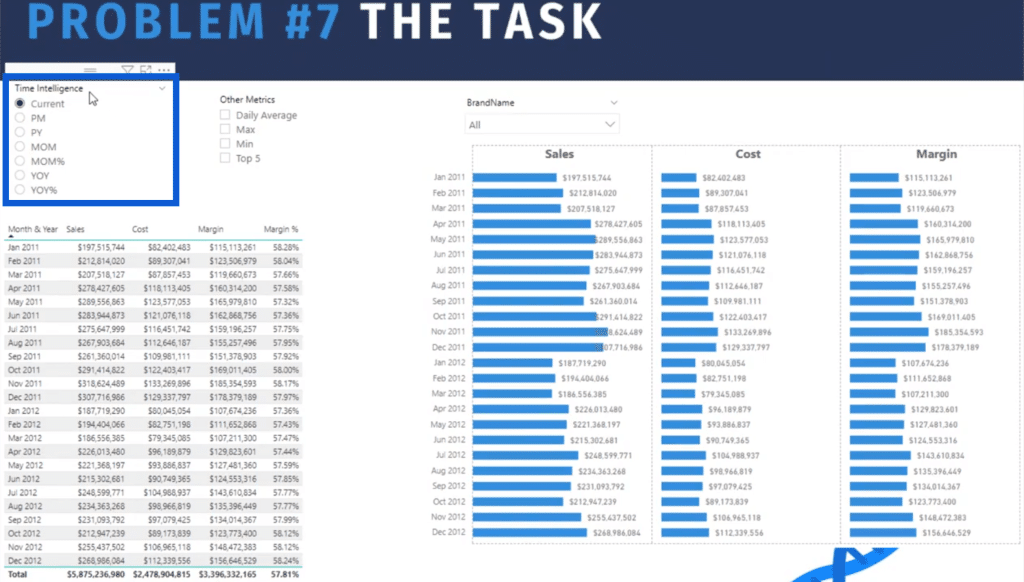
The first one was the Time Intelligence group, which I can set to current, previous month, previous year, month on month, month on month percentage, year on year, and year on year percentage.
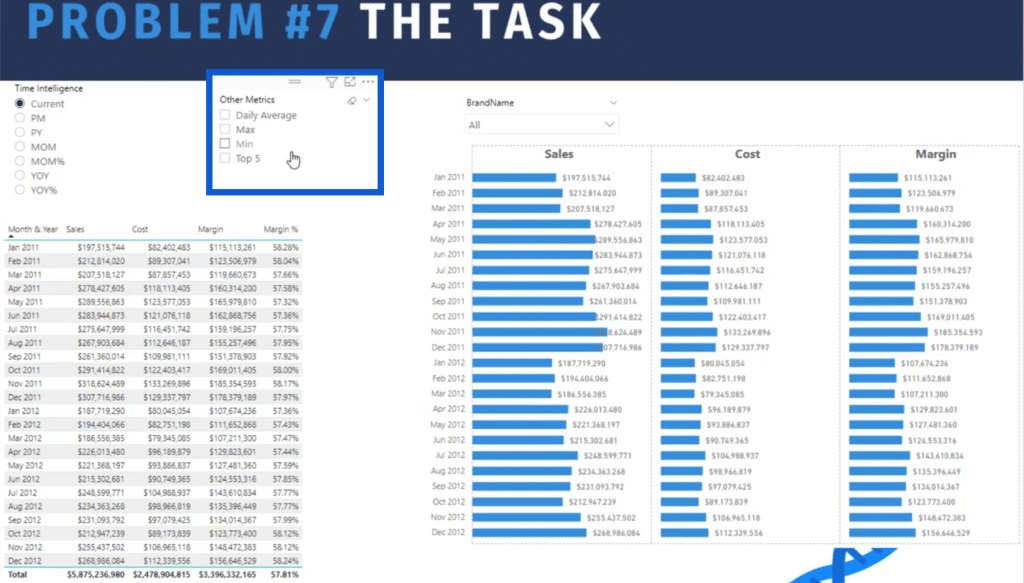
The next one is Other Metrics. This includes the daily average, max, min and top 5.
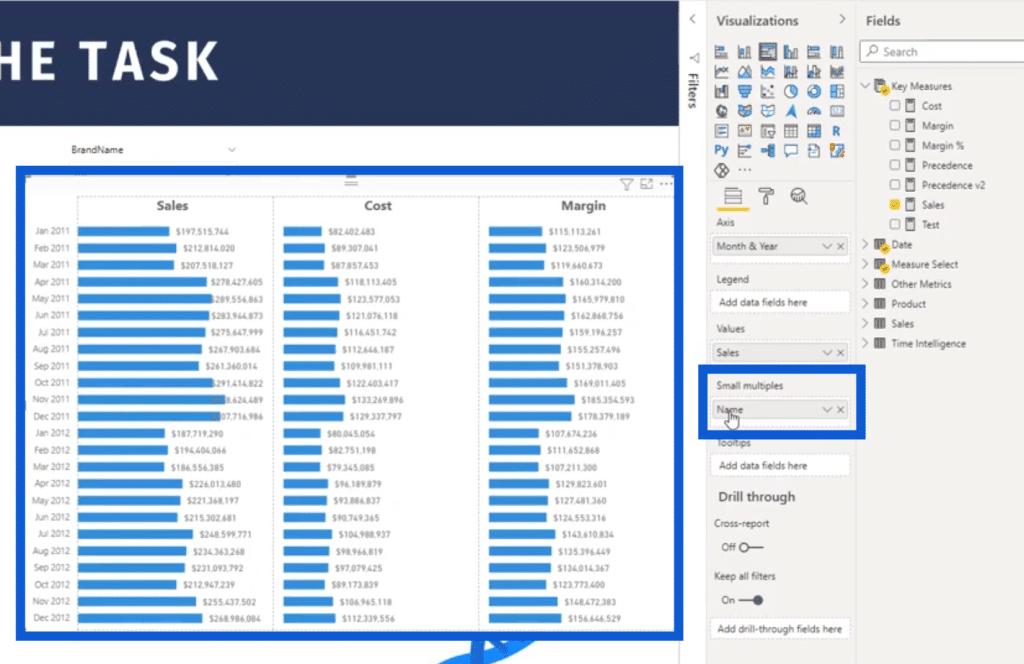
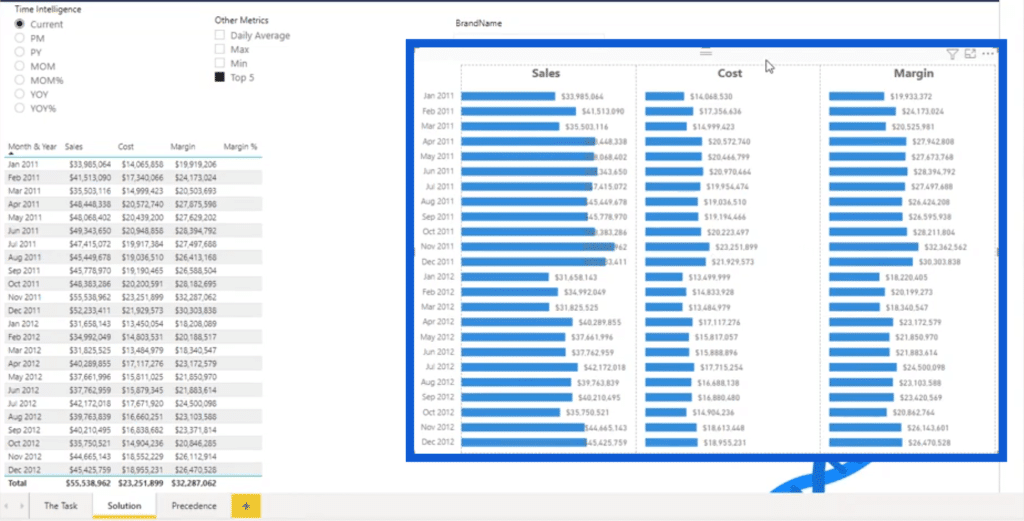
The last of the DAX calculation groups contains measures in the form of small multiples. These measures include Sales, Cost and Margin.
Time Intelligence Calculations
Let’s look at how I created Time Intelligence calculations first.
Go to the External Tools ribbon and open up the Tabular Editor.
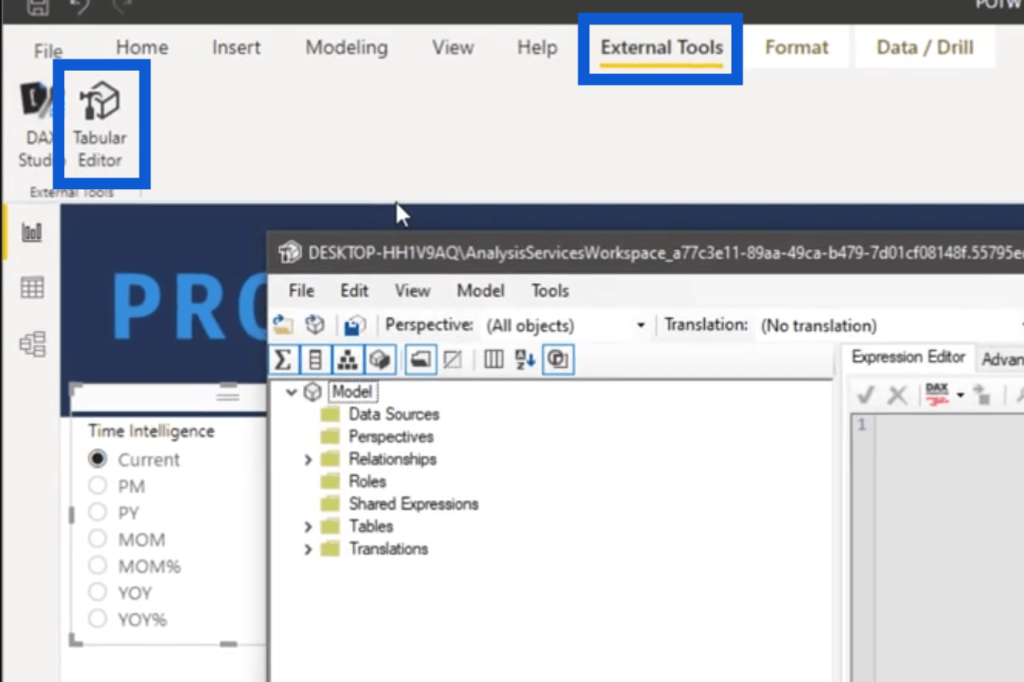
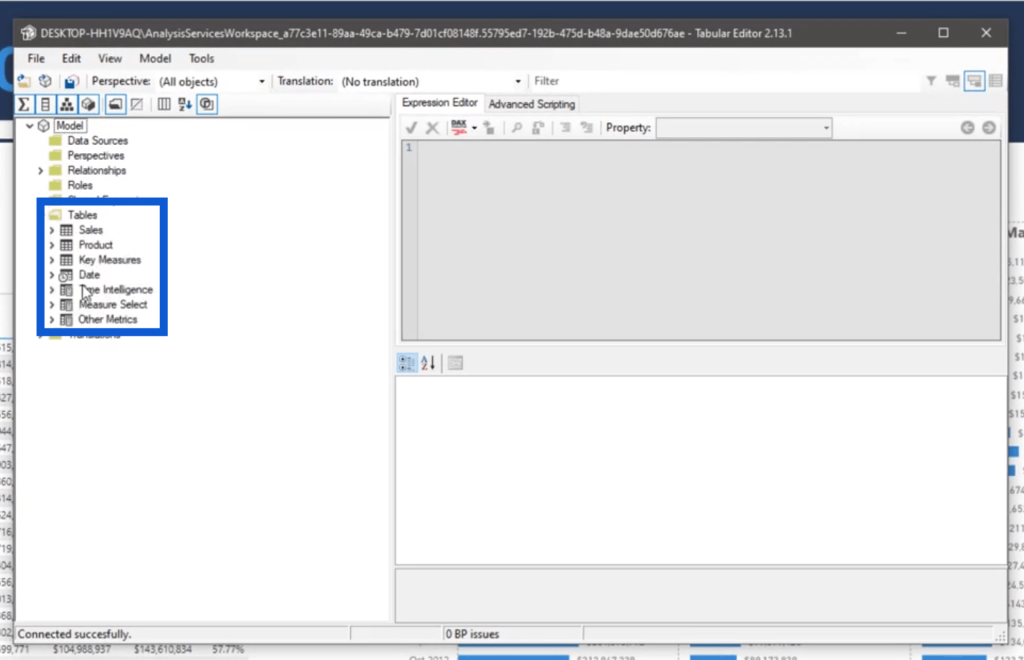
Then, look under Tables. You’ll see Time Intelligence under it.
The first one under Time Intelligence is the current value. The measure behind that shows SELECTEDMEASURE, which is one of the types of DAX calculation groups.
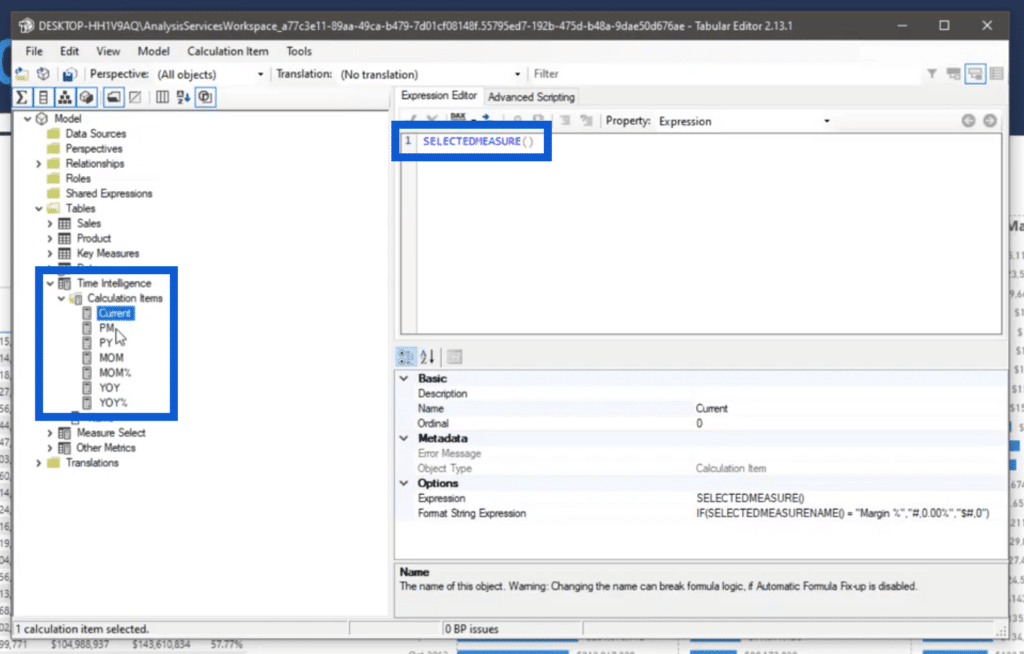
This simply means that if nothing is selected, then we want the current value to show the sales cost, margin, and margin percentage in our report. These measures have already been created and can be found under our Key Measures.
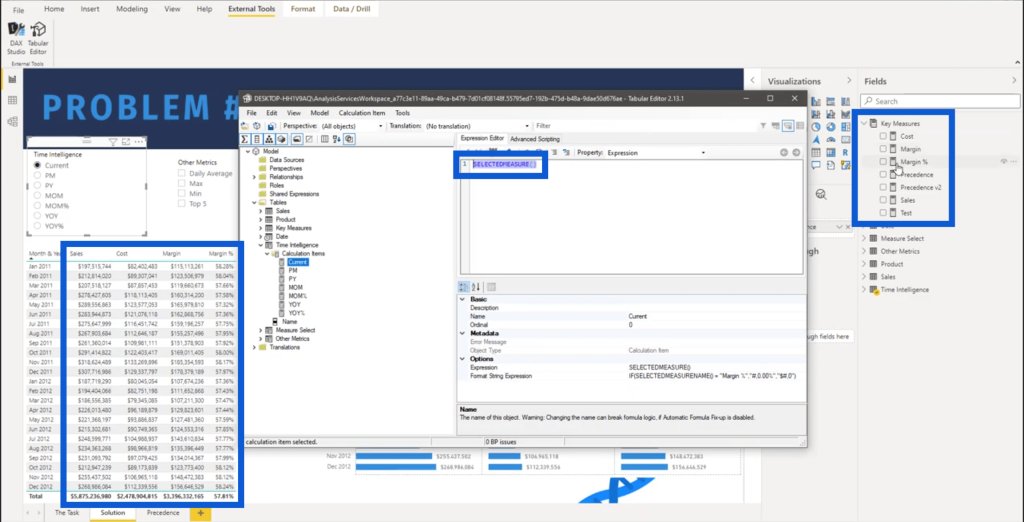
The second calculation item under Time Intelligence is the previous month. It starts off with CALCULATE, then uses SELECTEDMEASURE again. It then references DATEADD and asks for the specific DATE, then subtracts one MONTH.
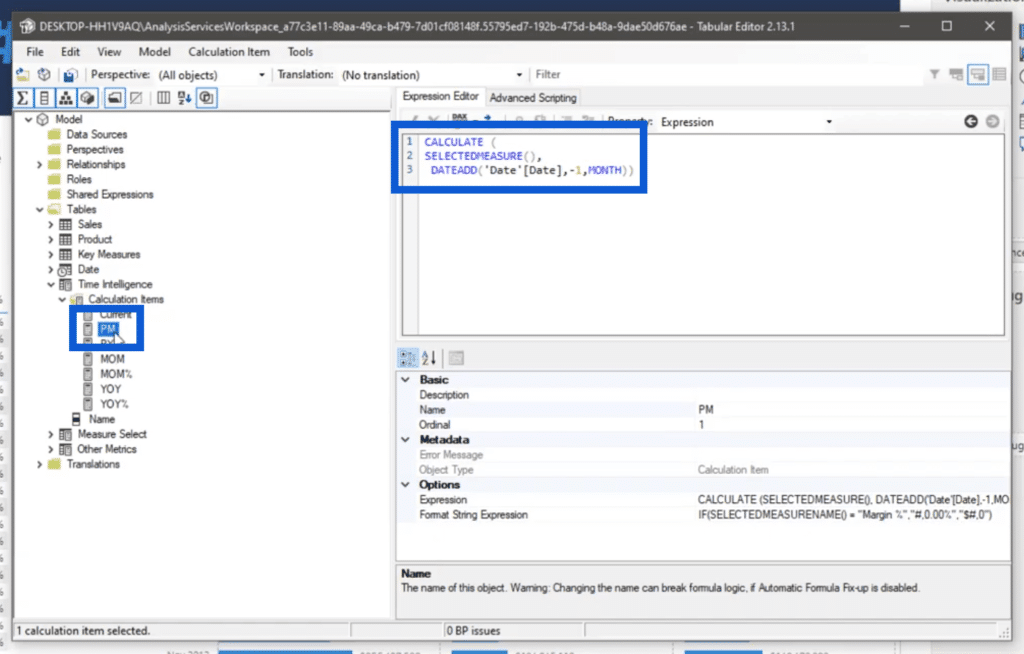
The measure used for Previous Year is similar to the one used for Previous Month; only this time, it asks for the YEAR.
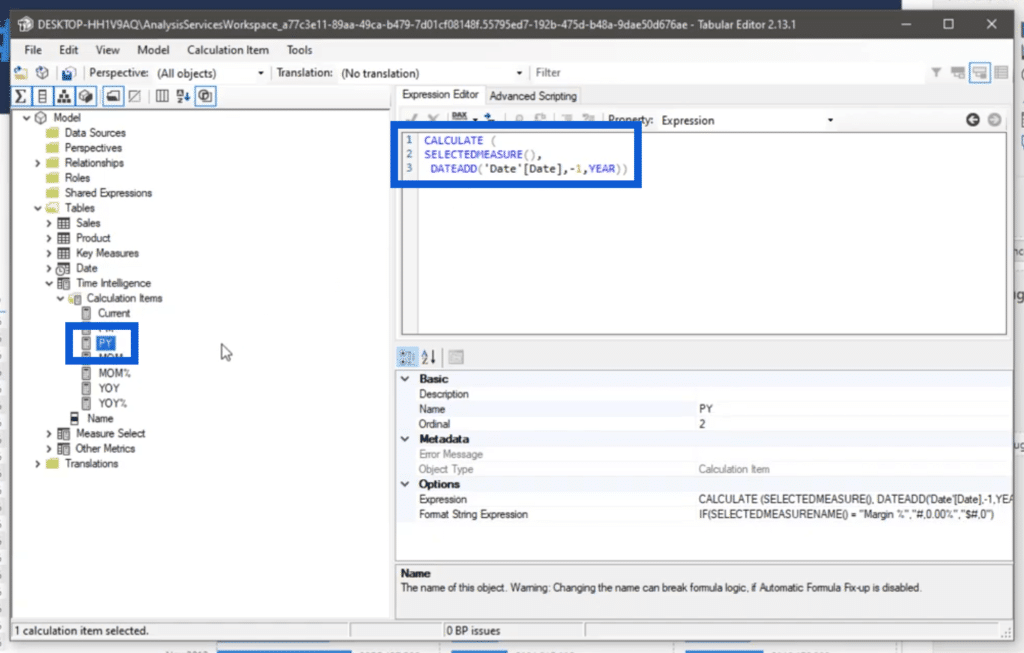
You can see Month over Month here as well. It shows almost the same measure as Previous Month, but this time, it starts off with another SELECTEDMEASURE.
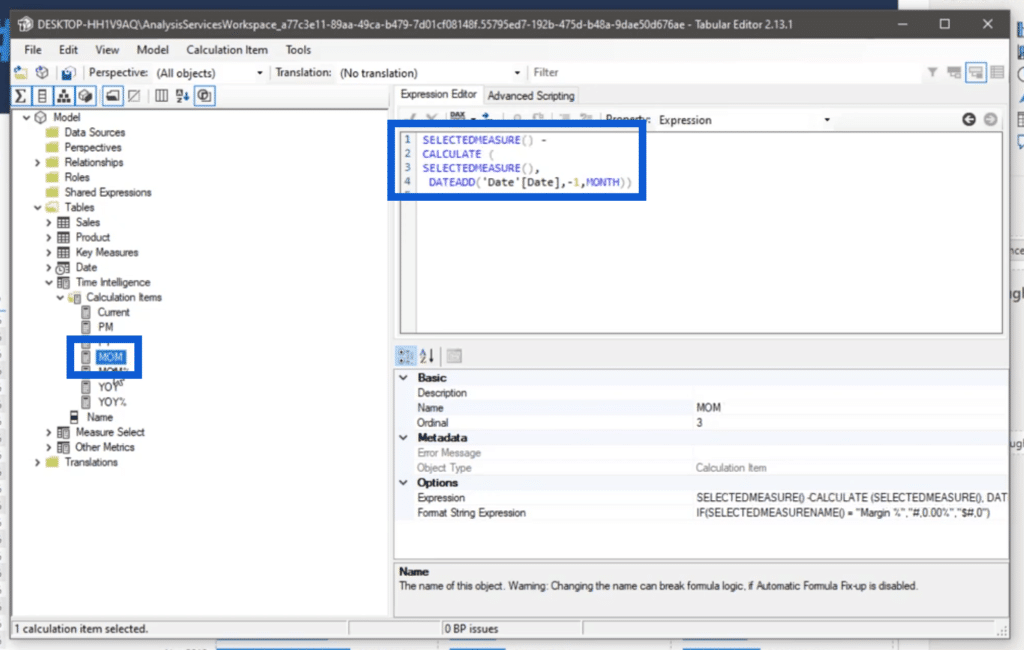
You can imagine how the other measures here would look based on the pattern of the ones I’ve shown you earlier. We need to apply dynamic string format with the help of our calculation items. This will play a huge role in our DAX calculation groups.
Applying Format String Expression
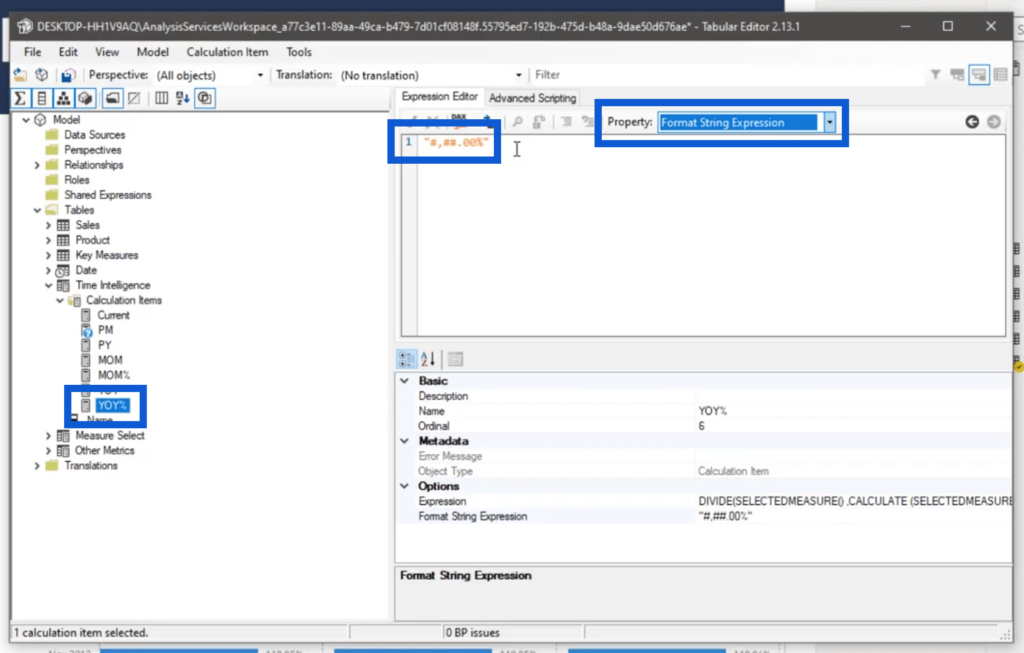
Let’s look at the measure for Previous Month. To apply dynamic formatting, just go to Property, then click on Format String Expression on the dropdown menu.
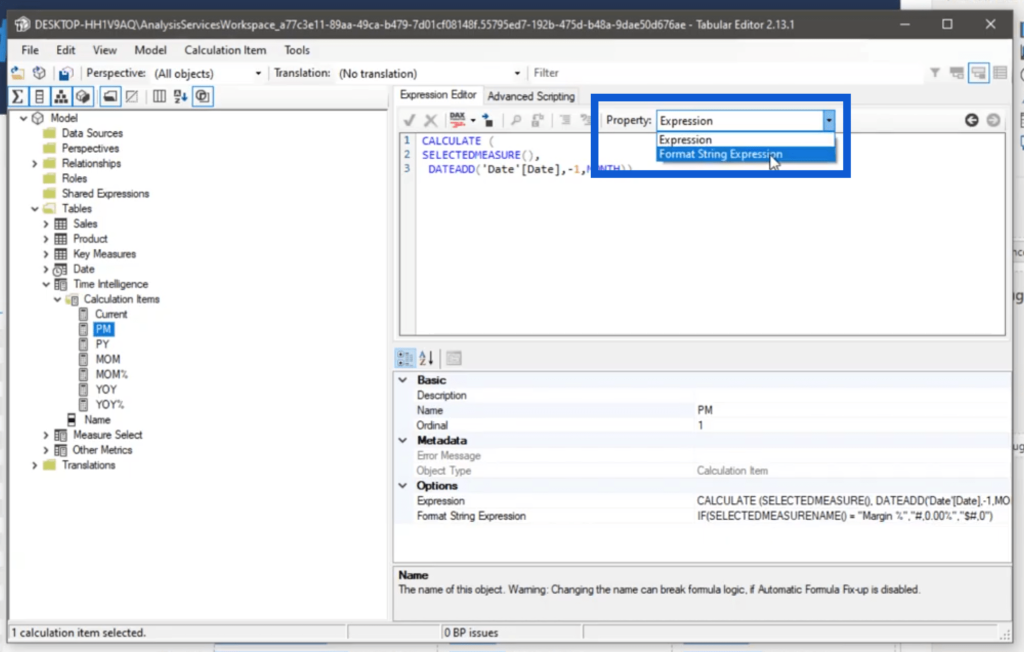
You can also go into the bottom pane and look under Options, where the Format String Expression is displayed. You can simply copy that code and paste it on the Expression Editor.
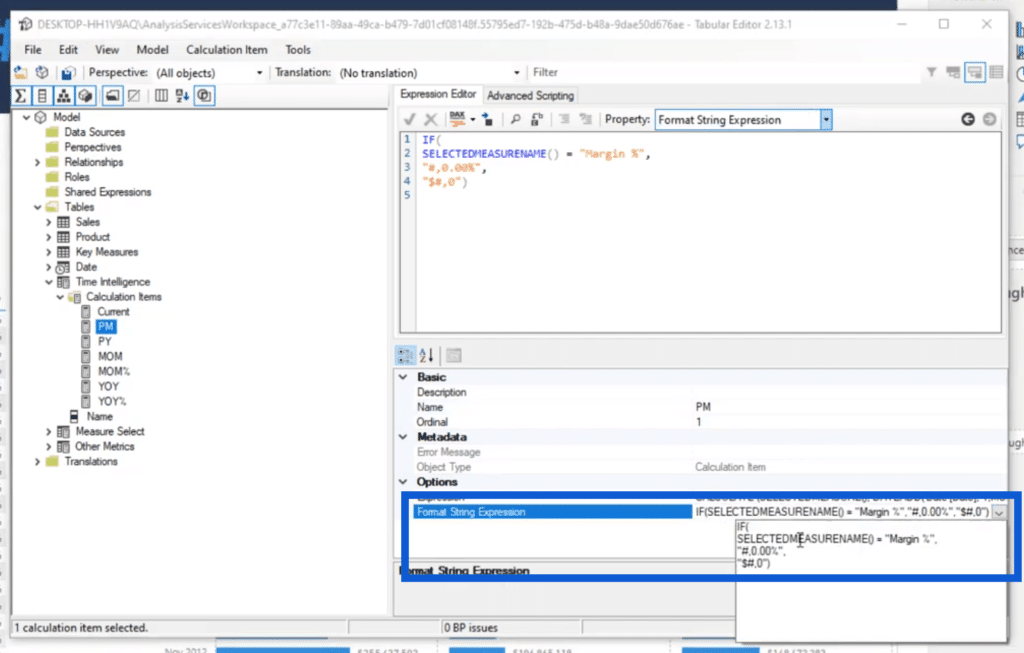
What happens when you use Format String Expression?
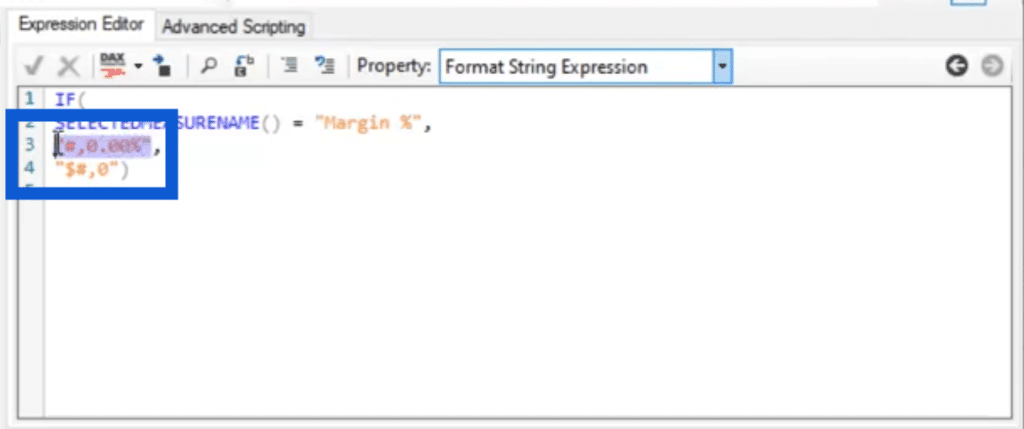
Looking at the measure below, you’ll see that I used a new function, which is SELECTEDMEASURENAME.
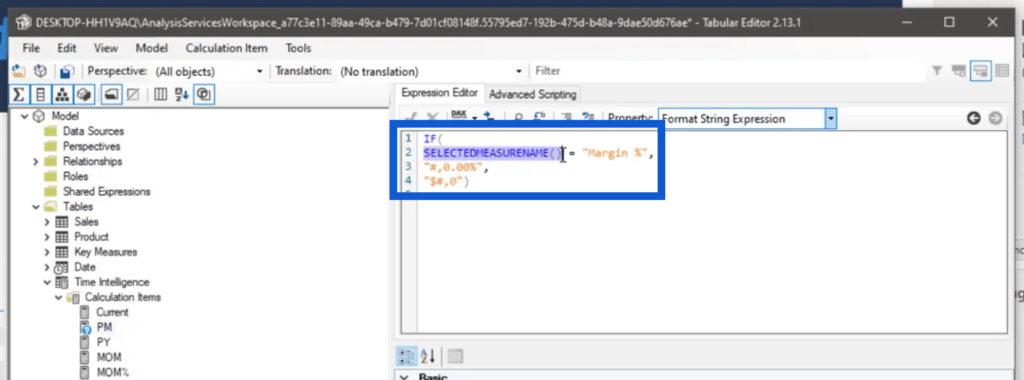
What the string format does is it refers to the measure that has already been created in the report, which is Margin Percentage.
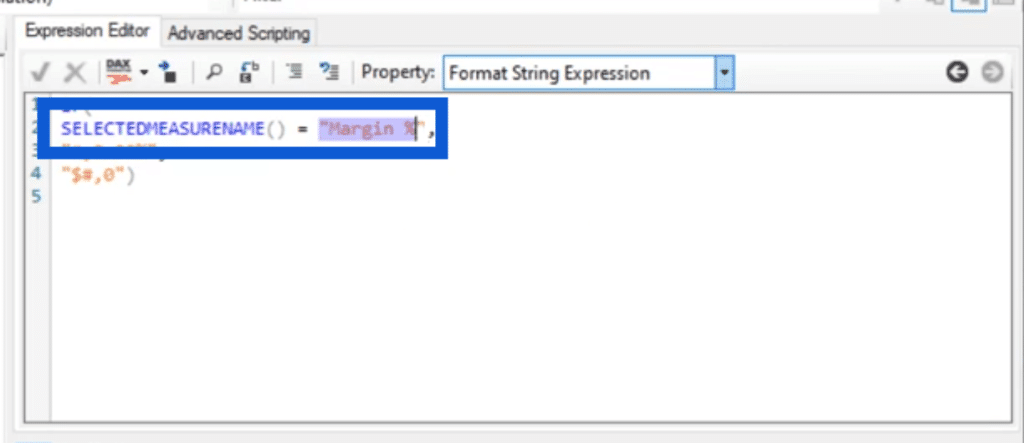
It shows here that if the measure refers to margin percentage, then the percentage format is applied. Otherwise, the dollar string format is applied.
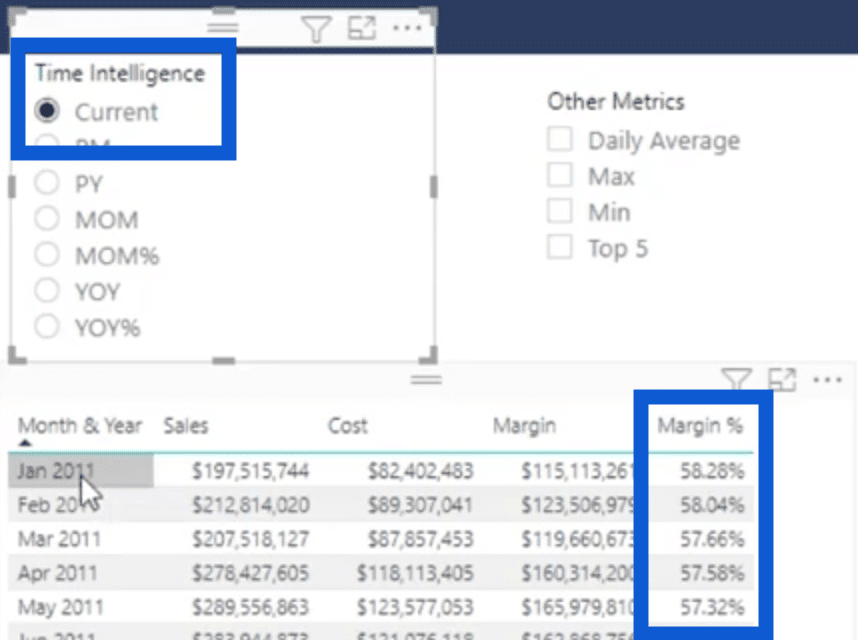
Going back to the report, when we select the current value, the margin percentage applies the percentage string format.
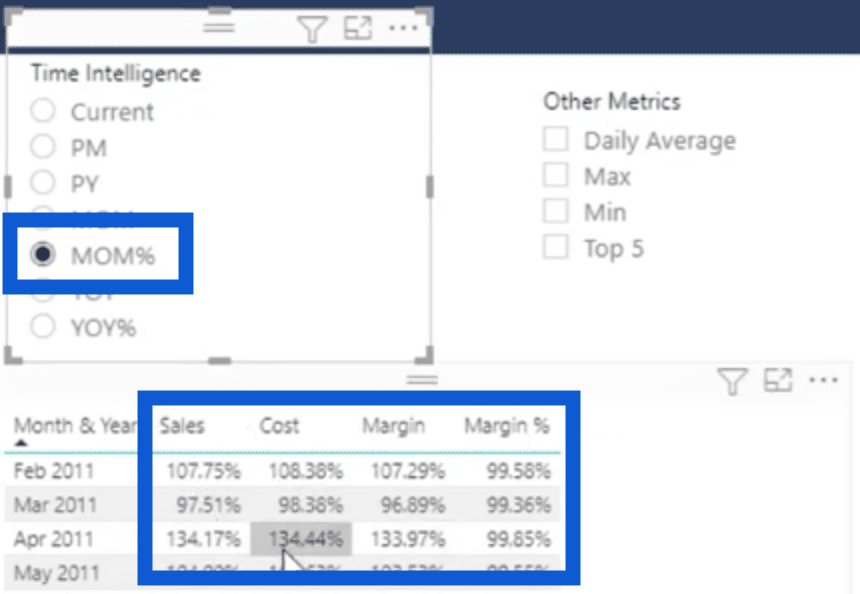
If I click on month over month, it is dynamically showing the percentage string format.
To see why this is happening, if we go to the calculation item for month over month percentage and click on Format String Expression, it shows that it’s applying a percentage.
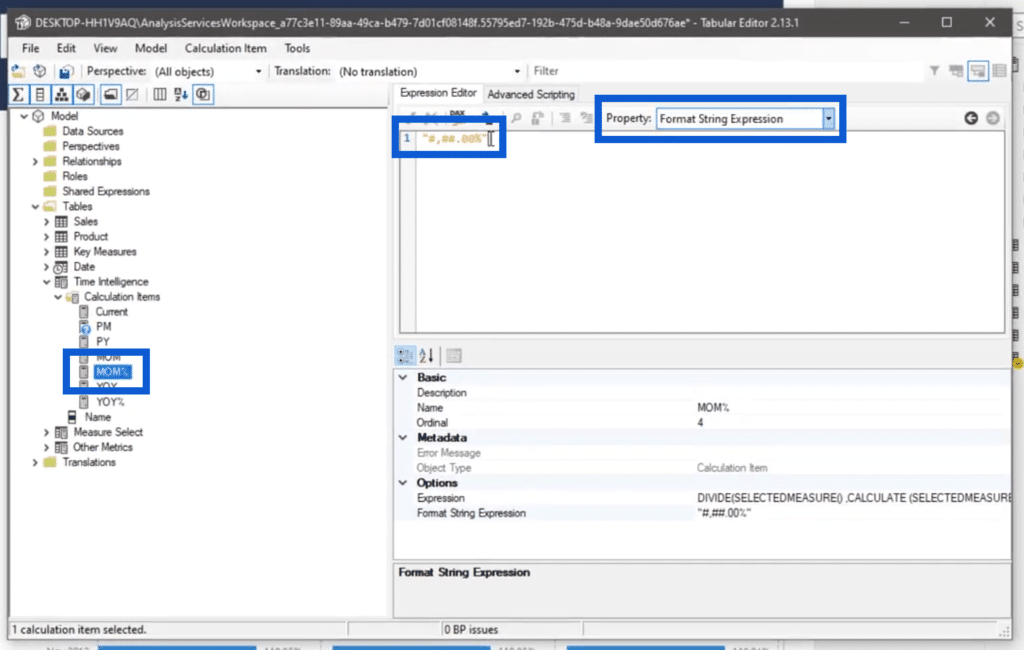
This is the same thing I did for the year over year percentage.
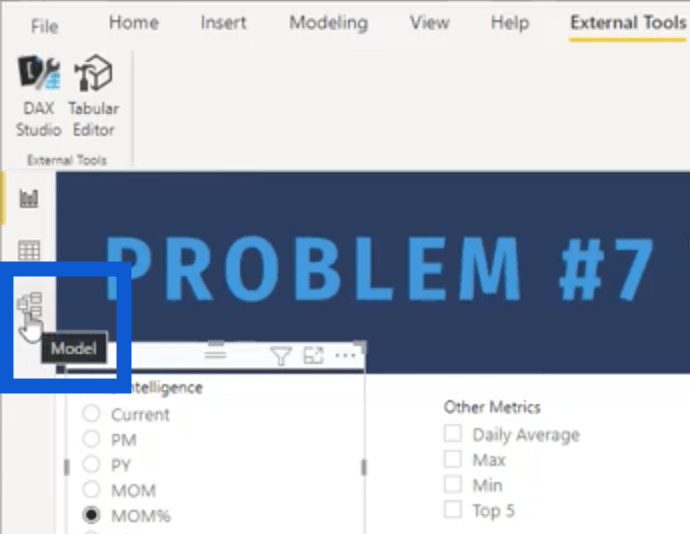
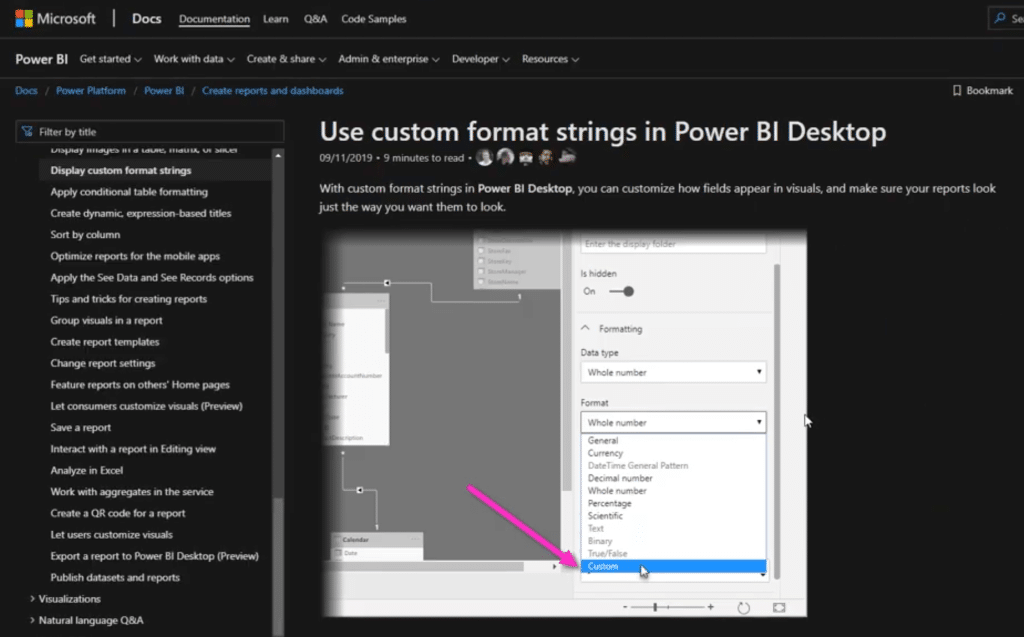
If you want to find out more about the various custom formats, you can go to the Model view.
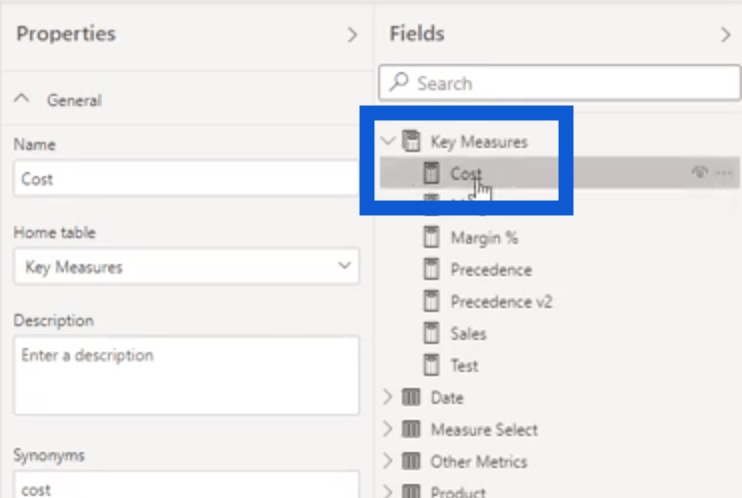
Click on the measure.
Then, select Custom.
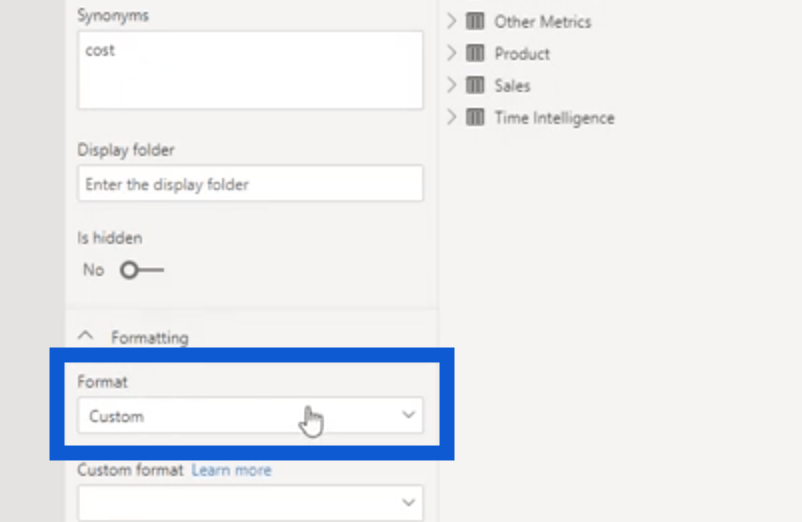
You can also see a link that says “Learn More” under Format. If you click on that, you can see the indexes available for power BI.
Calculation Groups For Other Metrics
The first option under Other Metrics is daily average, which gets the daily average within an entire month.
Below, for example, it shows the total for the month of January in 2011, which is $197 million.

When I clicked on daily average, it now shows 6.3 million for Jan 2011.

Max is the next item under Other Metrics. It shows the maximum value or sales for any particular month. So if I click on Max, the Jan 2011 entry will show $4.9 million, which was the highest sale made in a specific day in January.

Of course, clicking on Min will do the opposite and will show the lowest sale on any day within that month. In this case, it shows $3.8 million.

As for Top Five, it will determine the top five sales within the month and add them all. In the case of Jan 2011, the total for the top 5 sales for the month is $33.9 million out of the total of $197.5 million for the entire month.

Let’s go to the Tabular Editor to check the measures under other metrics.
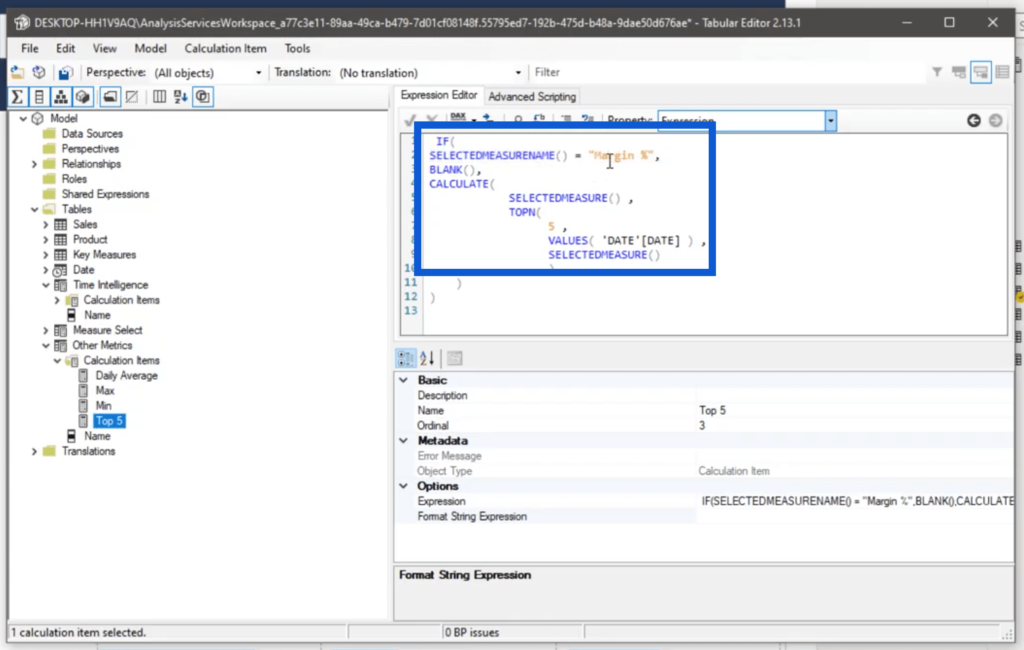
When you look at the Daily Average, you’ll see SELECTEDMEASURENAME once again. This also shows that if the measure is a margin percentage then it should be left as BLANK.
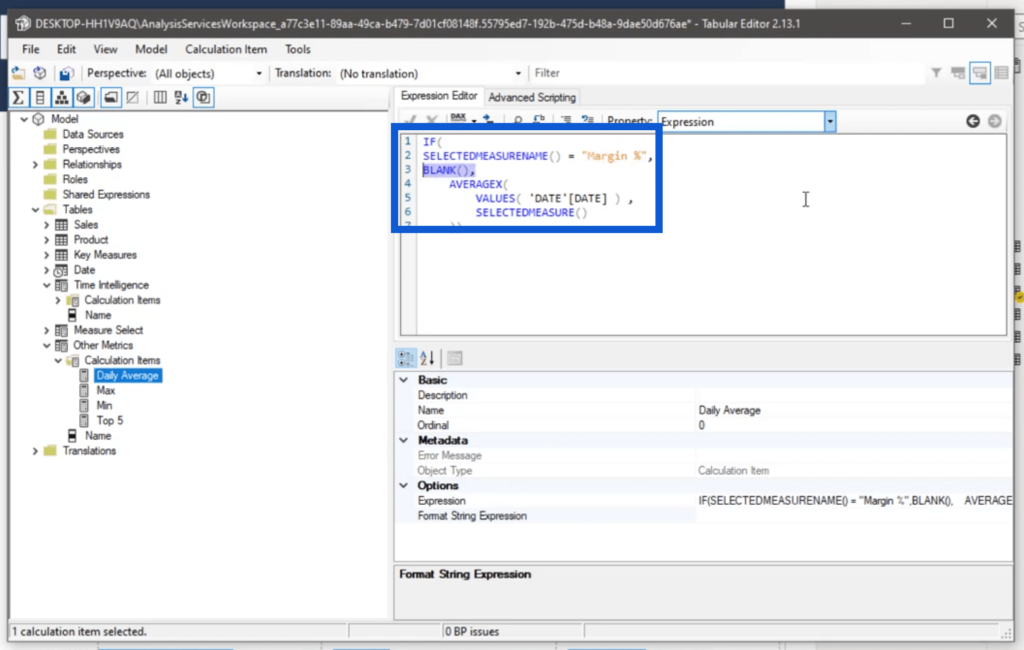
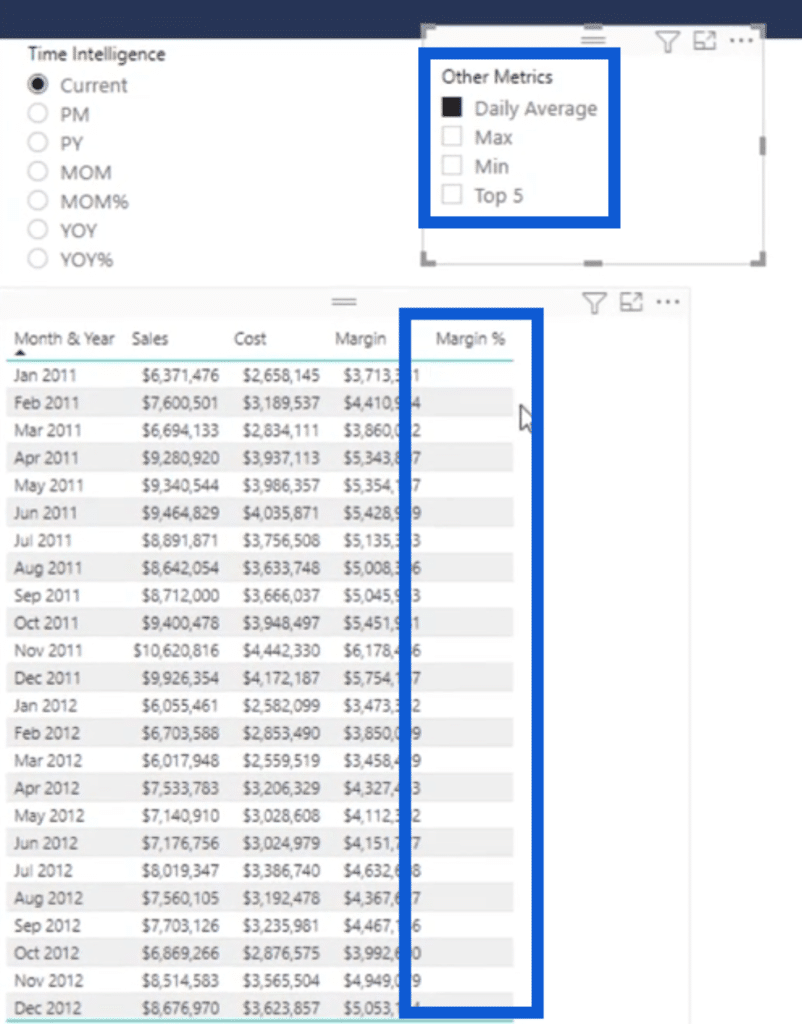
Going back to the report, you’ll see that measure being applied when you click on Daily Average. It shows that the margin percentage is blank simply because it doesn’t really make sense to divide a percentage by the number of days in any given month.
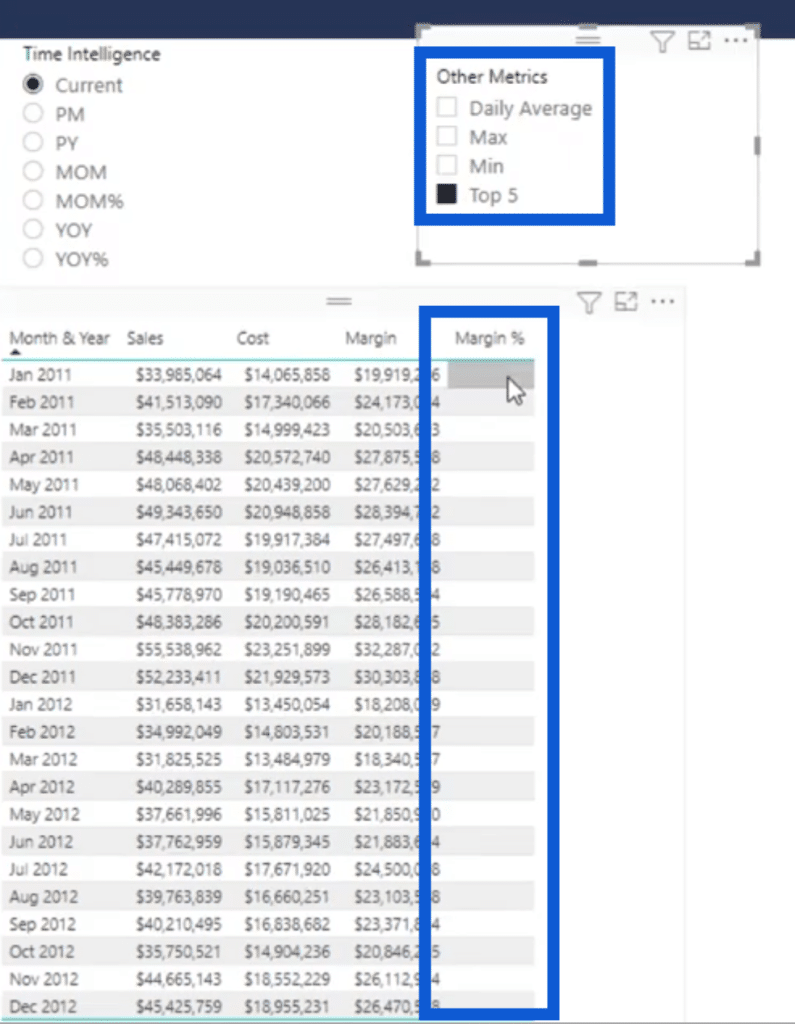
The same thing applies to the Top Five. No value is showing in the margin percentage column.
When we go to the Tabular Editor, you’ll see that the same condition is used for Top Five. If the measure involves the margin percentage, then no value will be shown.
Calculation Groups For Measure Select
The last calculation group is for the Measure Select, which is used as small multiples.
When we jump back into the Tabular Editor, we go to Measure Select. I’ve already created some calculation items under it like sales, cost, margin, and margin percentage.
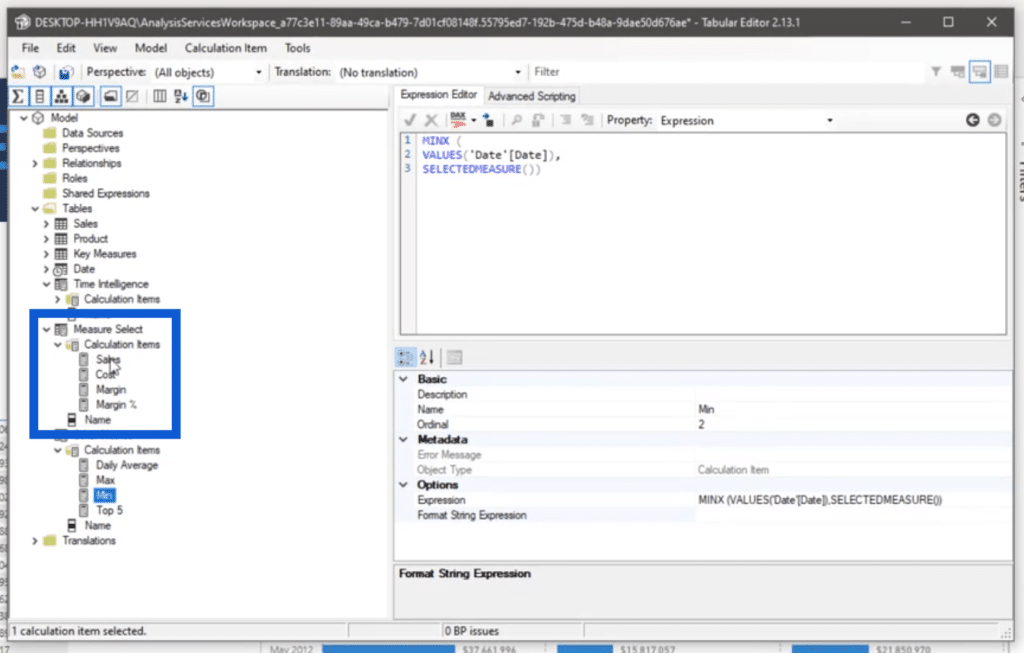
If I go to sales, I just reference this measuring field.
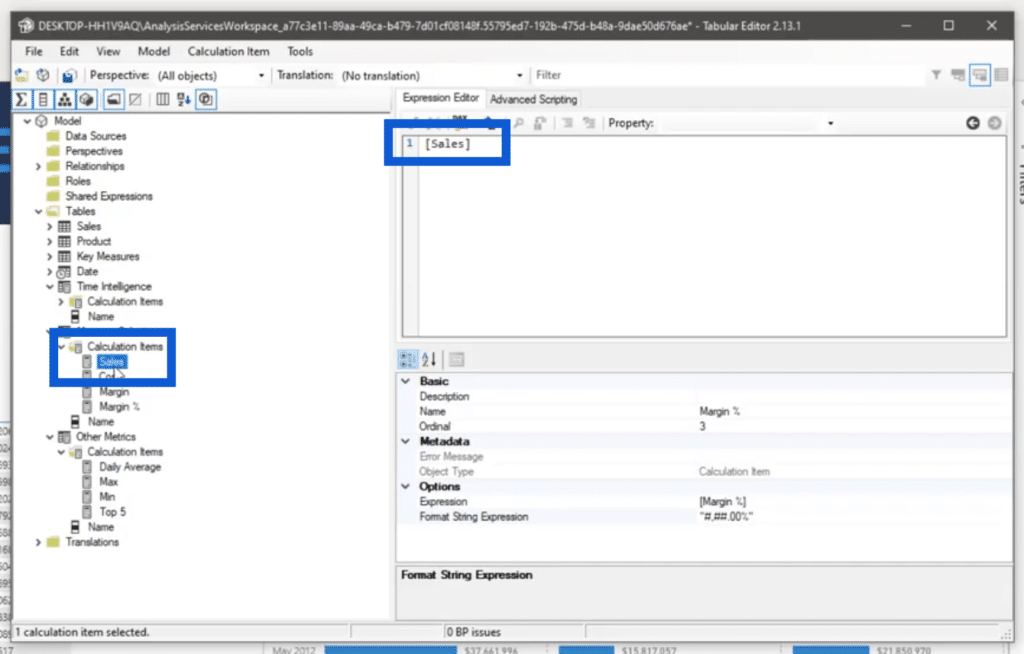
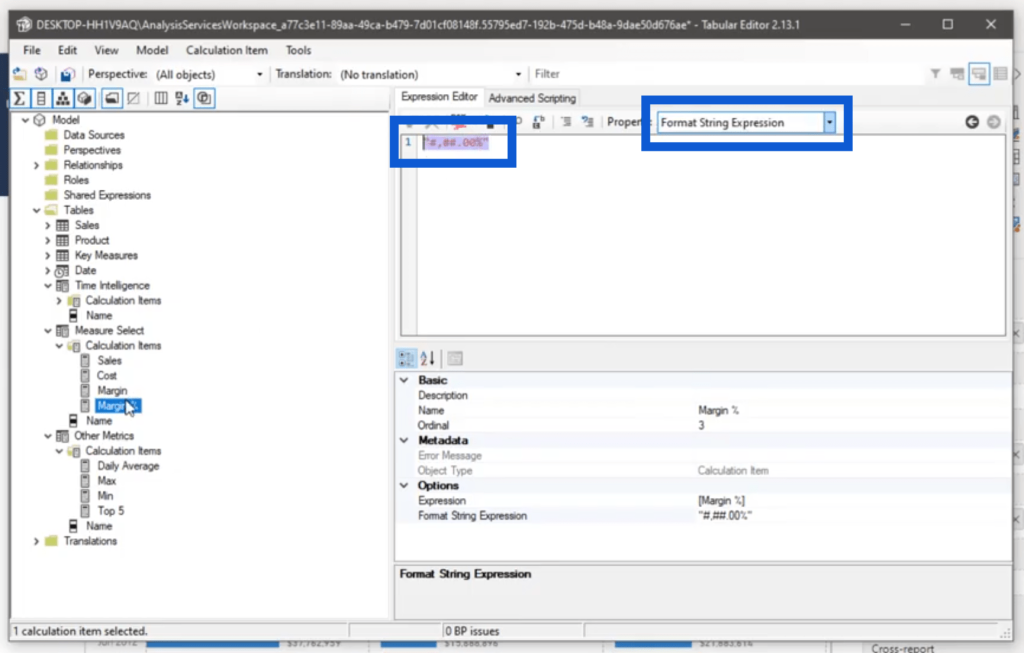
The same thing applies to cost, margin, and margin percentage. You’ll also notice that I didn’t mention applying any formatting string.
That’s because the formatting string has already been applied to the other calculation groups, especially when it comes to sales, cost, and margin. But for the margin percentage, make sure that the formatting string is still applied.
When we look at the report though, we’re only displaying the sales, cost, and margin on the line graph. The margin percentage is only displayed on the table on the left side.
Setting Precedence for Calculation Groups
There were a few challenges that I faced when I was developing this report. These technicalities are worth taking note of because these are simple things that are easy to miss.
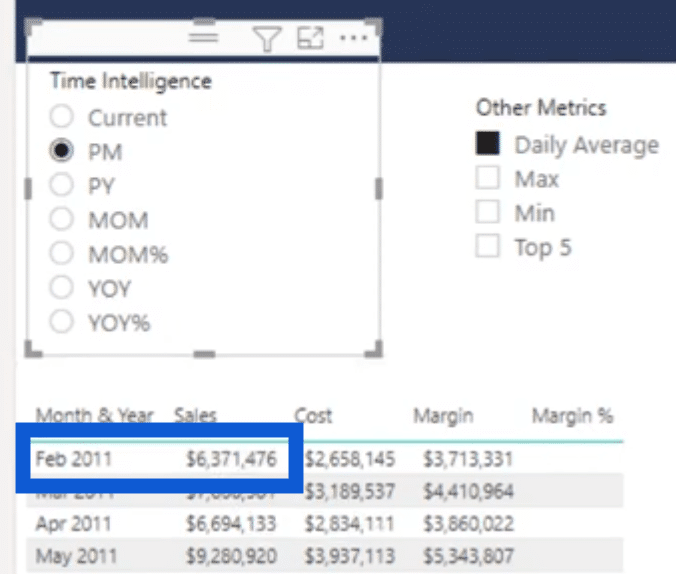
First, I’m going to select Daily Average, then I’m going to click on Previous Month. As you can see, the daily average for the month of January is 6.37 million.
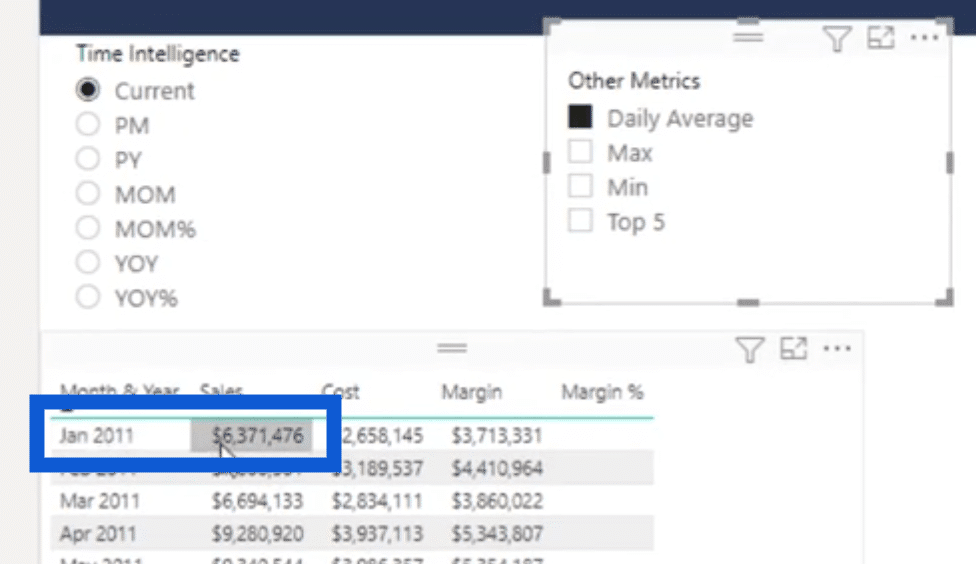
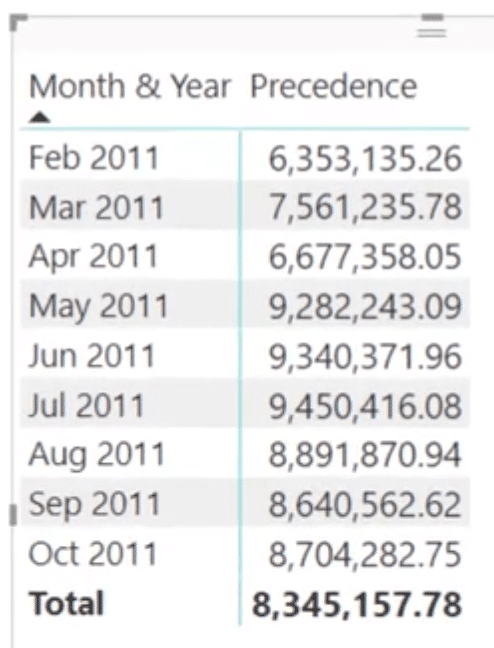
If I click on the previous month, the expectation is that the same value (6.37 million) should show up for February. But when you look at the table, it’s showing 6.35 million instead of 6.37.
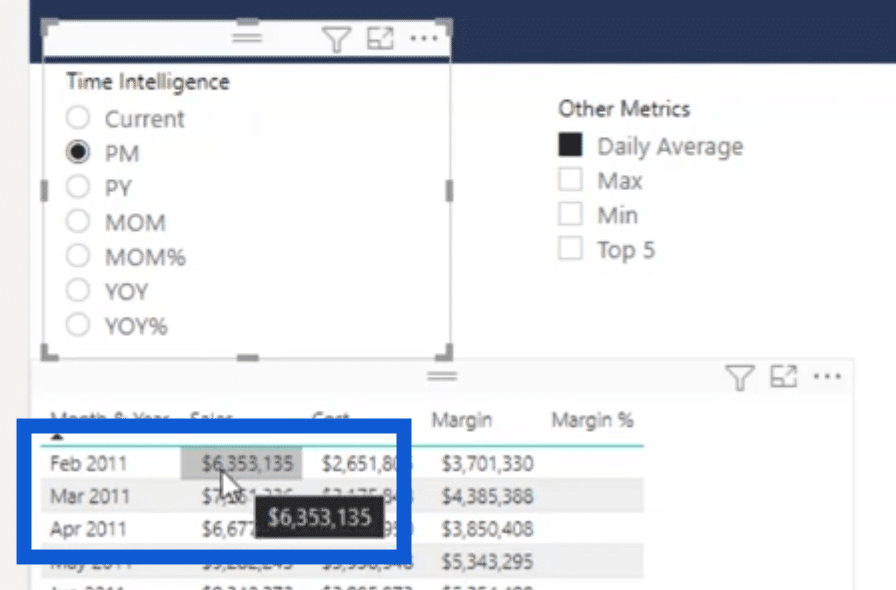
The reason why we’re seeing wrong results here is because we haven’t set the right precedence within the calculation groups.
Precedence decides which calculation group is applied first before the others. The higher the digit assigned, the higher precedence it takes over the others.
When I created my calculation groups, the first one I created was Time Intelligence. Because of that, it was automatically assigned 0 precedence.
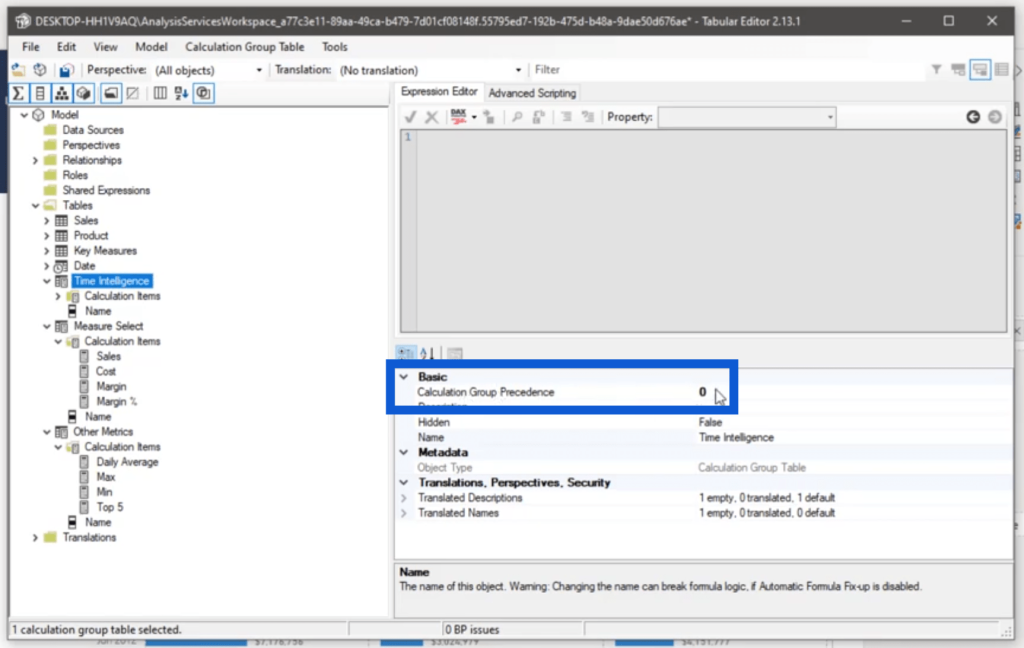
I worked on Other Metrics next, so it was assigned a precedence of 1.
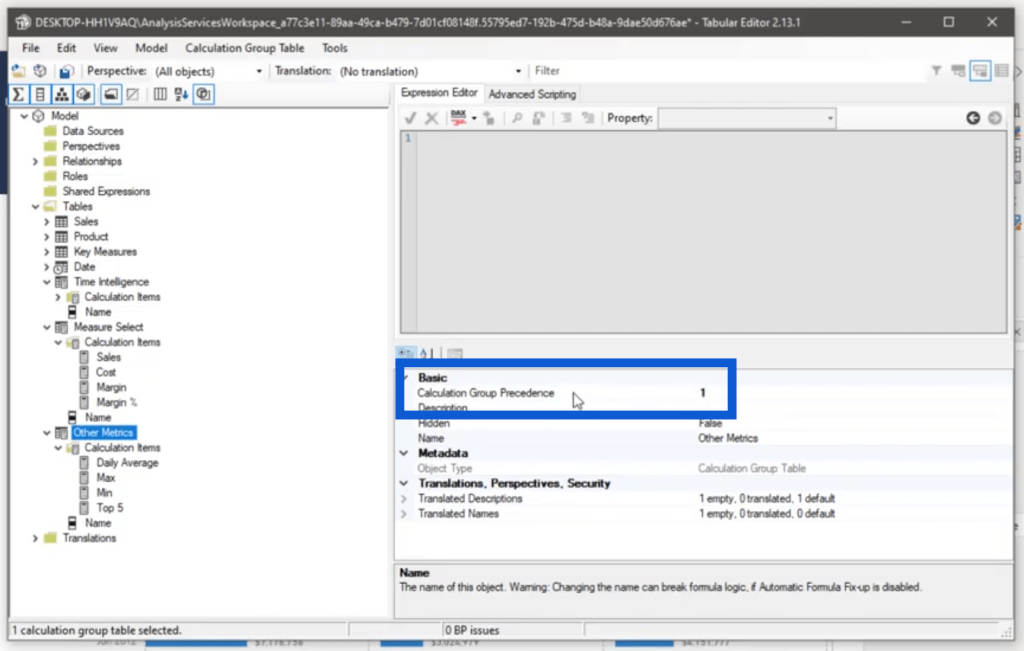
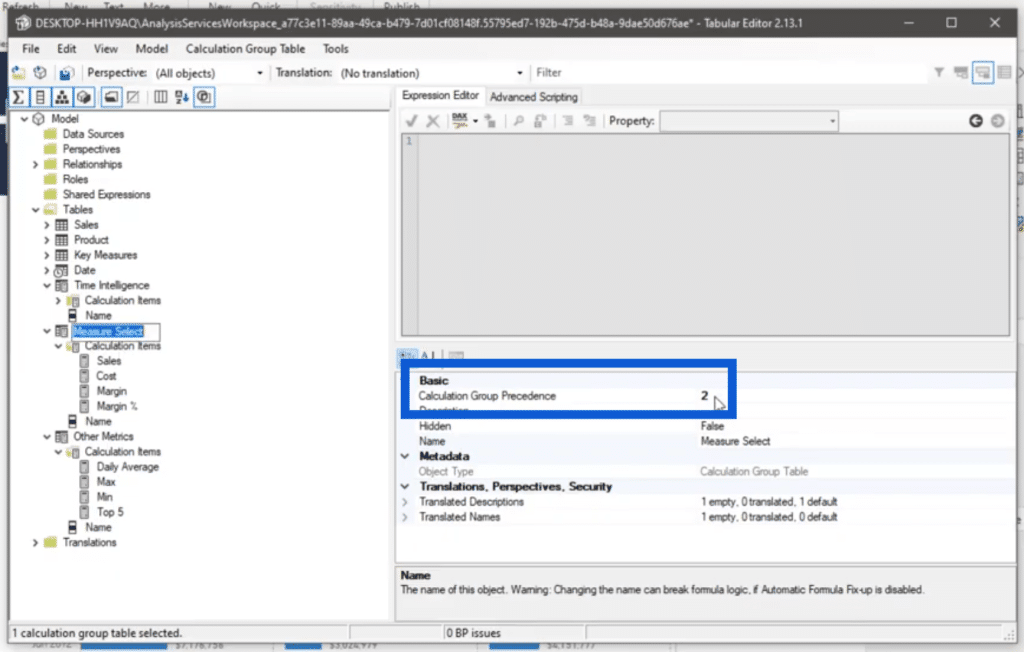
The last one I created was Measure Select, so 2 was assigned to this calculation group.
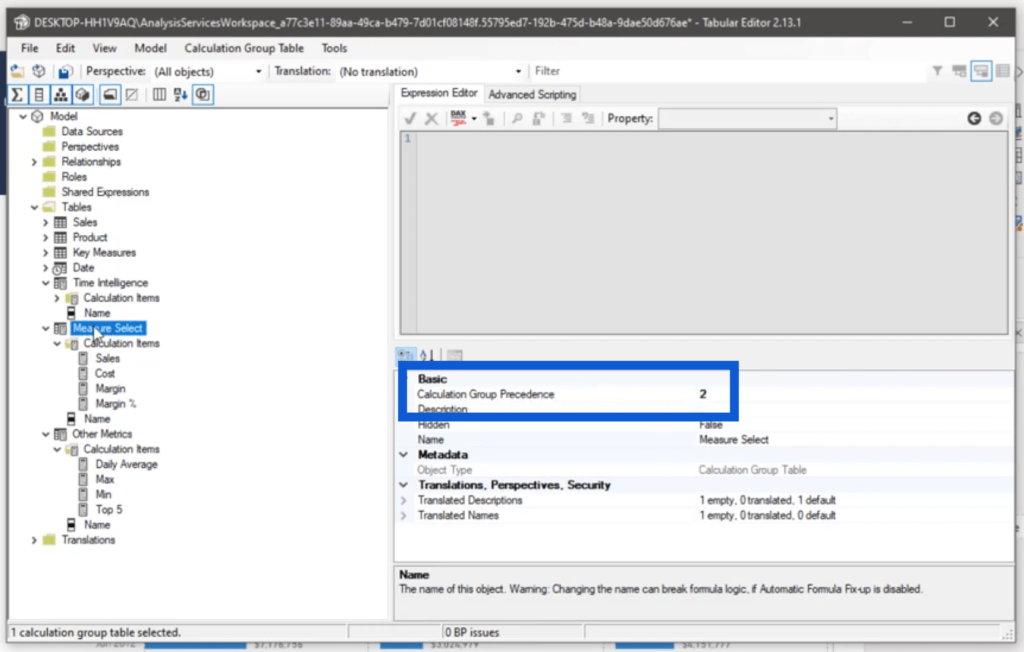
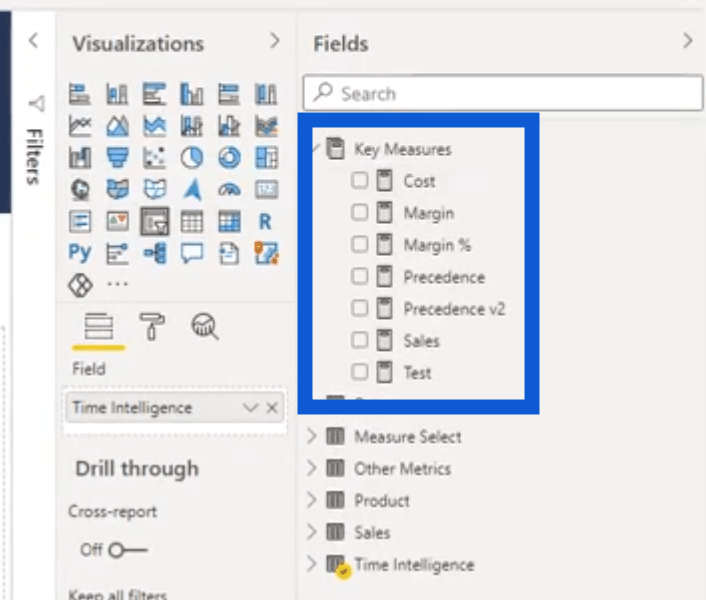
To figure out which calculation group should have higher precedence, it’s important to check what each of the measures does. I can check on the measures under the Key Measures under the Fields pane.
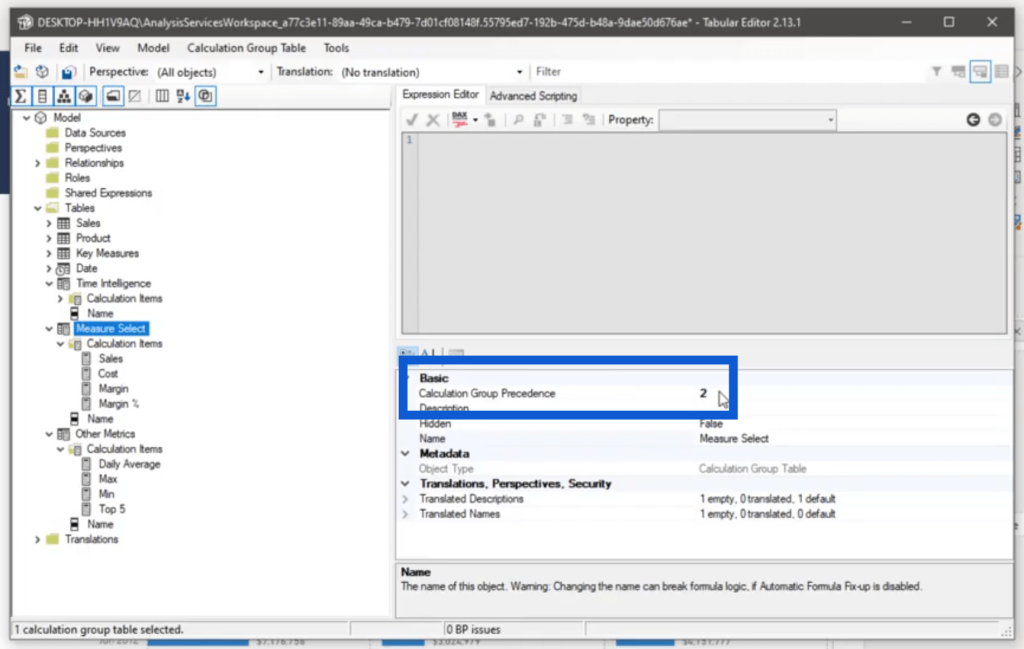
Let me check under Measure Select. This is the calculation group that was assigned the highest precedence.
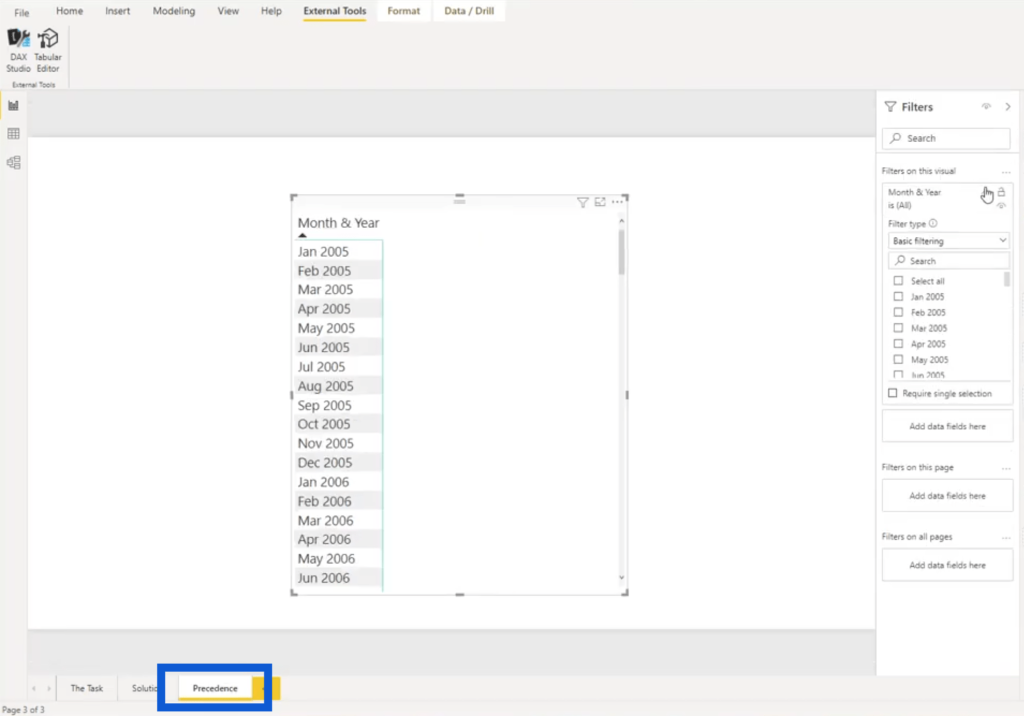
Starting off with a blank page, I’ll filter the dates I want to check on first. As you can see, I’m showing data here since 2005.
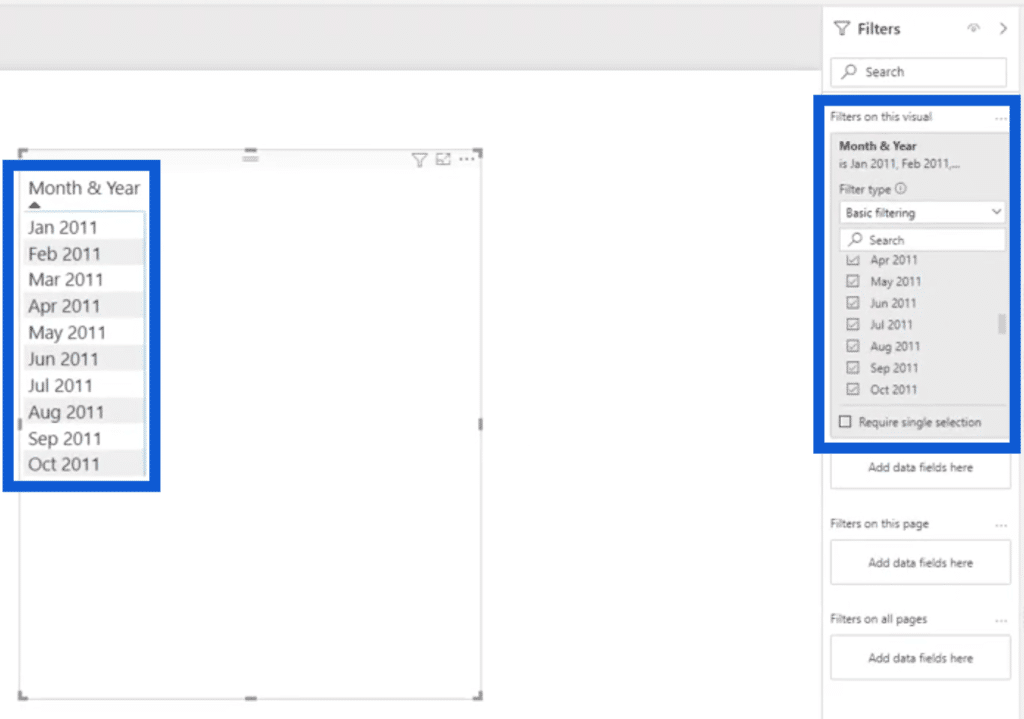
Since we saw the error within 2011, I’m going to restrict the timeline through the filter and pick the months for 2011.
Using the original precedence set, I’m showing the wrong value of 6.3 million for the month of February.
This was the measure attached to that precedence.
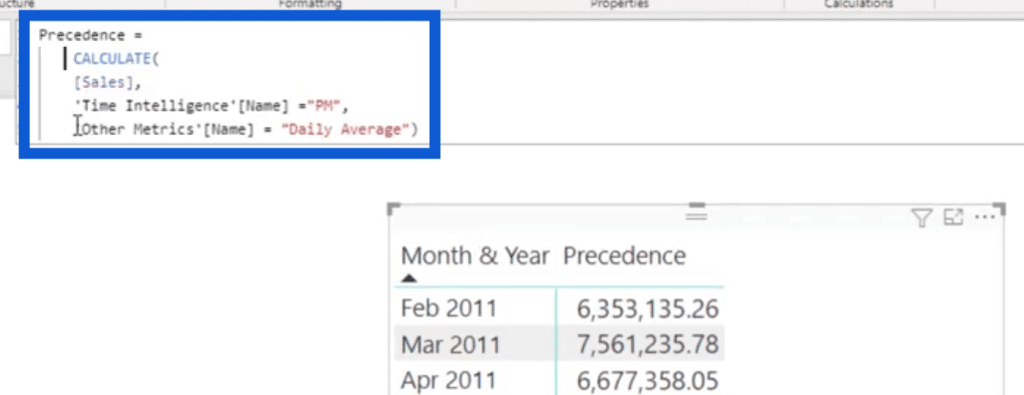
Basically, this measure goes for Sales first, which falls under Measure Select. This takes the highest precedence. Then, it’s calculating for the Daily Average because it falls under Other Metrics, which was assigned the precedence of 1.
Then, it’s applying the Previous Month calculation under Time Intelligence because it was assigned 0 precedence. But what we want to do is to apply previous month first before the daily average. With the right precedence, it should show the right value, which is 6.37 million.
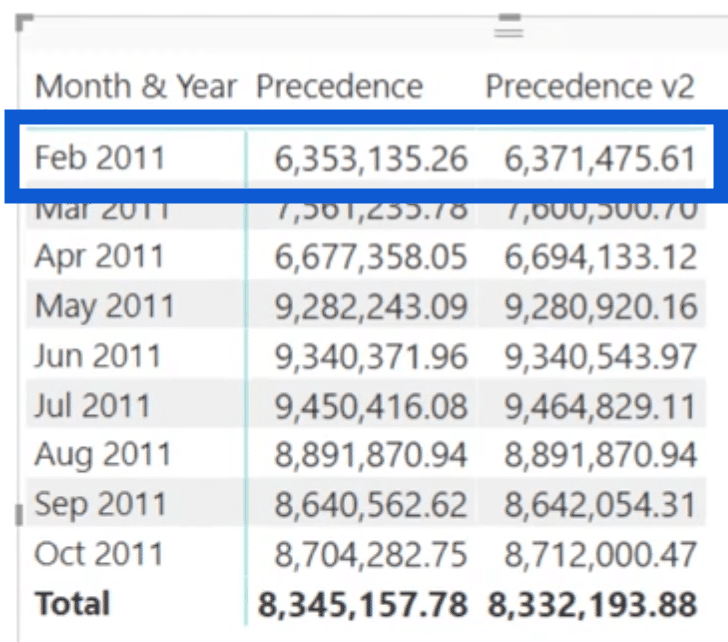
To solve this issue, just go to the Tabular Editor and correct the precedence assigned. I want to give the higher precedence to my measure first, so Measure Select should be 2.
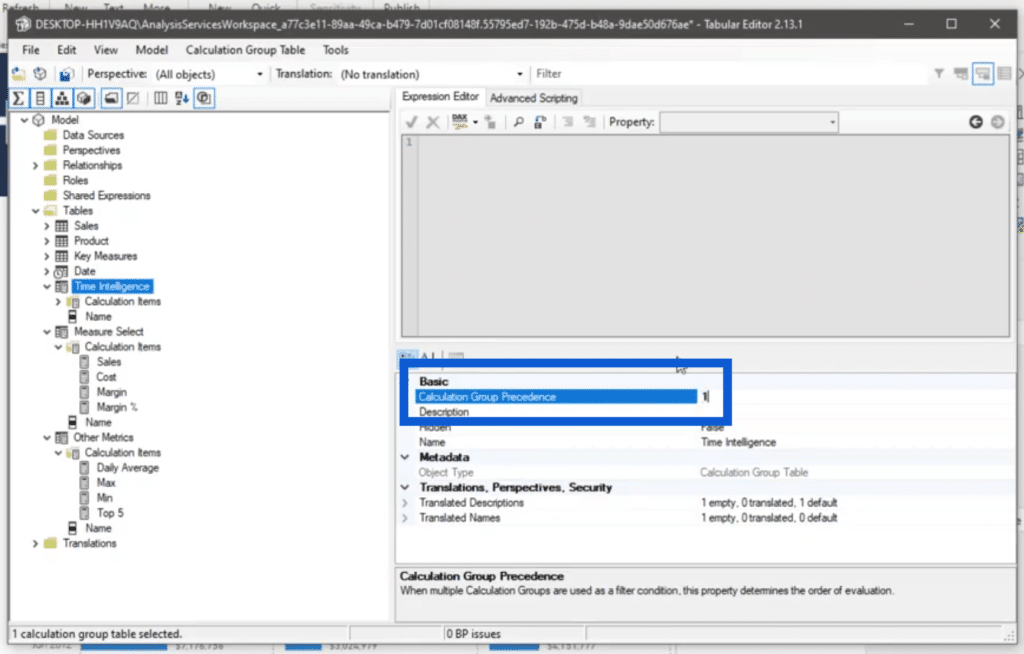
Then, Time Intelligence should go next, so I’m giving this the precedence of 1.
The last one I want to give precedence to would be Other Metrics. I will assign 0 to this group.
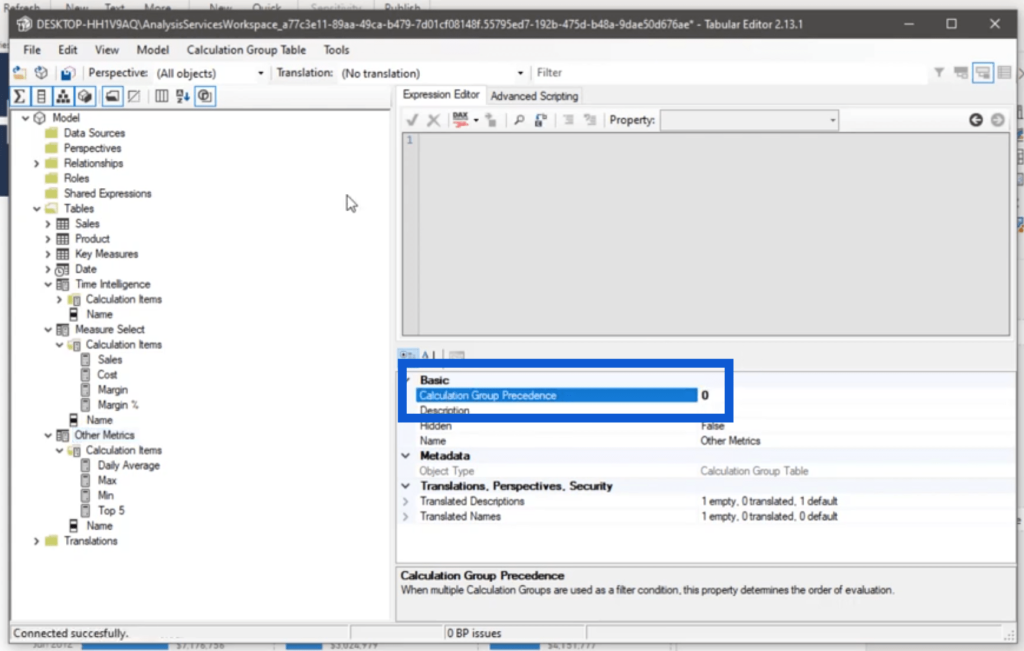
Once I save my changes, the right results will also show up in the report. So if I click on Previous Month, you can see that I have the correct 6.37 million.
Applying The Correct Filter Context
I came across another interesting scenario while checking this report.
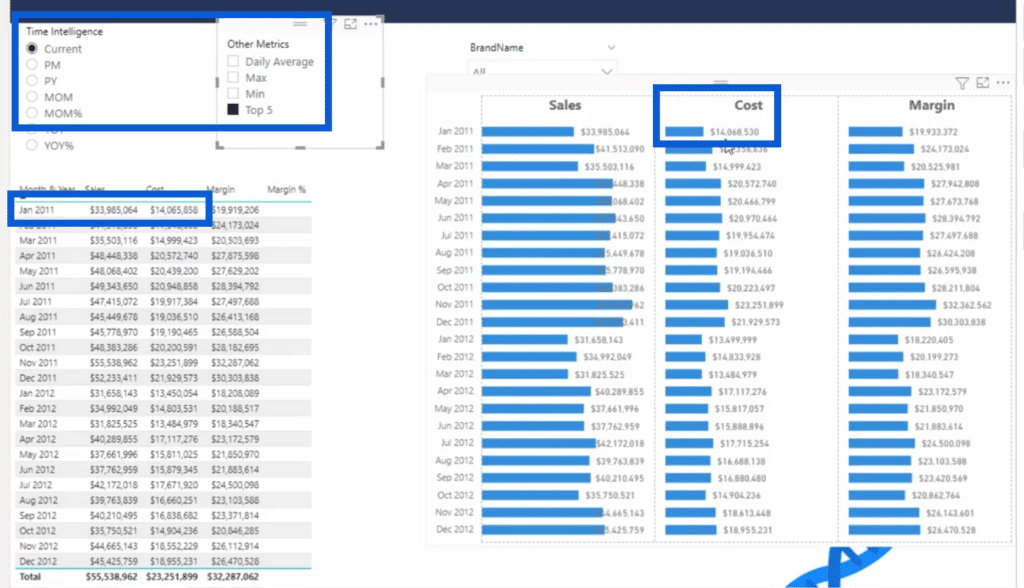
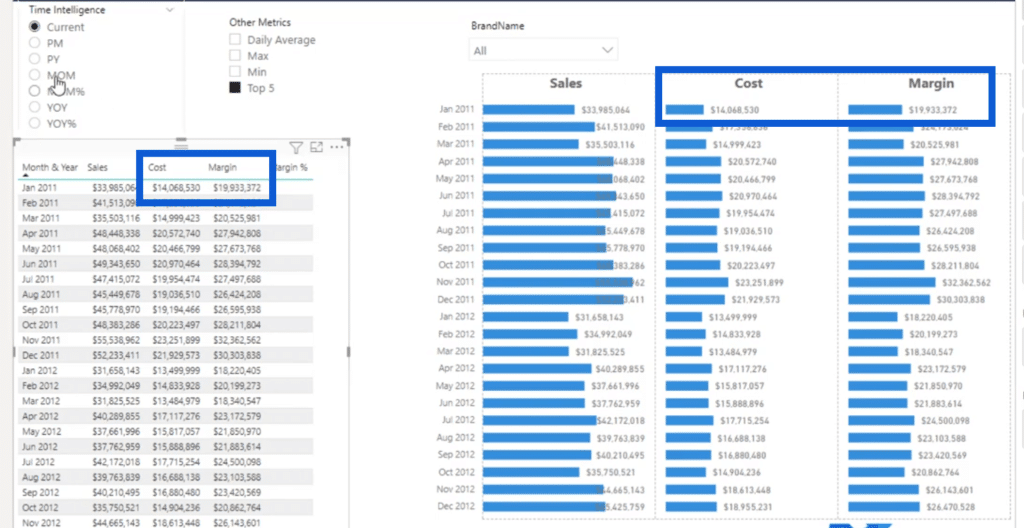
When I clicked on Current under Time Intelligence, then on Top Five under Other Metrics, it shows the cost as 14,065,858 on the table but shows 14,068,530 on the small multiple visual.
The same goes for this margin. The results are different even if they’re from the same month.
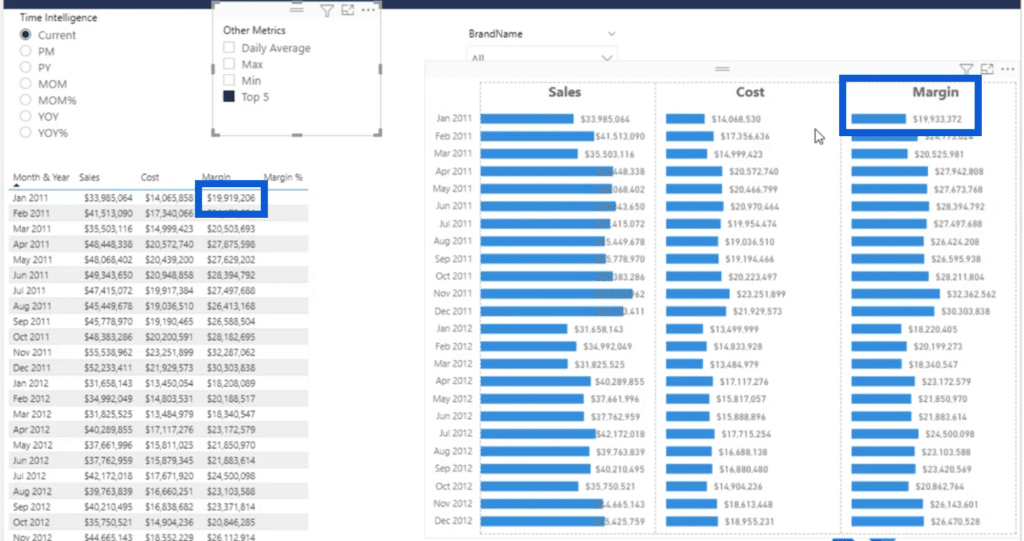
Basically, it’s the line graph that shows the correct results.
You see, when we apply the calculation groups on this visual, the calculation groups override the filter context in our report automatically.
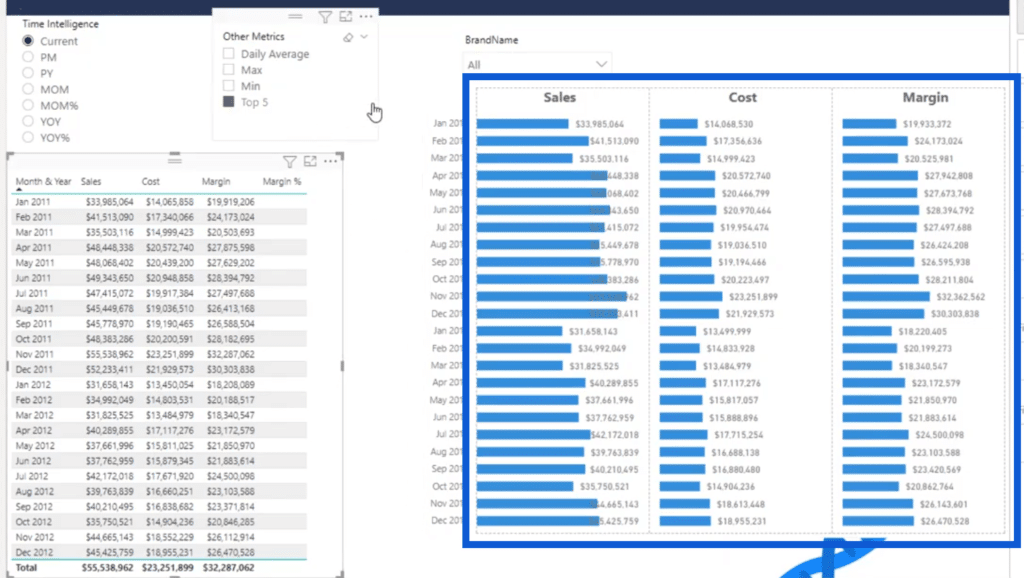
But on the table, we used our measures and not calculation items. That’s why it’s showing the wrong results.
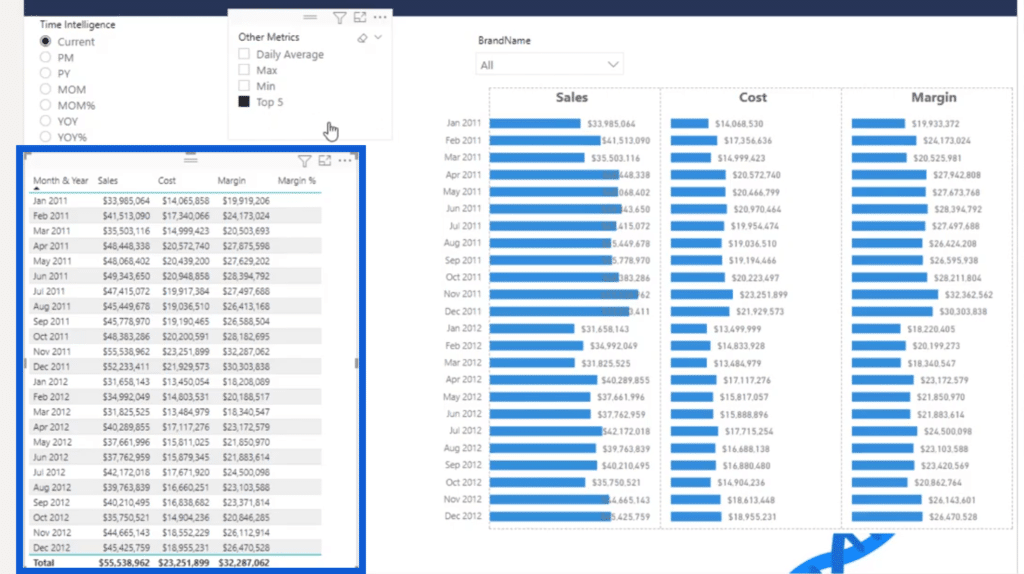
Let’s go to the Tabular Editor, then click on Top Five. We’re using a basic measure to get the top-end results.
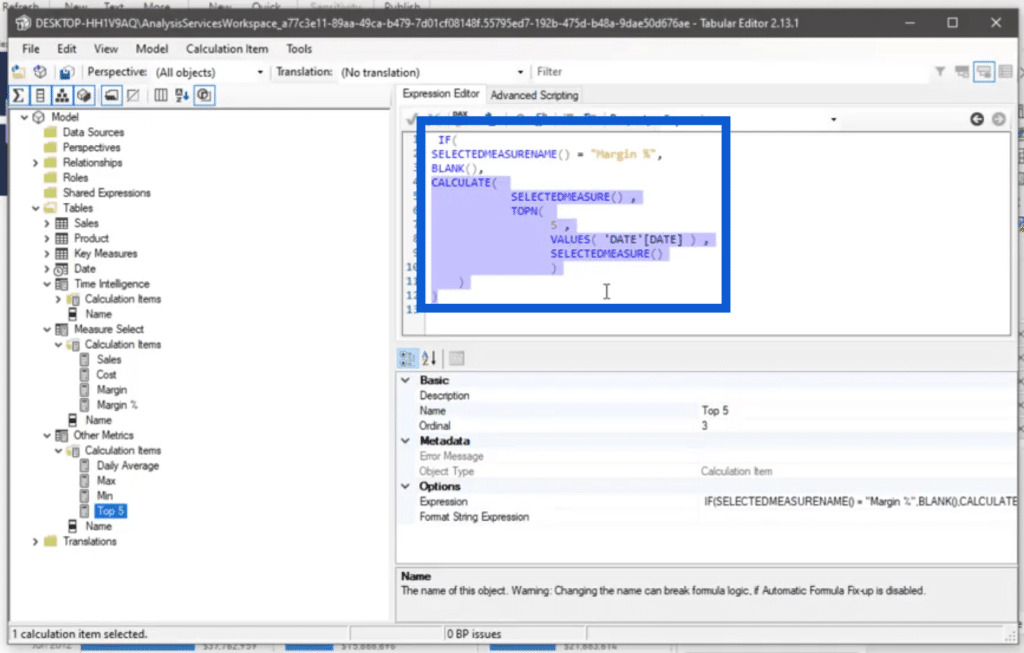
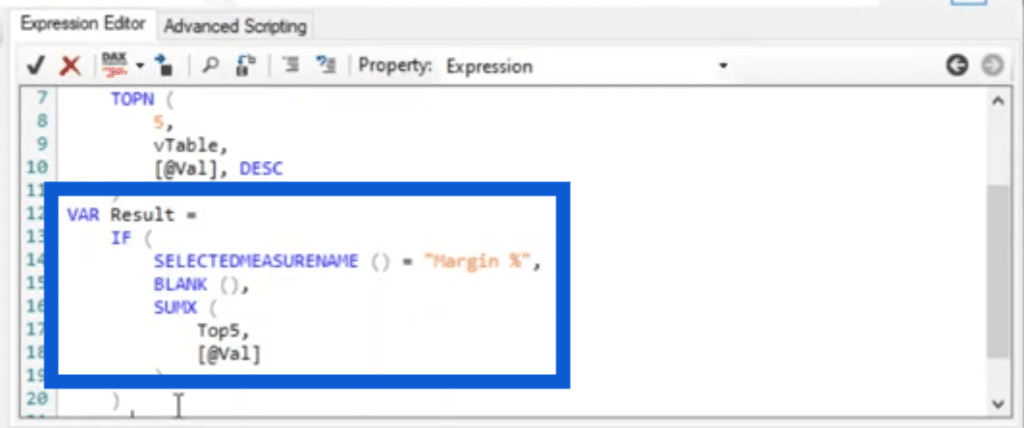
To solve this problem, I have to force filter context into the report by creating this measure and then applying it to the measure that’s currently being used. This new measure creates a virtual table.
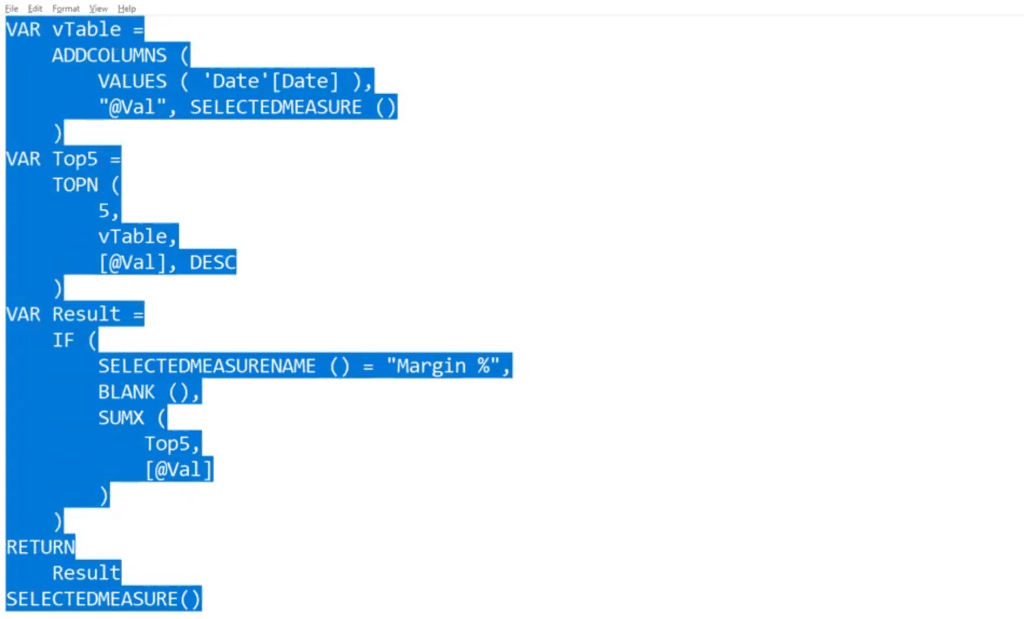
I copied that new measure for the virtual table, then I pasted it into the Tabular Editor.
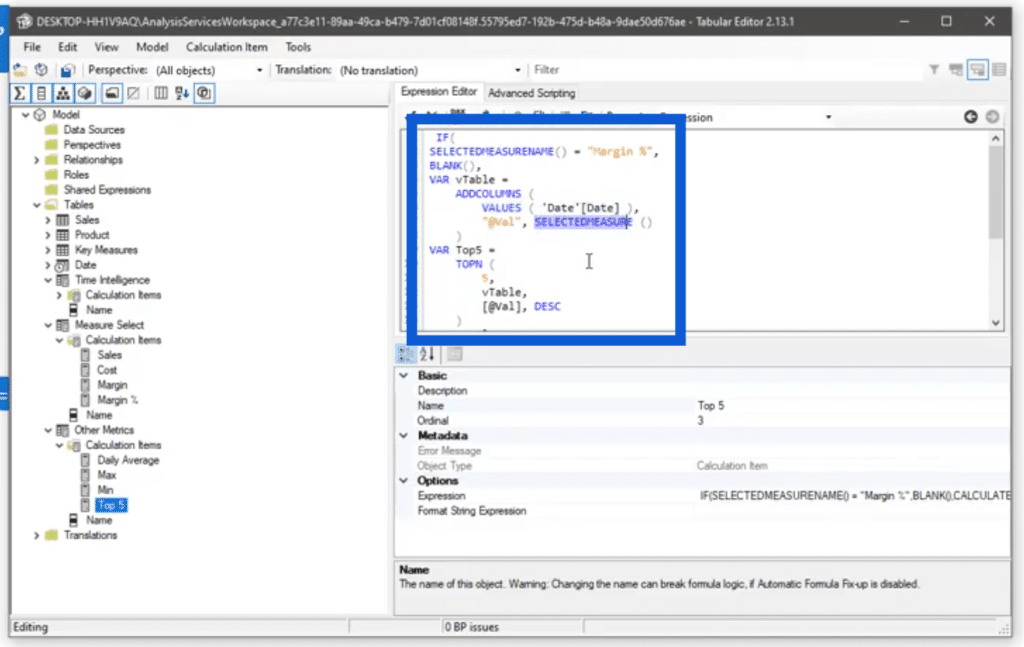
In the virtual table, I grouped my Date VALUES with the SELECTEDMEASURE.
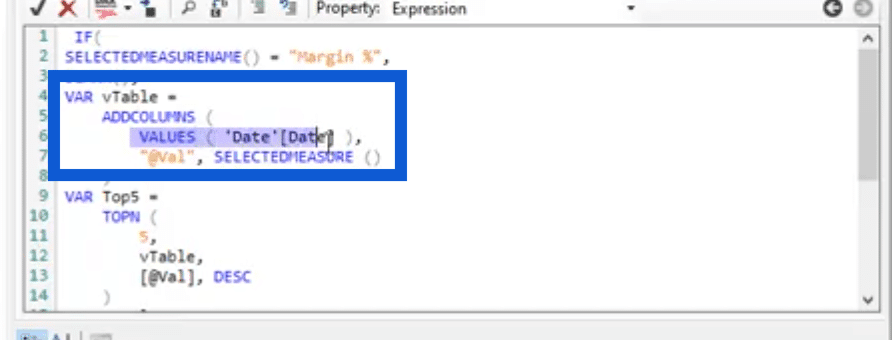
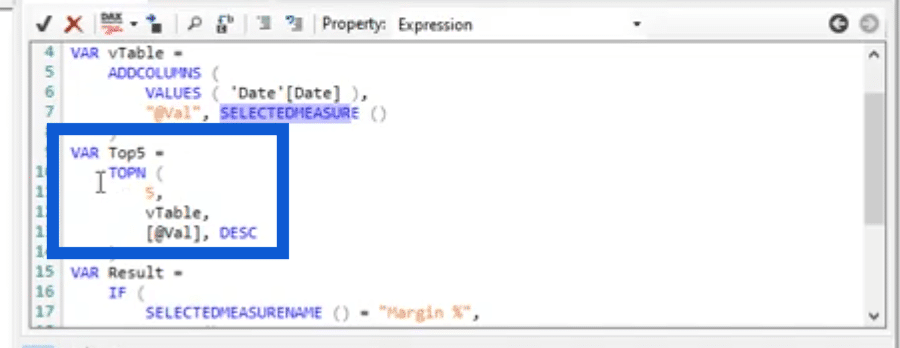
Then, I created another variable where I extracted TOPN for my Top Five values.
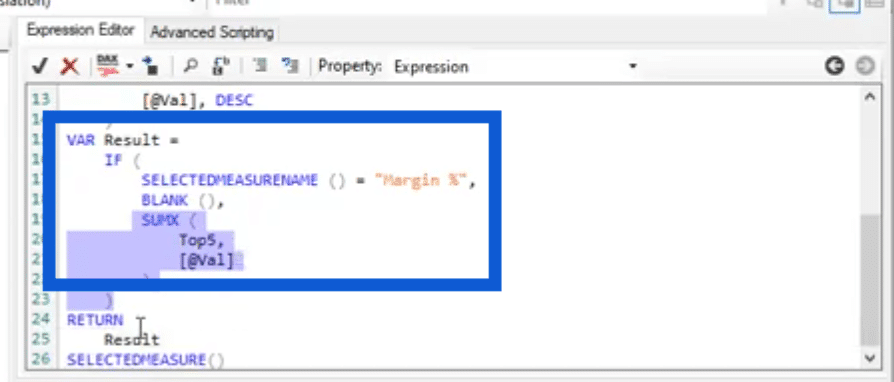
I also used SUMX for the Top5 values in my report.
Then I removed this part from the start.
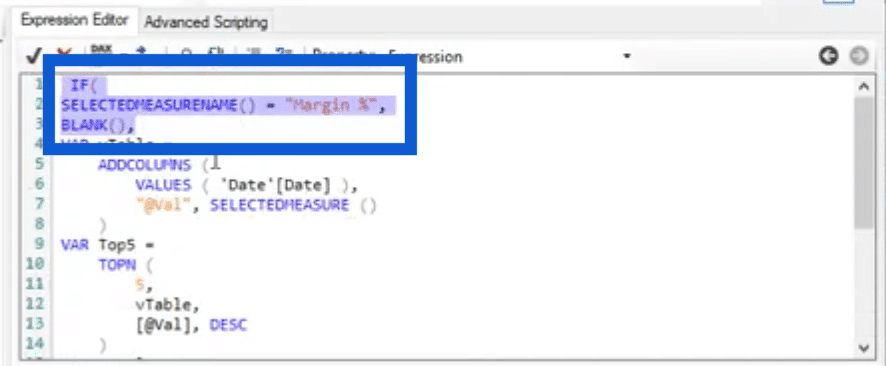
As you can see, the same part I removed is already being used here at the bottom.
After changing the measure and forcing the filter context, the report is now showing the correct results for both the cost and the margin.
Other Technicalities to Check
One thing to check is the calculation groups in this small multiple visual. Let’s copy the graph onto a blank page.
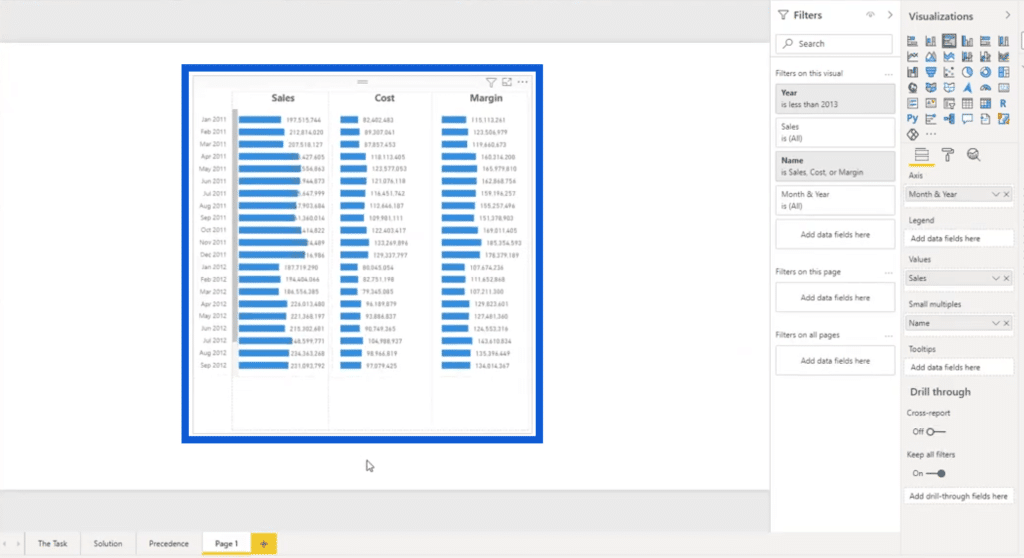
Sometimes, instead of showing general measures in our small multiples, we can also use dimensions or categories.
For example, if I go to Product here under the rightmost pane, I can click on Brand Name.
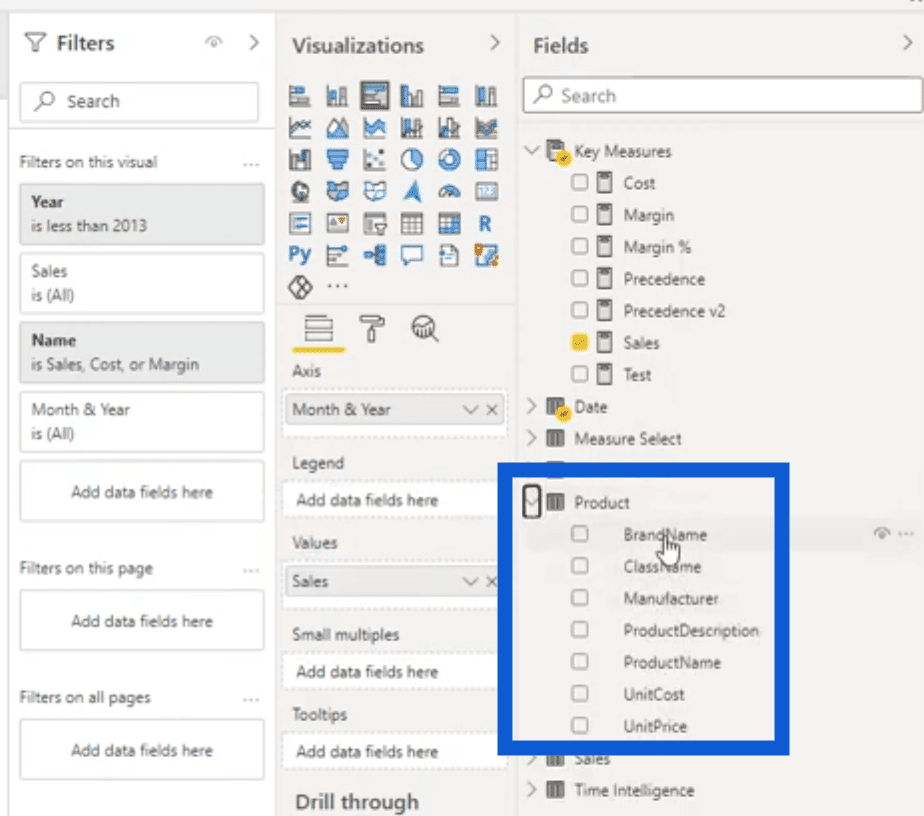
Once I do that, the visual will now be analyzing sales by Brand Names. So we are using only one measure in our small multiples.
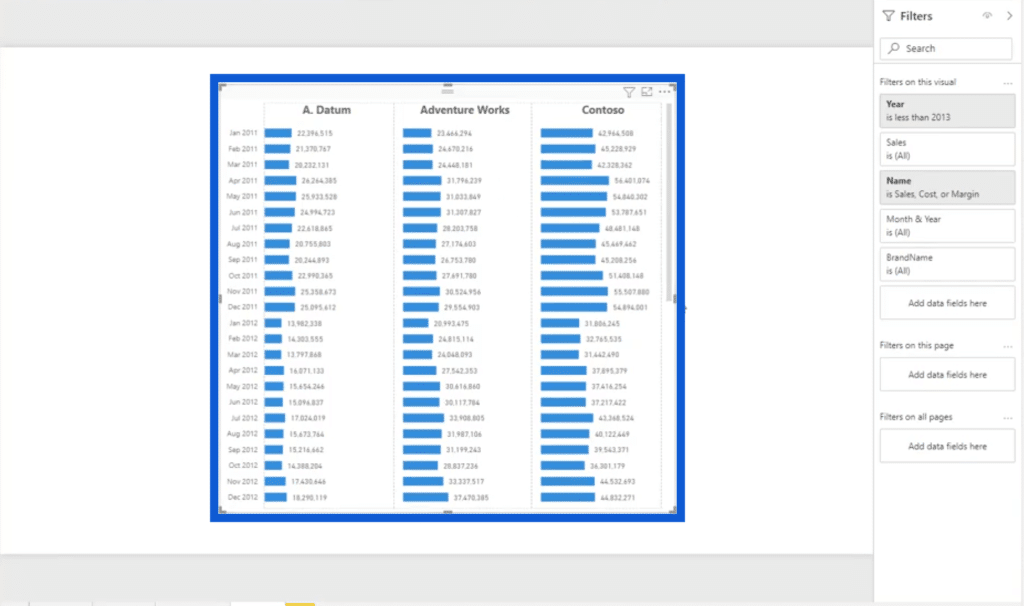
But when we go back to our original graph, we have multiple measures that we’re computing for with the help of calculation groups.
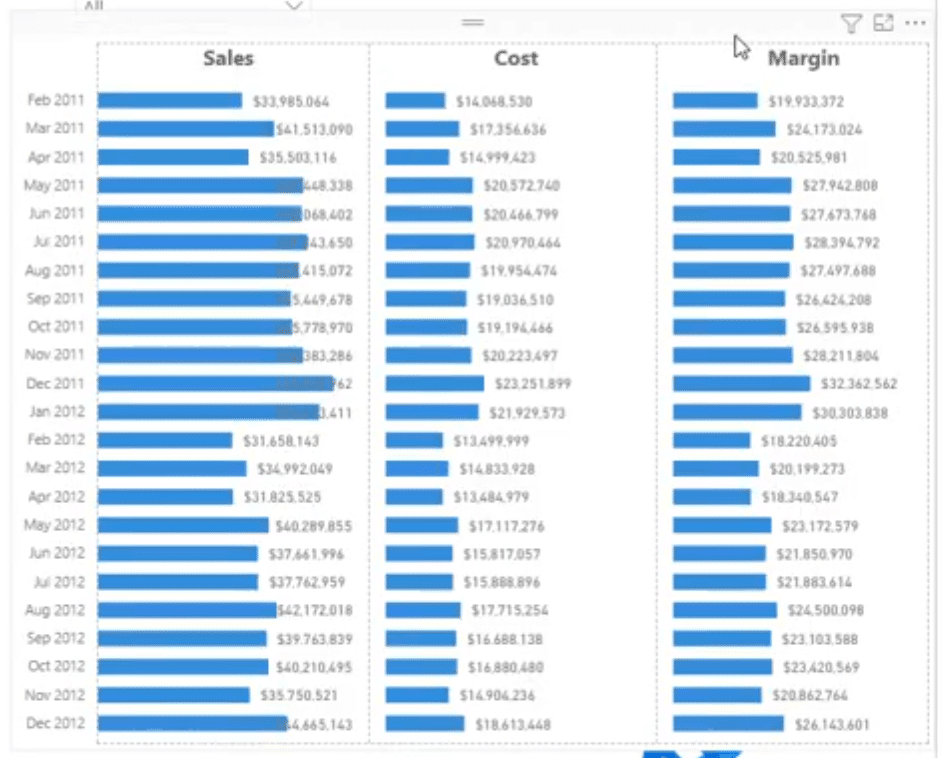
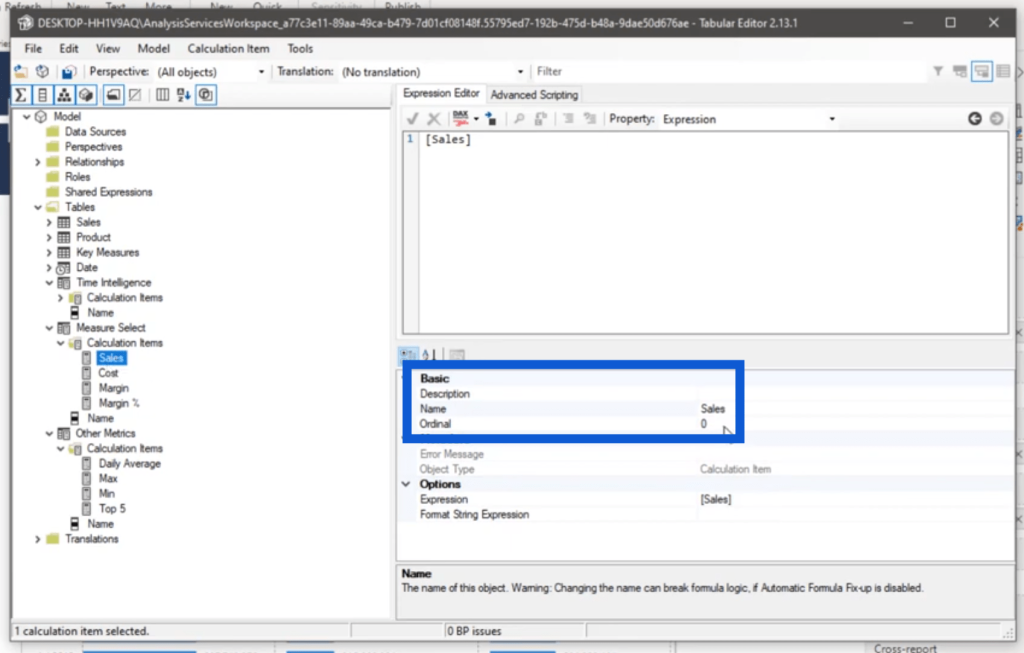
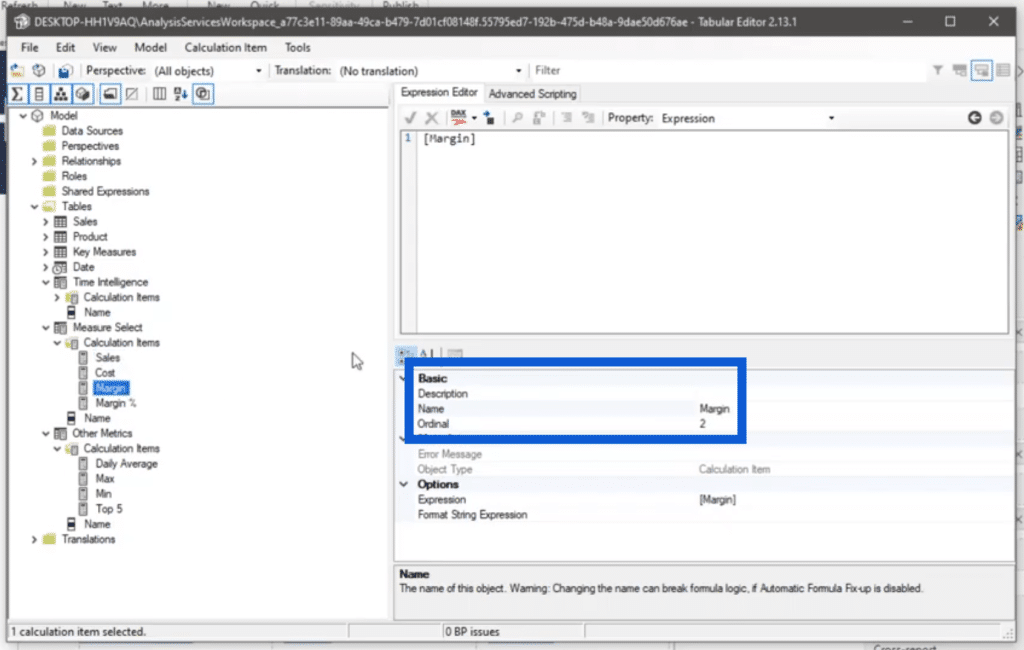
We also have one last requirement, which is to solve for these measures with the help of calculation groups. You can go to Tabular Editor and go to Measure Select. Make sure that Sales has been given 0 ordinal.
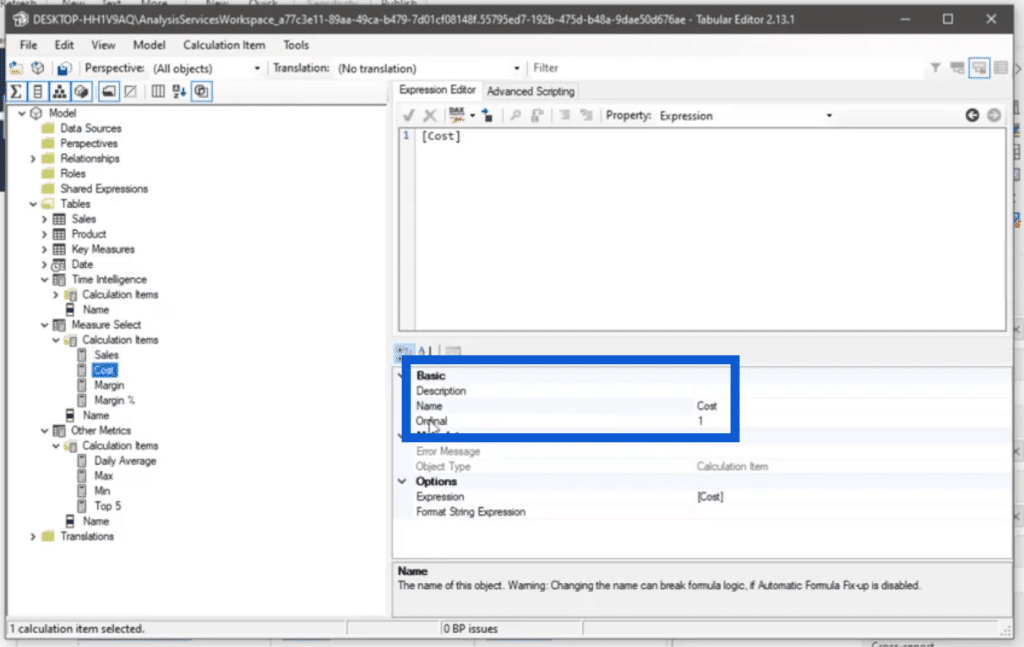
Then, Cost should be 1.
Margin should be two.
***** Related Links *****
DAX Calculation Groups To Avoid Unpivoting Columns
Power BI Calculation Groups – DAX Tutorial
Use Tabular Editor To Create Calculation Groups In Power BI
Conclusion
When you are creating multiple calculation groups in your report, you have to make sure to test the results very carefully. There are a lot of technicalities that could affect your results without you realizing it.
I hope you enjoyed this challenge. The entire solution, as well as the pbix file, is posted on the Enterprise DNA Forum. If you haven’t dived into these challenges yet, make sure you check them out. Joining Problem of the Week means that you’ll get feedback from experts and other members of the group.
All the best,
Mudassir

