Financial reporting is a very essential tool to communicate past successes as well as future expectations in a company. When you need to complete a financial analysis, you need to set up your financial data in Power BI in a compelling way. You may watch the full video of this tutorial at the bottom of this blog.
It doesn’t matter if your data is from the revenue side, the expense side, or the balance sheet side – the goal is to ultimately represent this data in Power BI and put it into a compelling financial report output.
This, historically, was very difficult to do. But, it’s becoming easier and more efficient because of the updates that are being rolled out with the Power BI desktop.
That’s what this tutorial is all about. It’s to show you how you can do that by doing setups or rearrangements. From your raw data, you can start creating interesting and valuable reports around your financials.
Sample Data Setup in Power BI
Below is a sample of a completed Power BI data setup for a financial report. This is from a member-only session that I went over for those who have upgraded to Enterprise DNA.

This tutorial shows you how to set up data and highlight compelling insights relevant to any type of financial reporting. It doesn’t matter if it’s around profit and loss statements, balance sheets, cash flow or statements.
But, you can’t carry out such a great analysis if you don’t set up your actual tables, your queries, and model correctly.
As you can see in the sample model, you can look at any of our profit and loss details over any time frame. That is made possible through the financial years that I’ve set up. I’ve also got this dynamic measure where you can easily compare Budget vs Last Year.

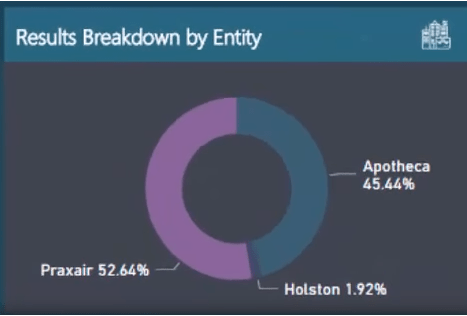
Furthermore, in this model, I have embedded a way of looking at different entities and drilling into specific results for those particular entities.

Also, you can see that I have created a breakdown for all our PnL statements.

You can even drill into specific elements within our PnL statements. For example, you can look at a particular grouping of line items and see how those items performed.

Setting Up Your Queries
Before I teach you how to set up queries, here’s what the raw data looks like.

It is quite a huge table, isn’t it? This is because it contains data over many financial years. It also contains every single line item that you usually have in a business.
To set up your data in Power BI or financial reporting correctly, you need to do a lot of the hard work inside the query editor.
To set up your queries, go to the Home tab, and then click Edit Queries.

You can then find your queries here.

This initial setup is exactly the same table from our raw data. But it is now in the Query Editor in Power BI.

You’ll see here that all the dates are at the top, and then the details are down below.

Actually, you cannot do anything with data in this format, especially financial reporting.
What you need to do is to think about how you can make this table more condensed (longer). Therefore, all your dates need to be placed in the top header row. Then, all your dates need to be in one column as well as your results.
So, the most important thing to do next is to UNPIVOT your data. To do that, select the first three columns.

Next, right-click, and then select Unpivot Other Columns.

After that, you will get this long and thin table. You’ll have the dates in one column and the values in another.

And then, rename the first column as Months.

You can also see the Dates table in our lookup tables under Data Model.

There’s also a Financial Categories table here where you can build a hierarchy around every line item like the category, the sub-category and more. Then, I’ve also got a reference number to make sure that revenues are set above expenses.

The data is not actually complex; it just needs sorting out and the financial data needs optimizing.
Working Out The Model
As I’ve said, getting your data model right is downright essential. You should somehow build a relationship between the Dates and Financial Data.
But you can’t simply build a relationship across multiple columns. It is important to have just one simple relationship; it is also the same for Financial Categories.

Again, the main thing that I wanted to demonstrate in this tutorial was how to get the set up right for your data in Power BI.
After that, you can utilize all the great things like the time intelligence calculations and budgeting analysis. You’ll also be able to do some great analytical work, which I demonstrated earlier, if you get the set up right.
Lastly, you can create compelling visuals that dynamically go through time and compare different metrics versus measures versus other measures.
***** Related Links *****
My 3 Best Practice Tips For Organizing Power BI Models
How To Organize Your Power BI Data Model – Best Practice Tips
Conclusion
Financial reporting within Power BI is becoming far superior to any alternative tool that you can utilize.
Therefore, with this tutorial, my goal is to show you how you can get it going, and also show you how you can make it cogent and valuable to make informed decisions.
For more advanced data transformation and modelling examples, you can learn more here – Enterprise DNA Membership.
Cheers,
Sam
***** Learning Power BI? *****
FREE COURSE – Ultimate Beginners Guide To Power BI
FREE COURSE – Ultimate Beginners Guide To DAX
FREE – 60 Page DAX Reference Guide Download
FREE – Power BI Resources
Enterprise DNA Membership
Enterprise DNA Online
Enterprise DNA Events


