In this tutorial, you’ll learn about developing a data model for Power BI Retail Sites Dashboards. The methods discussed will help you harvest valuable insights easily from your report.
From start to finish, you’ll see how amazing DAX formulas are in calculating and filtering results for you to harvest and gather.
Arranging The Data Tables
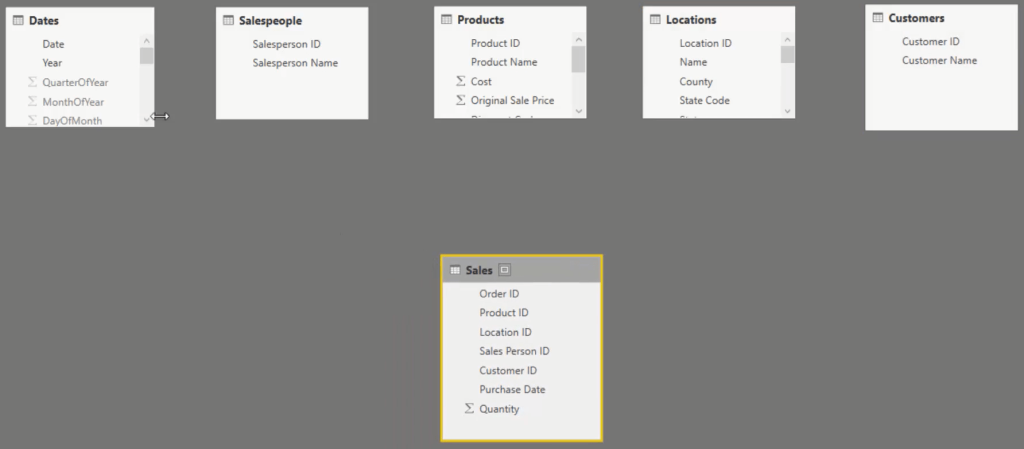
Begin by sorting out your model.
Put the Lookup tables at the top and the Fact tables down the bottom. This set up is recommended because it enables you to visualize what’s happening with the filters.

Forming The Relationships
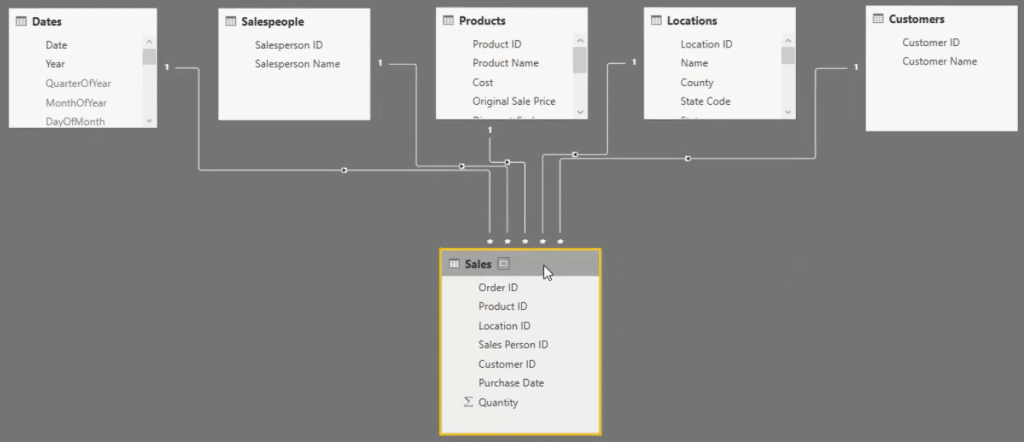
Next, form relationships between the tables at the top and bottom.
For the Dates table, grab Date and drag it to Purchase Date at the Sales table.
For the other Lookup tables, grab Salesperson ID, Product ID, Location ID and Customer ID. Drag them to their relevant indexes in the Sales table below.

Now, the first thing to do is put a title. Create a Text box and input Regional Analysis. This will help you and other users have knowledge about what you’re looking at.
After that, you’re going to have to start taking measures so that you can analyze the Total Sales, Total Revenue, and Total Profits. You have to calculate and analyze them because they will be showcased in your dashboard.
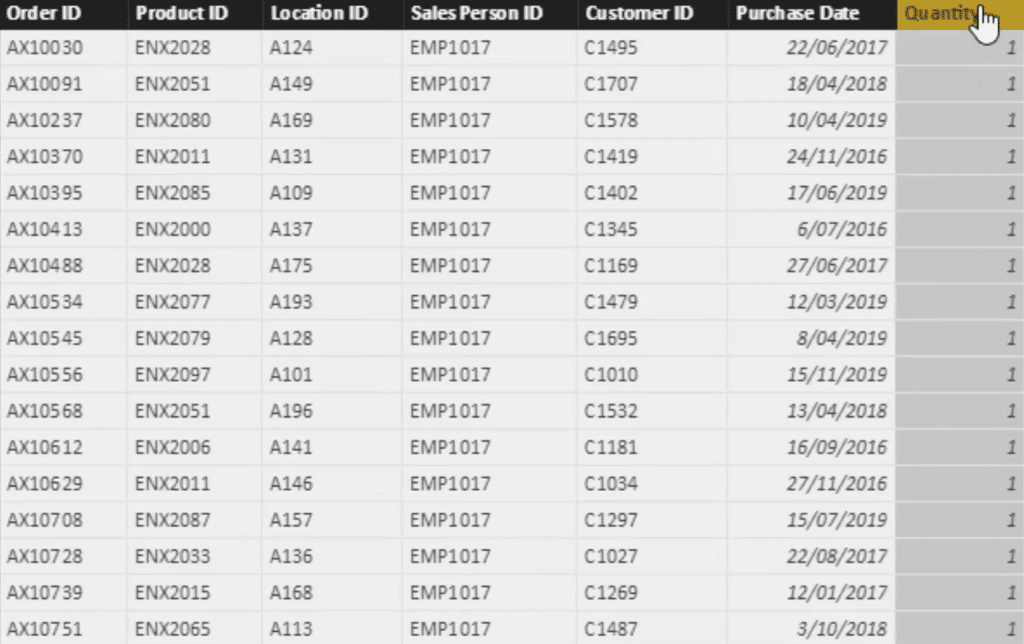
In the Fact table you only have the Quantity column.

So, you need to calculate revenue by aligning the price data for every single sale and then work out the costs. From there, you can work out what your profits are.
***** Related Links *****
The DATEADD Function: The Best And Most Versatile Time Intelligence Function in Power BI
How To Use SWITCH True Logic In Power BI
Quick Measures – How To Use Them In Power BI Models
Conclusion
Setting up the data tables properly makes the model look neat and compelling. An organized data model for Power BI dashboards makes it easier for you to track and locate the filters and calculations that is happening in your dashboard.
Relationships built among Fact tables and Lookup tables help the flow of your calculation in giving you the results that you want.
All the best,
Sam


