In this tutorial, you’ll learn how to handle missing data in a currency-rates table using DAX and power query. You’ll learn the different ways to manage the missing rates in your table and present them effectively in a dashboard in Power BI. You can watch the full video of this tutorial at the bottom of this blog.
Using The Average-To-Date
This is an example matrix of a currency rates table:

You can see the rates, their corresponding date in the current filter context, and the column for Currency Rate with Missing. The Currency Rate with Missing column shows the sum of the Fact Currency Rates.
You’ll also notice that there are missing rates. Sales on those dates can’t be converted because there is no rate. It takes the Total Sales measure and multiplies it by nothing. To fix this, you first need to run the Month To Date average.
1. Monthly Average To Date
This is the Month To Date average column for this example:

And this is the measure for that column:

It iterates the date table and the Currently Rate with Missing using the AVERAGEX function.
If you don’t have the Currency Rate with Missing measure, write the SUM of the Fact Currency Rate. Make sure to wrap it in a CALCULATE function to invoke the context transition.
Next, use the time intelligence function DATESMTD to filter all DimDate.
Before you put that measure in the matrix, you need to make sure that your date table is marked. Go to Table Tools and choose Mark As date table. It will make you pick a row or column that has unique values, which is always the Date column.

This step is important because it ensures that the time intelligence functions will work correctly. Otherwise, you could get weird results.
The next thing to do is check the math on the Monthly Average Rate To Date For All Days column.
Export the raw data to Excel and do it manually there. Check the results of both Excel and DAX.
The table in Excel is the same as the matrix table in Power BI.
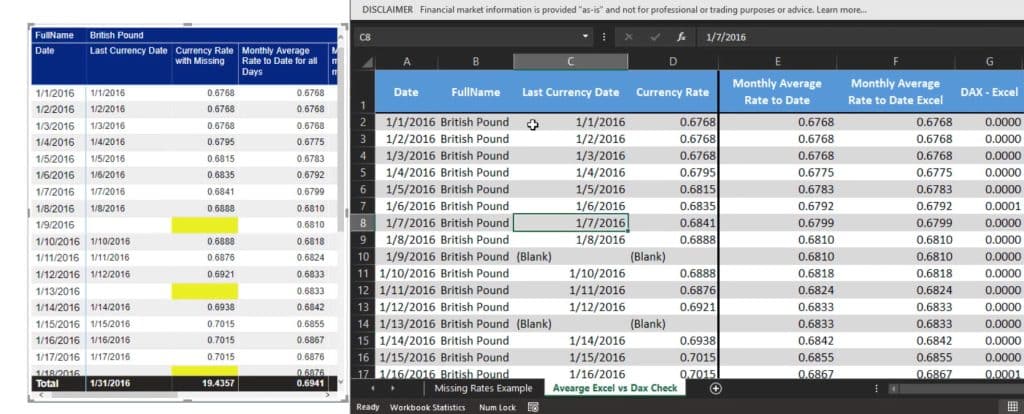
Get the difference of what DAX and Excel produces.
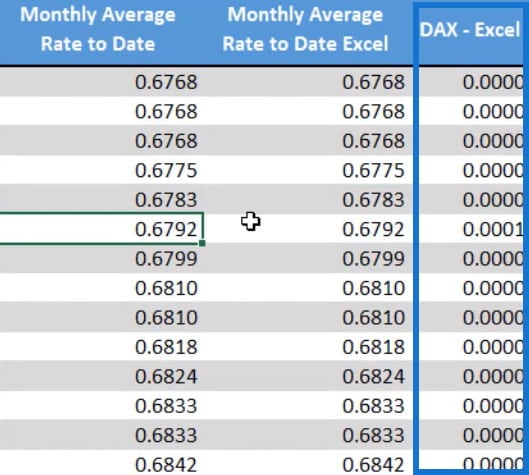
The 0 values in the DAX-Excel column means that the results are correct and the measure is working properly.
2. Monthly Average To Date for Missing Currency Rates While Using Actual Rate If Present
If an actual rate exists, you can add another measure to fill the missing rate days. Then, you can put it inside the table.

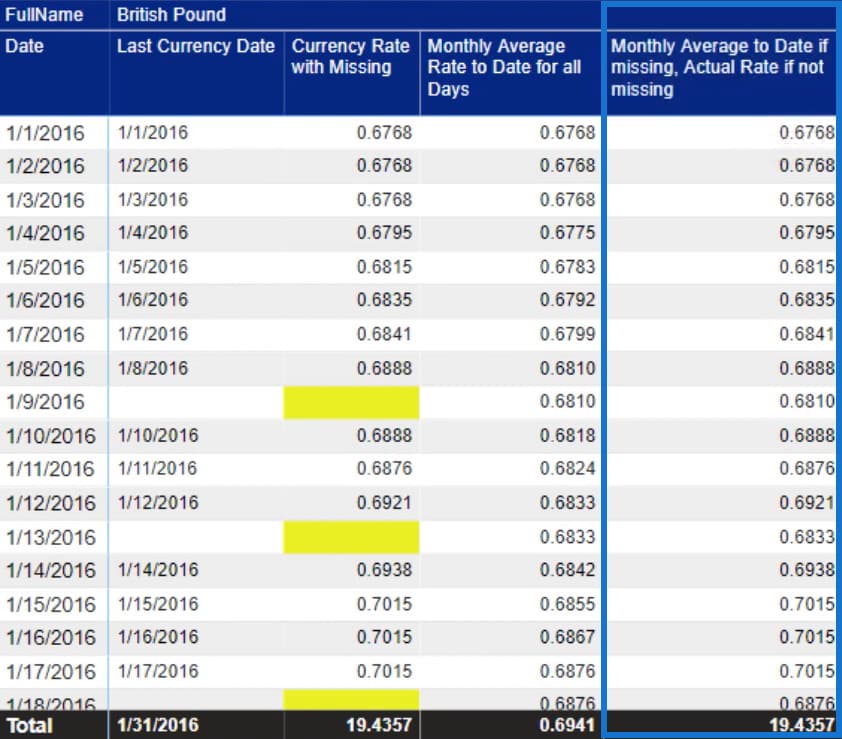
It checks IF the Last Currency Date ISBLANK. It uses the Monthly Average Rate To Date For All Days measure. Otherwise, it uses the Currency Rate With Missing which is the currency rate for that day.
Using The Start/End Of The Month Rate
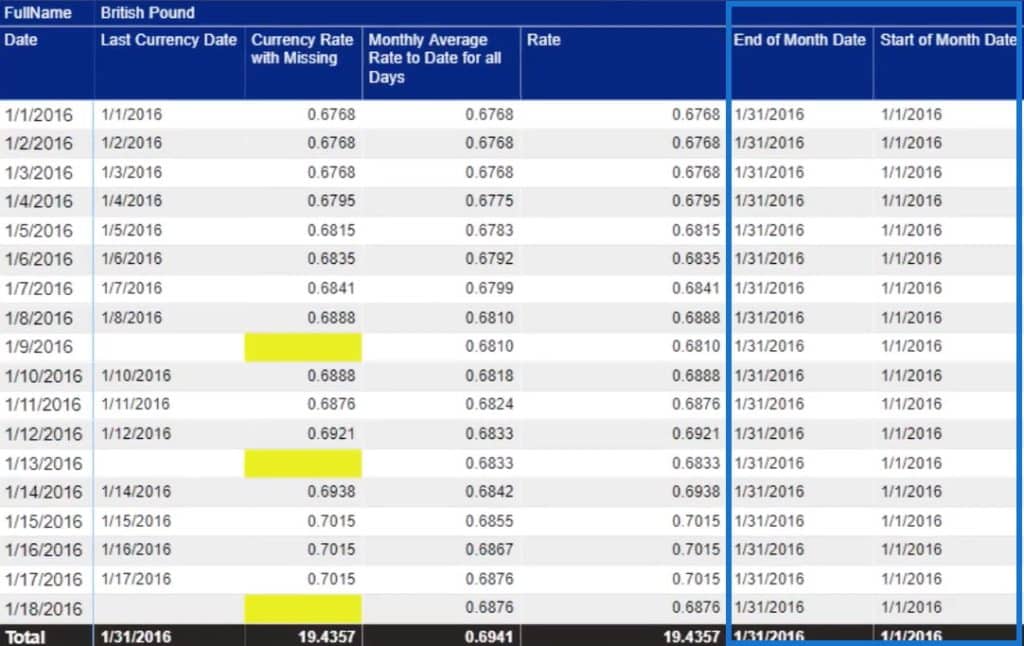
Next, you need to add a measure that identifies the start and end of a month. For this, you have to use the time intelligence functions ENDOFMONTH and STARTOFMONTH.


Place them inside the matrix.
Combining Different Types Of Currency Rates
This is a new setup with a slicer for currency and rate selection.
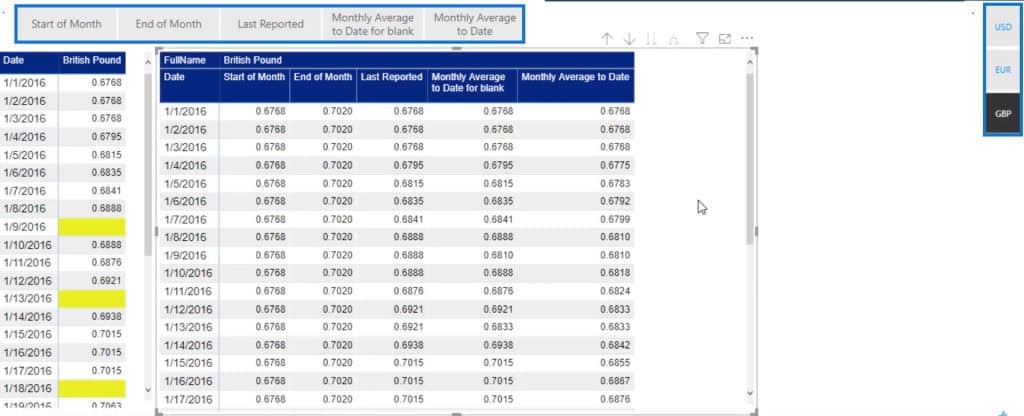
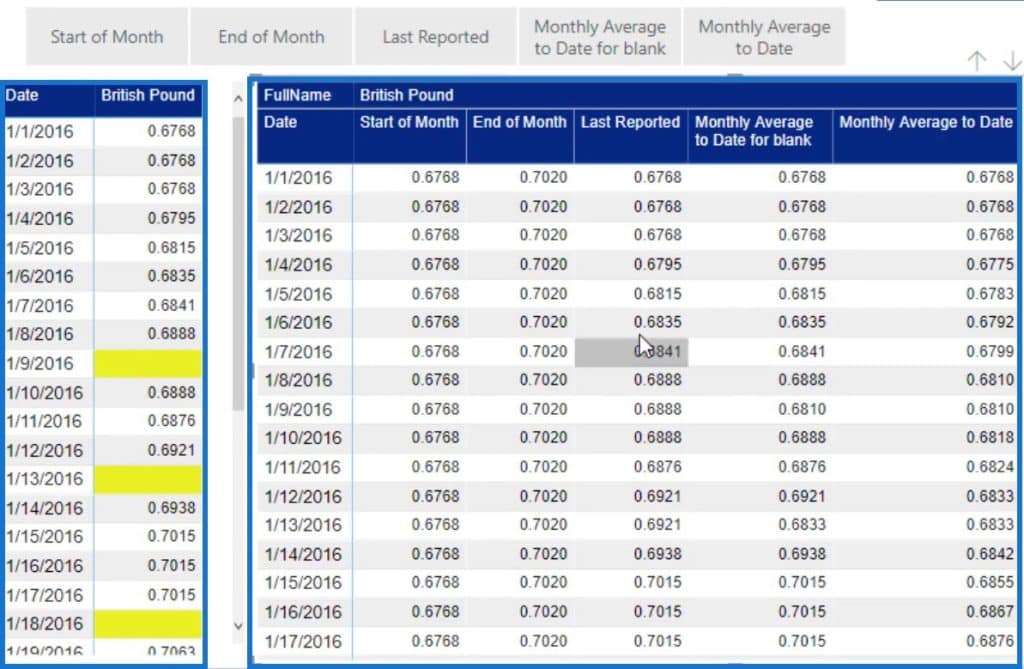
It also consists of 2 tables. The left table is the actual rate table and the right is filled with the missing data in various ways.
The table on the right has 5 methods of accounting for missing currency rates and were produced by a single measure.
Create A Rate Table
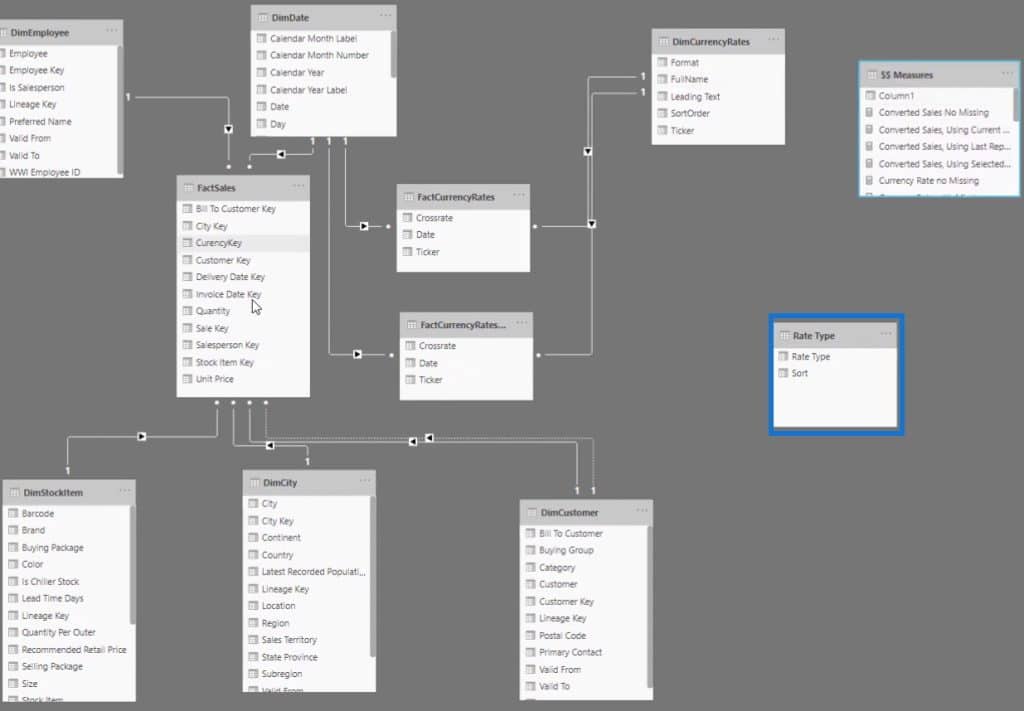
Go to your data model and create a table without any relationships to other tables. In this example, it’s called Rate Type.
This is the measure for the Rate Table.
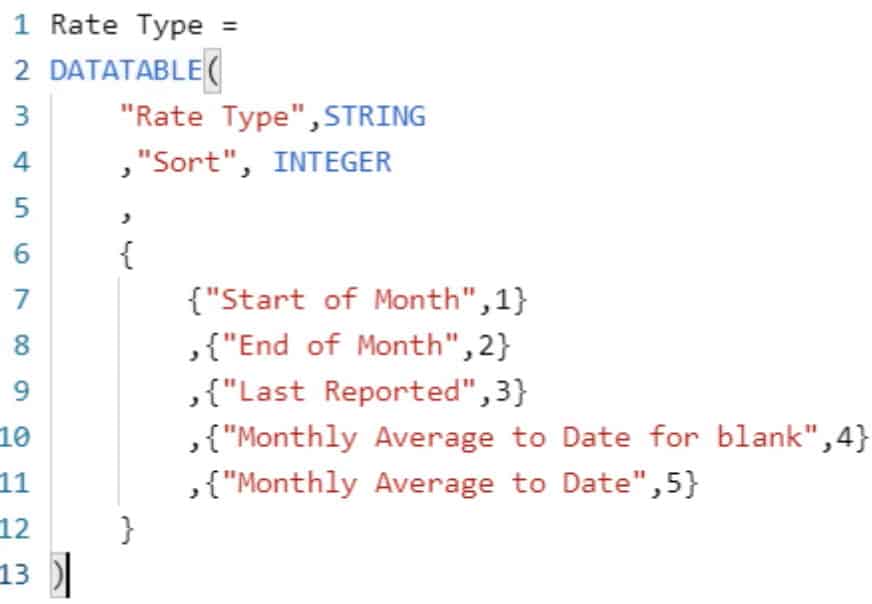
The measure uses the DATATABLE function to produce the actual table. You’ll also see the column headers, types, and the option lists.
Sorting the table also sets the order of the slicer. To do so, you have to go to Column Tools and choose Sort. Then, you can change the sort order inside the measure.

Reference All Measures Together
This is the Selected Currency Rate measure. It uses the VAR function to reference different measures and generate different results.
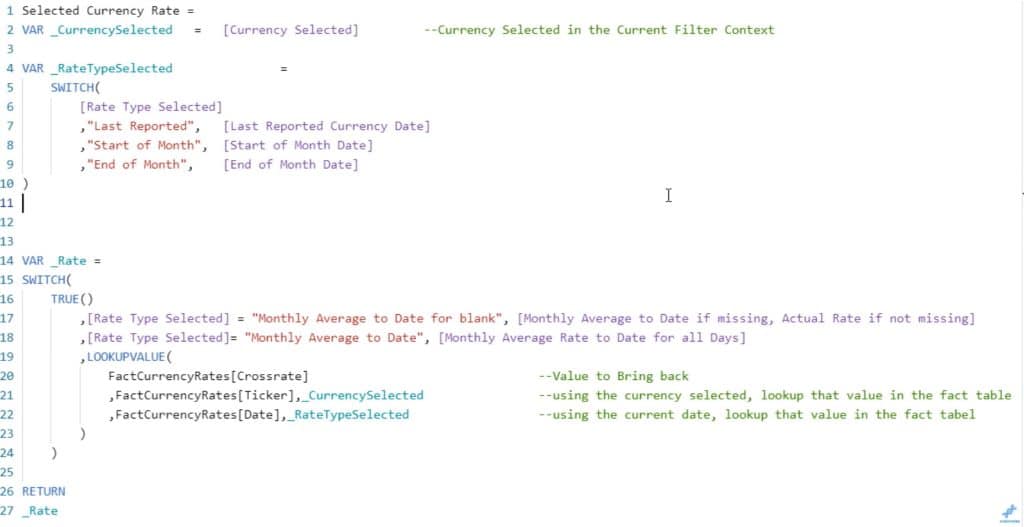
The first variable is the Currency Selected measure which is a simple SELECTEDVALUE function with the DimCurrencyRates. This gives you the USD currency if there is more than one currency selected in the current filter context.

The second variable is the Rate Type Selected.

It’s a simple SELECTEDVALUE function for the Rate Table type that tells you what current rate type you want in the current filter context. If there’s more than one selected, it gives you the Last Reported value.
It identifies if the Last Reported currency date chose Start Of Month or End Of Month using the SWITCH function.
The last variable is Rate. It identifies if the Monthly Average To Date For Blank or Monthly Average To Date is chosen.
A SWITCH and TRUE function is used to iterate and identify which is true. If the value is true, it stops and gives you the corresponding result.
If none of the two statements are true, it triggers the LOOKUPVALUE and looks for value in the Currency Rates Selected and Rate Type Selected.

Presenting Different Currency Rates Types
These are the Total Sales converted into 5 different ways which can be viewed depending on the users’ preference using a slicer:
- Start Of Month
- End Of Month
- Last Reported
- Monthly Average To Date For Blank
- Monthly Average to Date
This is what they look like in a table:

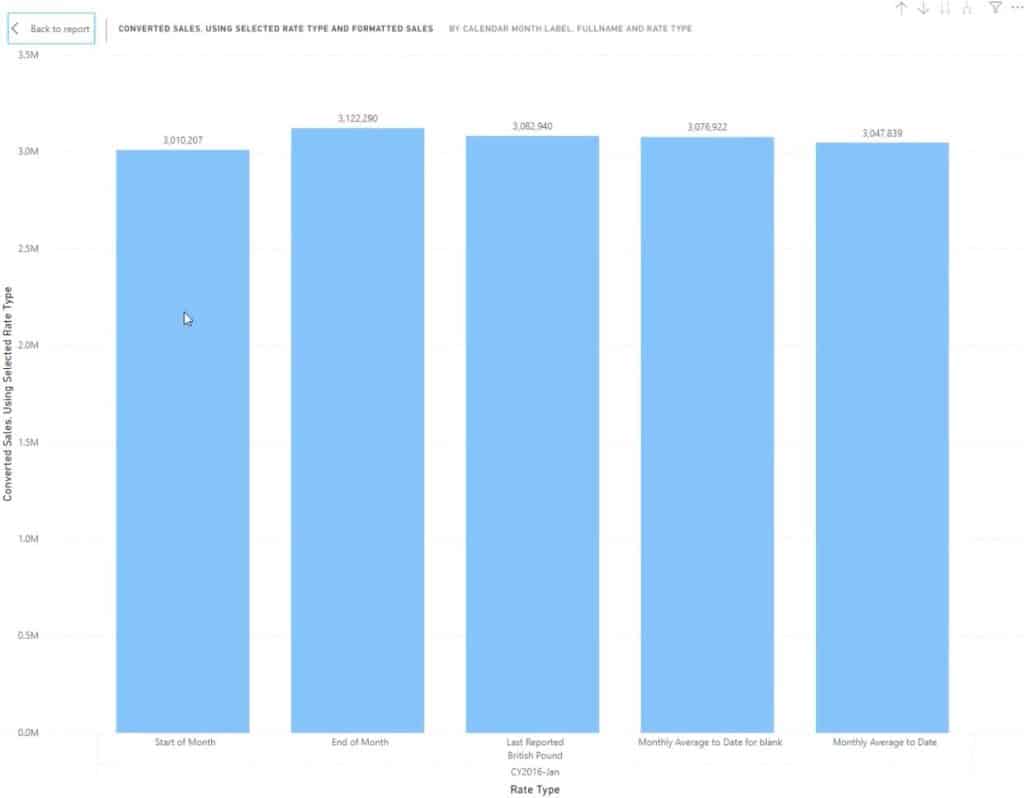
You’ll also see a chart that shows the five different methods and types of Sales for January of 2016.
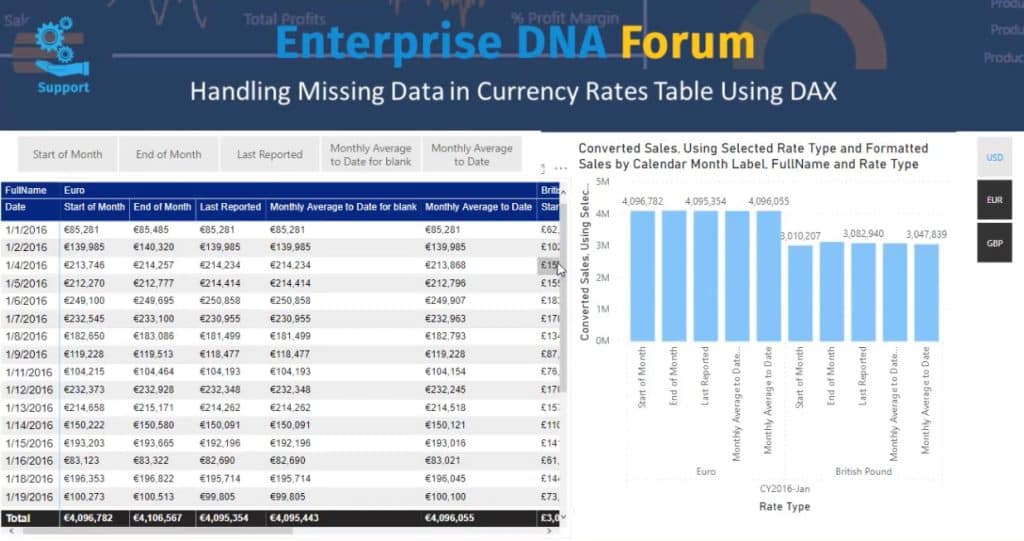
Putting all the visuals together, you get this final version of the dashboard:
And there you have it! Those are the methods for handling missing data in currency rates.
Conclusion
This tutorial showed you how to deal with missing currency rates in Power BI using measures and DAX functions. If you have a problem managing and presenting missing data rates in your report, you can take advantage of this tutorial.
Hopefully, you’ve learned the various ways to obtain those missing data and present them to Power BI users in your organization.
Nick
***** Related Links *****
Solving Missing Currency Rates With Power Query In Power BI
Currency Rates Table – Accounting For Missing Data With DAX
Multiple Currency Logic In Power BI – A LOOKUPVALUE Example


