
I’m going to show you how you can create Power BI tables using a formula that combines the UNION function and the ROW function. You may watch the full video of this tutorial at the bottom of this blog.
There are many ways to create Power BI tables but in this case, I will show you a powerful technique that can provide you with valuable information and insights.
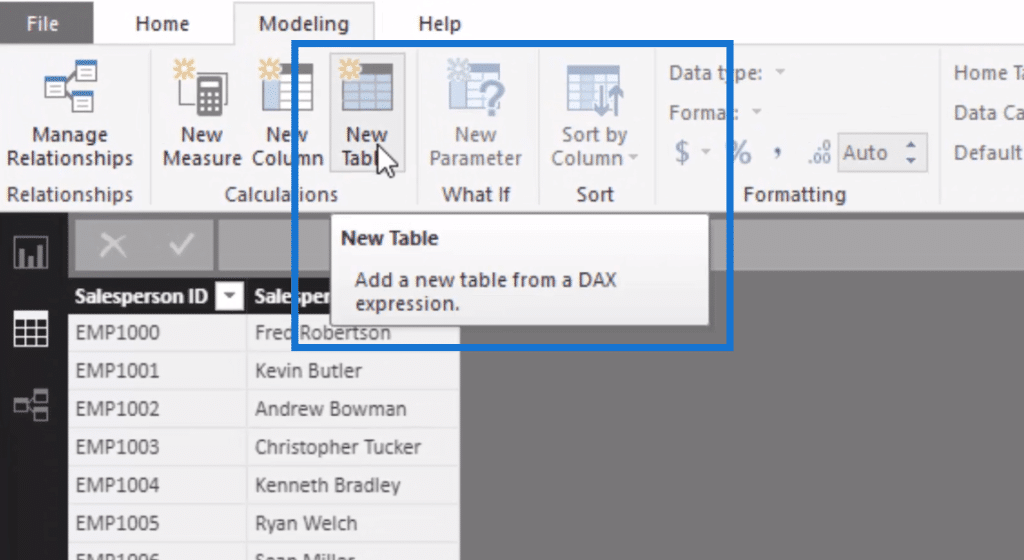
To create a table with a formula, we need to use the New Table feature here in the Modeling ribbon. This feature enables us to use a variety of DAX functions that would return a table.

In this tutorial, I want to create a totally brand new table just by inputting parameters inside a formula. Then I’ll compare it with alternative methods of creating Power BI tables and let you understand why you should use this technique in some scenarios.
Using ROW To Create A Table
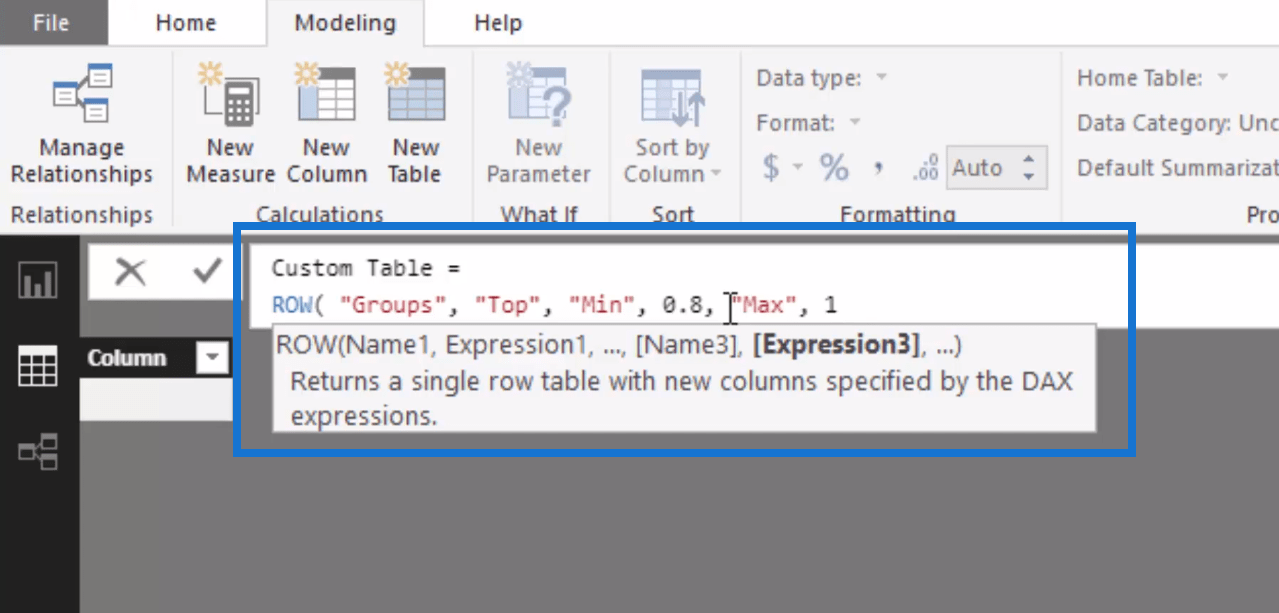
We can already create a table with the ROW function alone. We click on New Table, and type in the formula. In this demonstration, we’ll call this Custom Table.
With the ROW function, we can create one row of information on anything. All we have to do is name the column and then put inside the expression or value. We can just keep going as to how many columns we’ll have in our table.
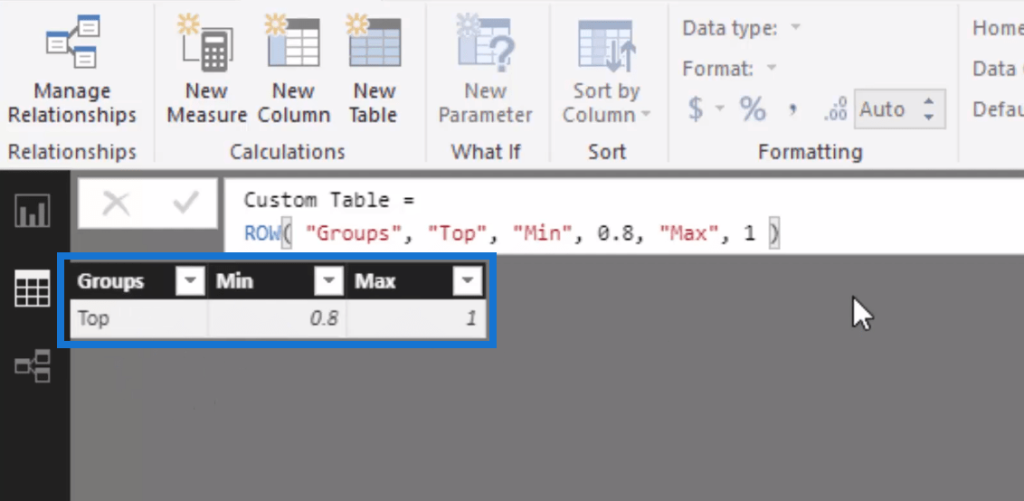
With this data that we entered into our ROW formula, it returns a one-row table.
Combining ROW With UNION
The UNION function allows us to bring two or more tables together or layer one on top of another for as many as we want.
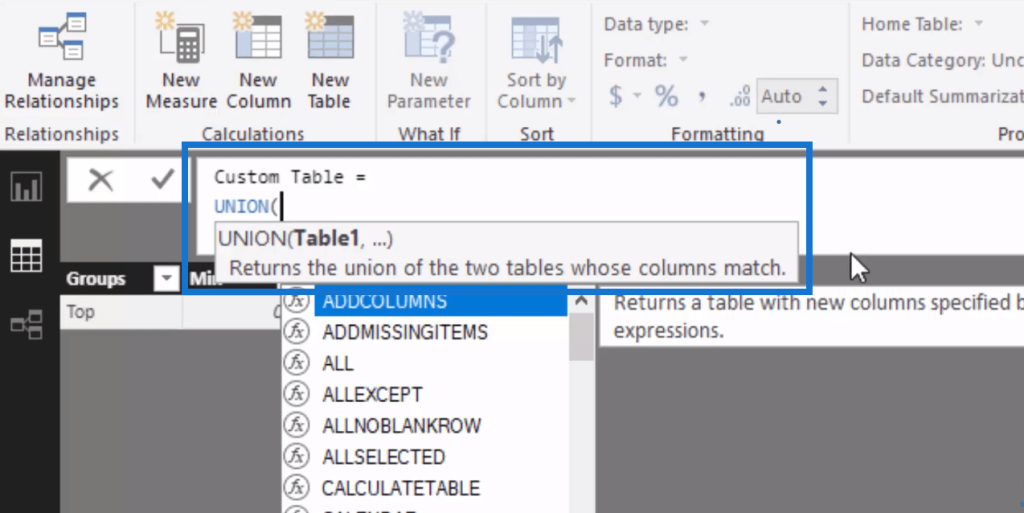
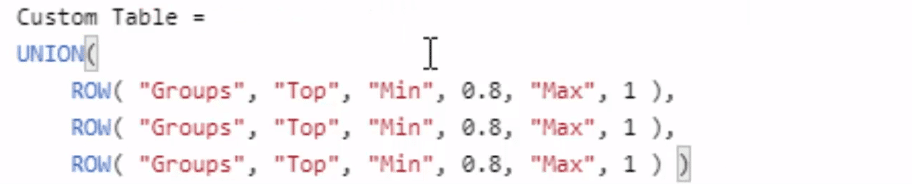
We simply put a comma after each row, go down to a new line, and then copy and paste the first ROW formula.

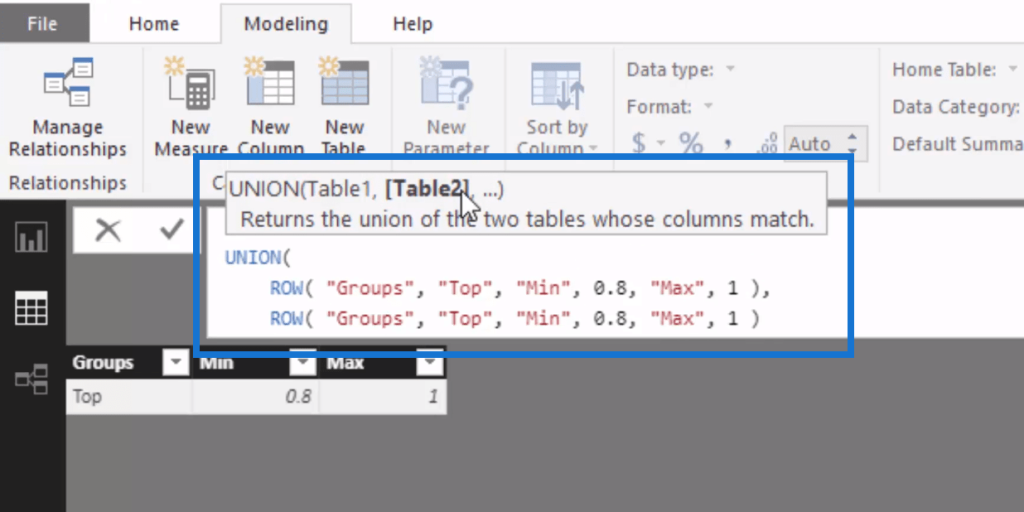
We can place as many tables (rows) as we can here then close it off.
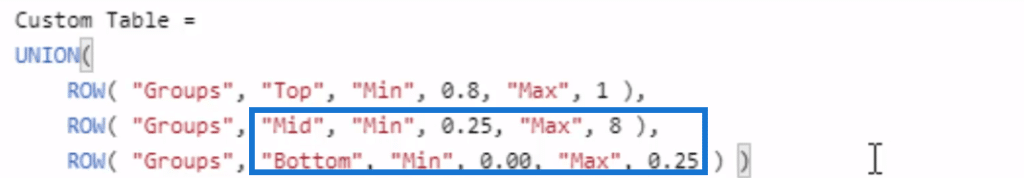
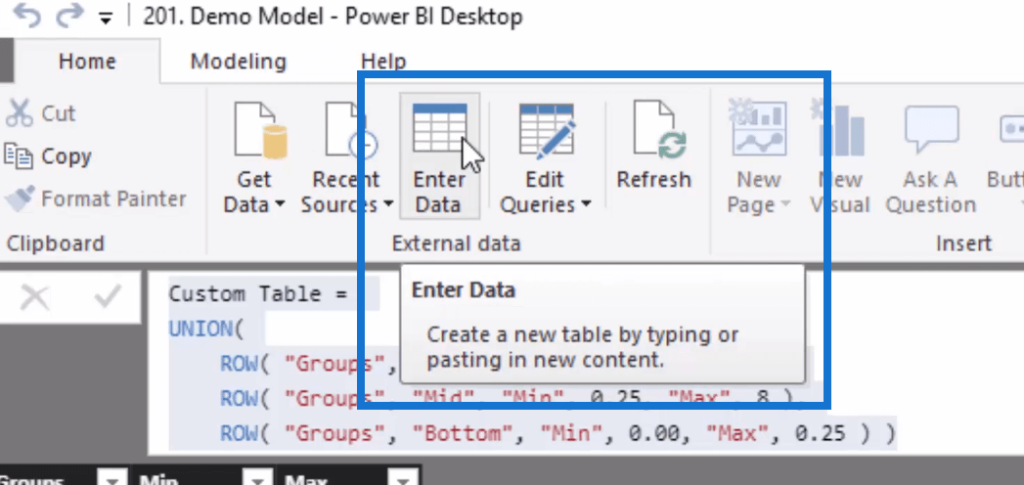
And then all we have to do is change the parameters (Group or Segment, Min, and Max) inside here. In this example, I’m just using some random values, but you could definitely put whatever you want in here.
You might have seen me go through a technique like this or create tables like this manually, which I call supporting tables.
Now that we have these ROWs incorporated with UNION, we generate this table just by the information or code that we have written inside here.
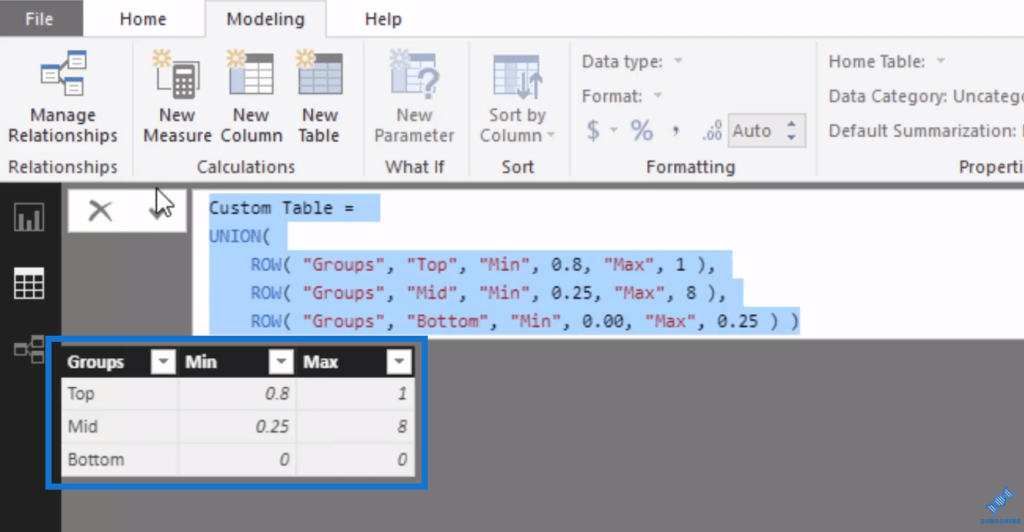
We can then see that we now have this supporting table inside the data model.
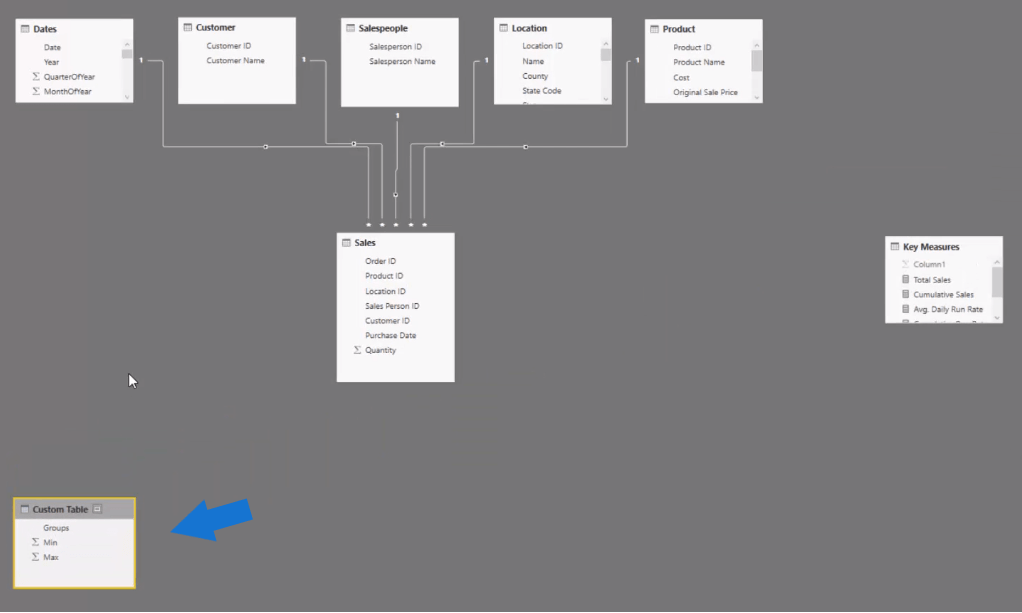
I usually put my supporting tables down the bottom to show they aren’t part of the core model, but would have a logic that would run through them.
Why Use DAX To Create A Table
Some of you might be thinking that we could’ve just created this table by going Enter Data. Well, that’s true. We could also have it in Excel or have some simple table elsewhere.
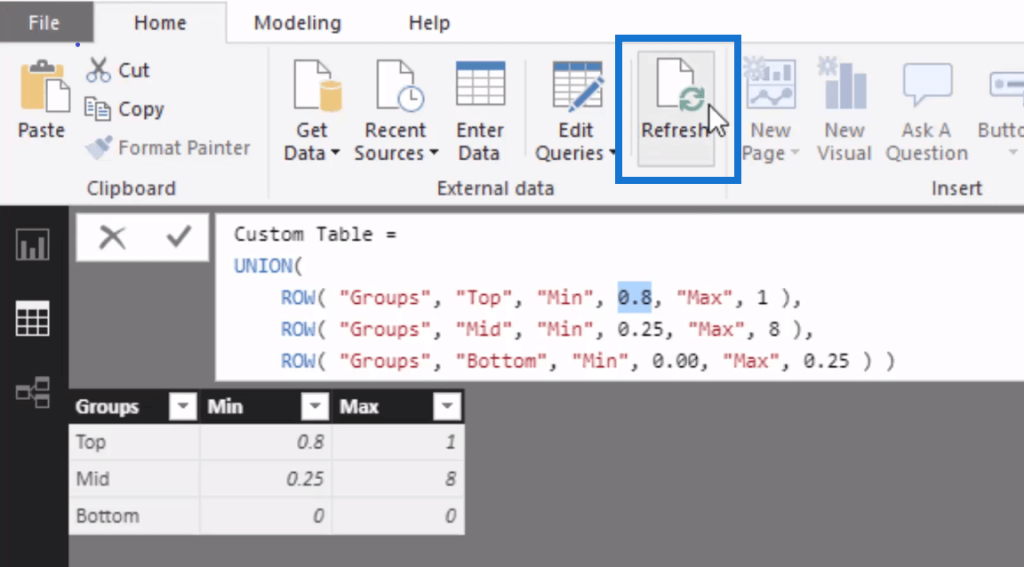
However, this technique of combining UNION and ROW could be relevant if we want to grab these numbers and the parameters we set from somewhere else in your model or Power BI in a dynamic way.
This is how, on Refresh, you could get this table to update with the information or results that have been calculated inside Power BI. That’s why this technique is so powerful.
For instance, we want to segment our customers based on sales, but the sales amounts change for the Min and Max. It might be a different number based on the average sales that our customers are making.
We can generate this table more dynamically by having a calculation that breaks up our customer information based on the sales amount that is being generated.
We could also use this virtually. We can create a table like this and input it as a table function inside a variable, which goes inside a calculation. There are other ways that we can apply this in which I demonstrate in other tutorials.
***** Related Links*****
Power BI Advanced Analytics: Secondary Table Logic Techniques
Create A New Table In Power BI: How To Implement Budgets & Forecasts Automatically Using DAX
Create Compelling Power BI Insights Fast For Financial Analysis
Conclusion
In this blog, we go through how we can create Power BI tables using the ROW function together with the UNION function. We simply used the New Table feature and input the formula with the parameters we want to set.
There are many ways that you can create tables like this, but this particular technique is crucial and applicable in certain scenarios in Power BI analytics.

This is a great technique that you could easily implement in your own work.
Enjoy this one!
Cheers!
Sam
***** Learning Power BI? *****
FREE COURSE – Ultimate Beginners Guide To Power BI
FREE COURSE – Ultimate Beginners Guide To DAX
FREE – 60 Page DAX Reference Guide Download
FREE – Power BI Resources
Enterprise DNA Membership
Enterprise DNA Online
Enterprise DNA Events


