Once you start creating measures in Power BI, it’s necessary to learn how to organize everything. Creating measure groups is one of the best ways to make sure everything is in its proper place. You may watch the full video of this tutorial at the bottom of this blog.
Measure groups are like folders where you put similar measures together. They help make the entire process seamless, regardless if you’re completing simple calculations or are working on more advanced reports.
How To Create Measure Groups
As you work with DAX and progress to more advanced reports, your measures will quickly accumulate. This could end up overwhelming and confusing you, especially if you don’t organize these measures right off the bat.
This is why it’s important to organize this area on the right so that it’s easy to find the right measures as you work through your reports.
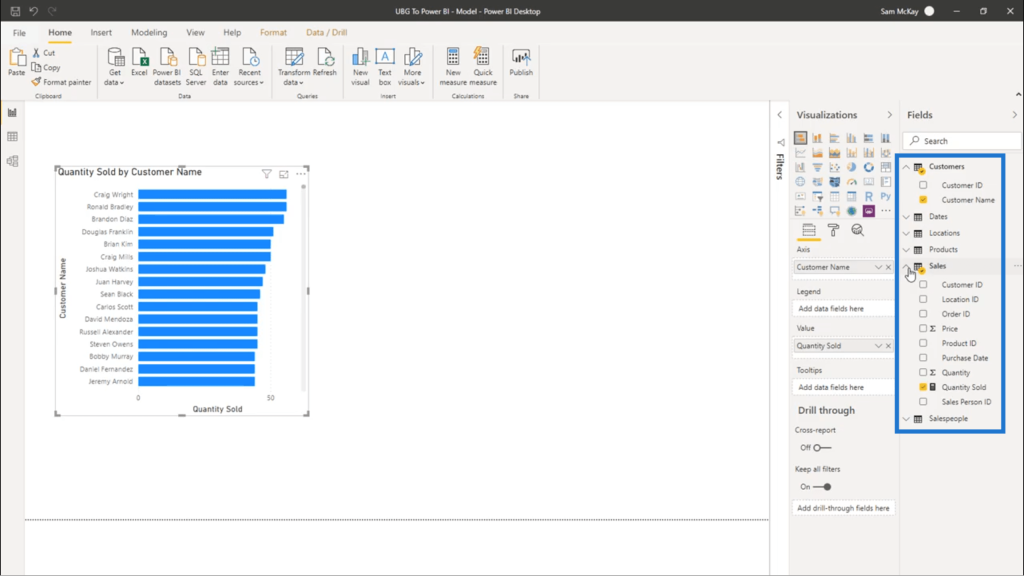
Measure groups (or measure tables, as others would call them) make it really simple to locate the measures you need as you create them. Let me show you how to create one.
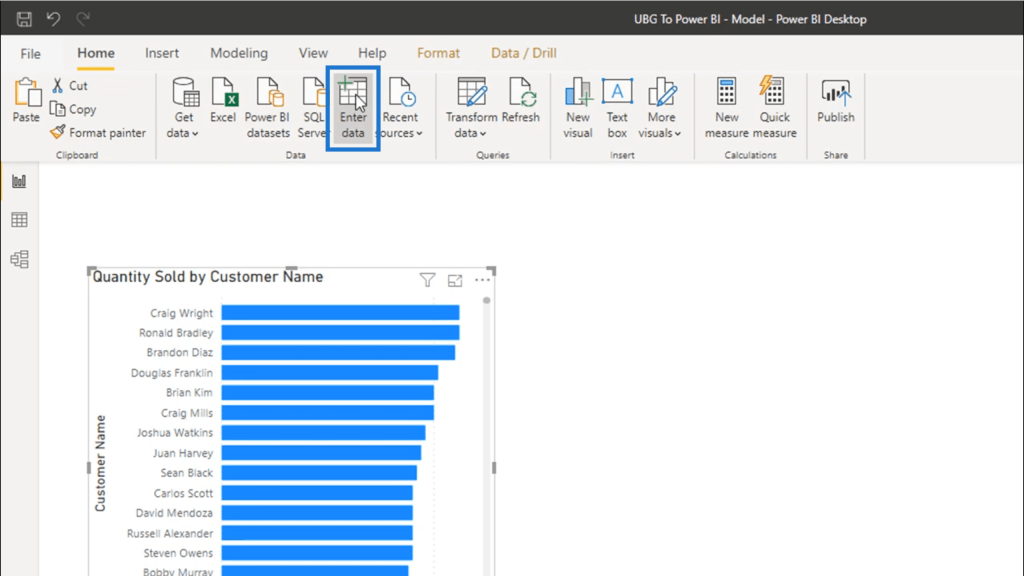
The first step in creating a measure group is creating a dummy table. I’ll do that by clicking on the Enter Data icon up here in the Home ribbon.
A new window that allows me to create a new table will pop up. There’s no need to put anything in the table. I just need to name the group. I’m going to call this Key Measures.
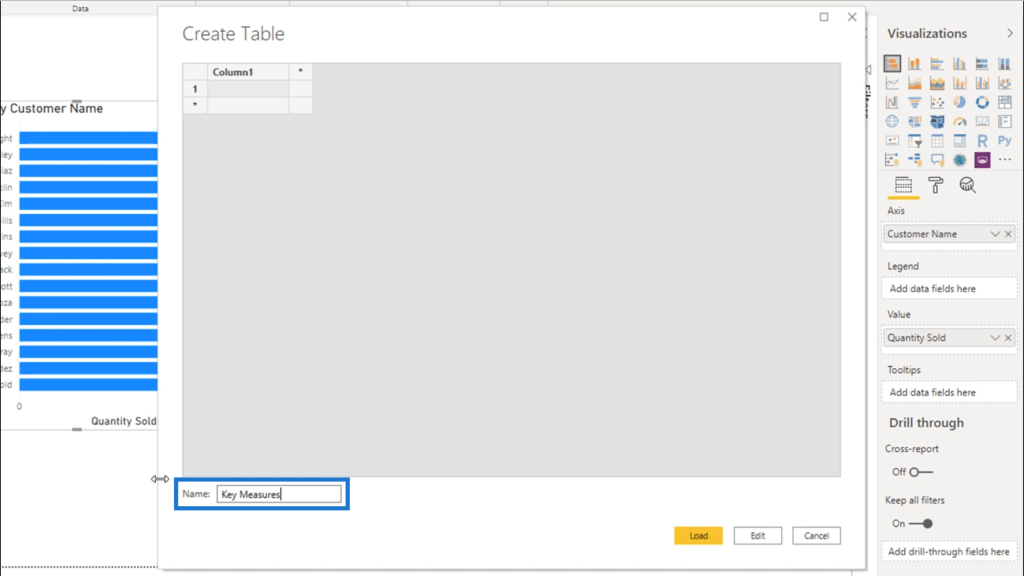
Make sure that your first measure group is always named in a generic manner, like Key Measures or Core Measures. This allows anyone who will eventually work on your reports to easily spot what they need.
Once that’s loaded, I’ll end up with a blank table called Key Measures found under the Fields section.
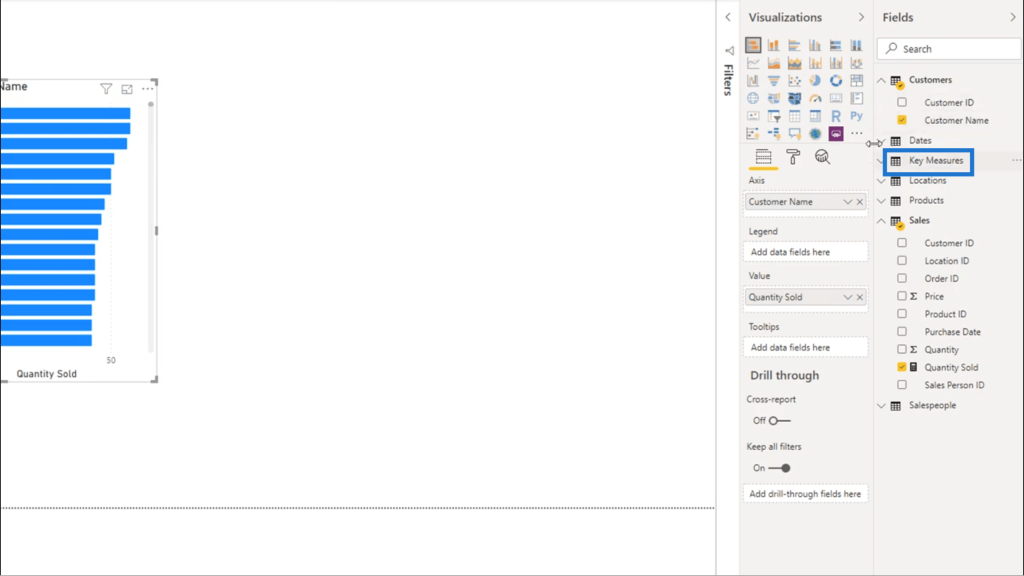
Next, I’m going to move the measure Quantity Sold into that dummy table.
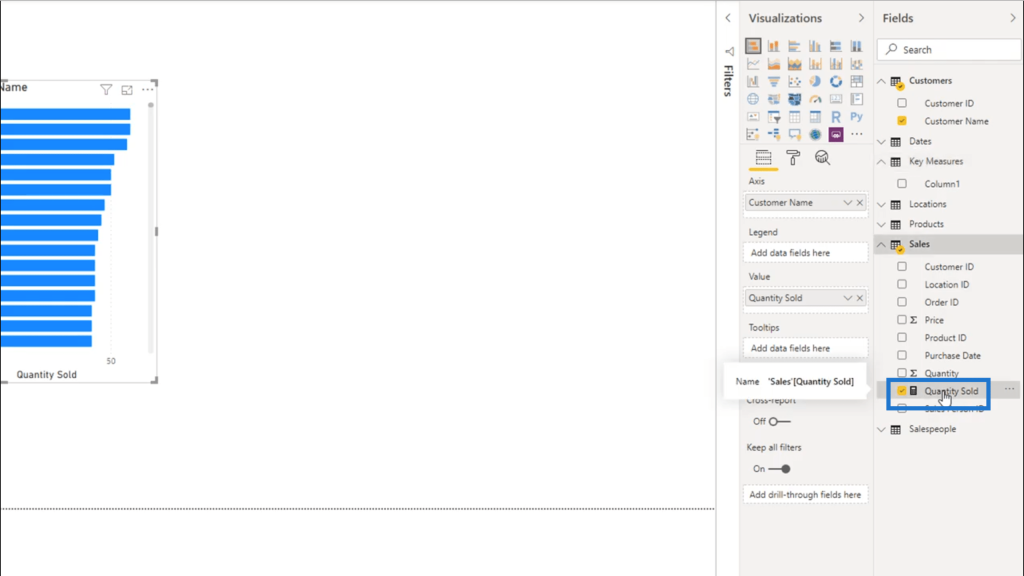
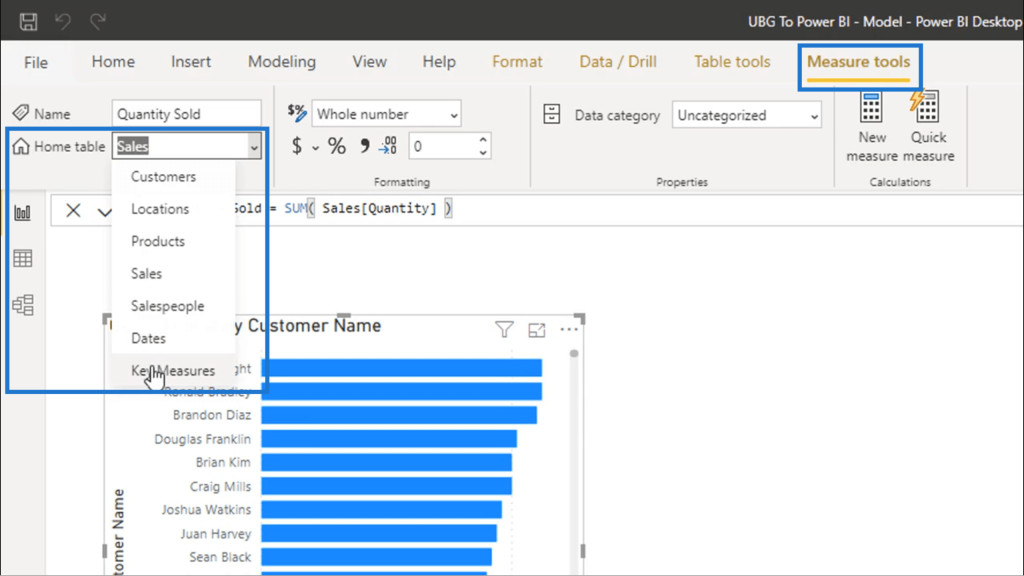
To do that, I’ll go into Measure Tools. Since I already clicked on Quantity Sold before going here, you’ll see that it automatically shows up on the Name field. I’ll just choose Key Measures on the Home Table field below that.
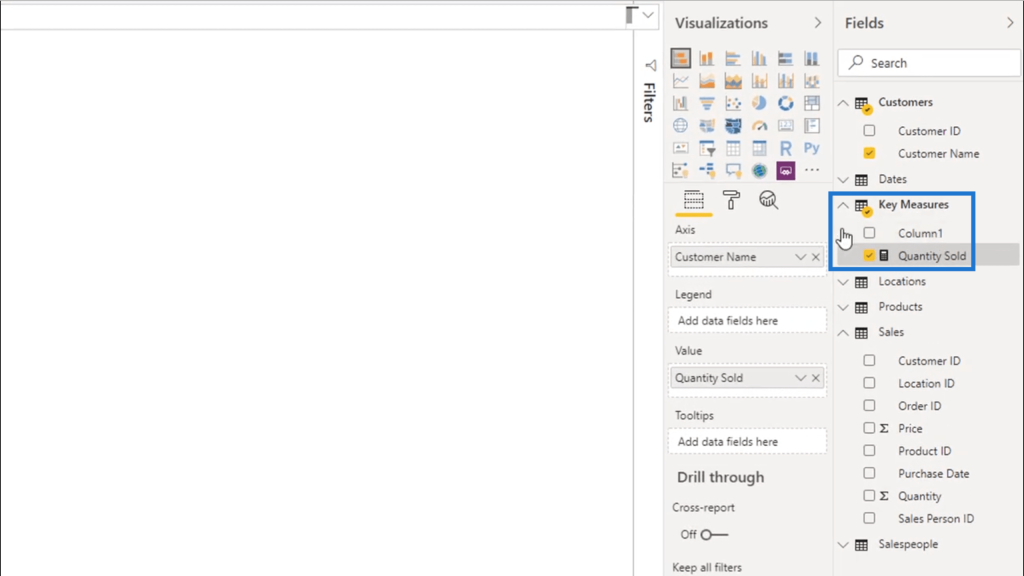
Once that’s done, you’ll see that Quantity Sold is now under my Key Measures group.
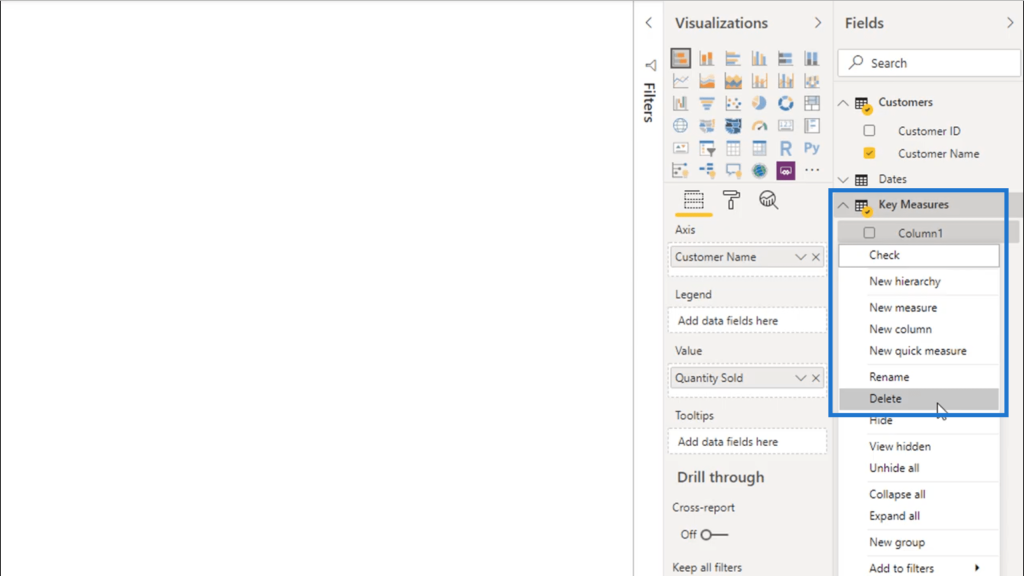
I can now delete the empty column here, since I already have something under the Key Measures field.
Now, I only have one measure remaining in that group.
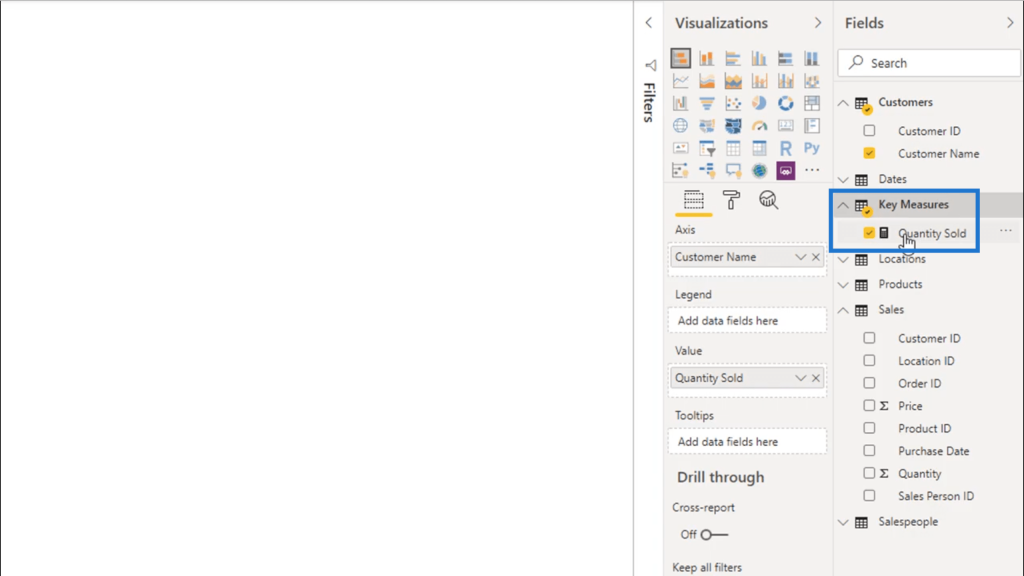
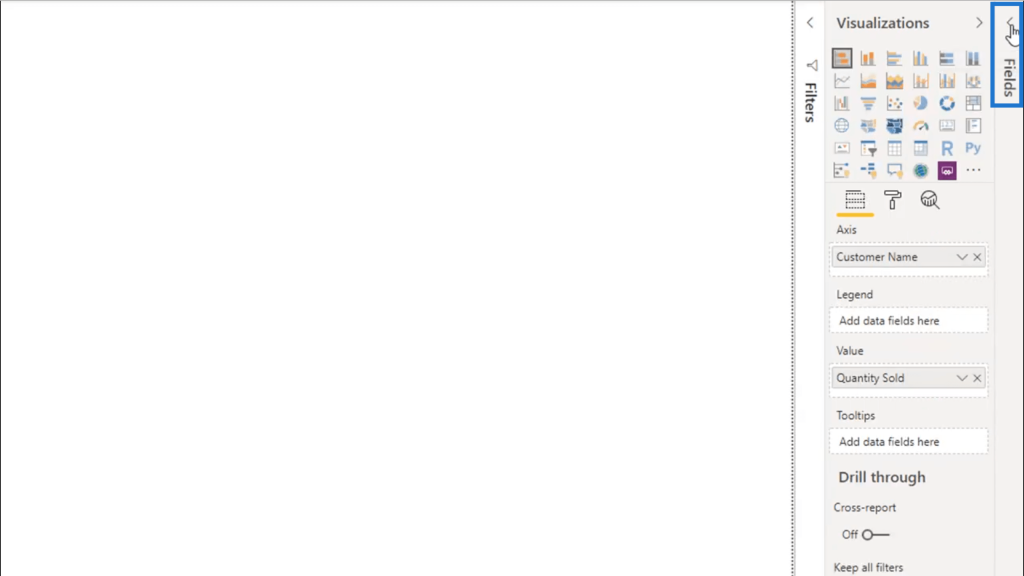
I just need to click on the arrow on the far right of the Fields pane to hide it.
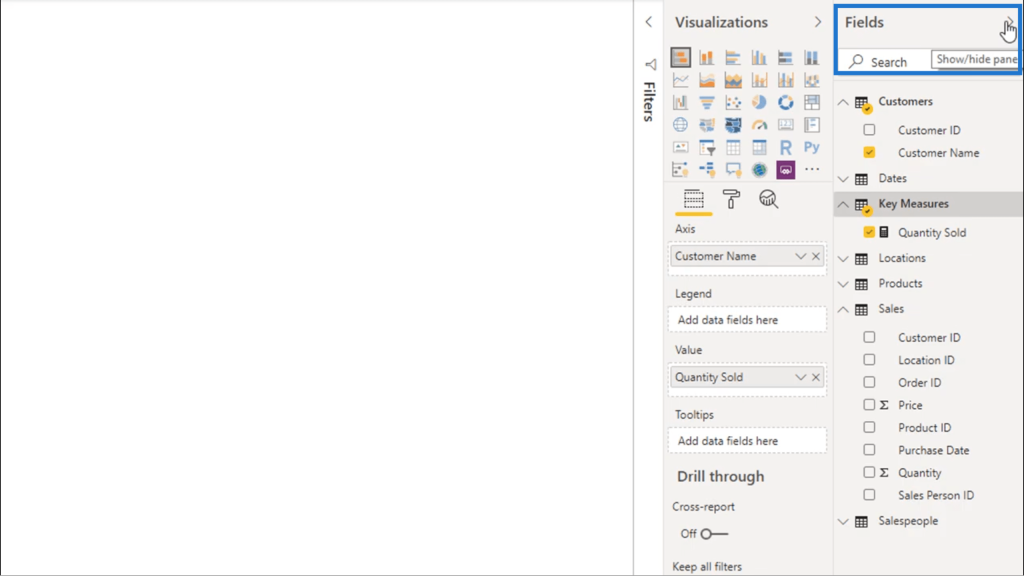
And then, I’m going to click that arrow again to show the pane.
Once the pane shows up, my Key Measures is now on top. This gives me easy access to the key measures I’ll be using as I work on my reports.
You’ll also notice that the logo beside Key Measures has now changed, showing that it’s not just a mere table any longer.
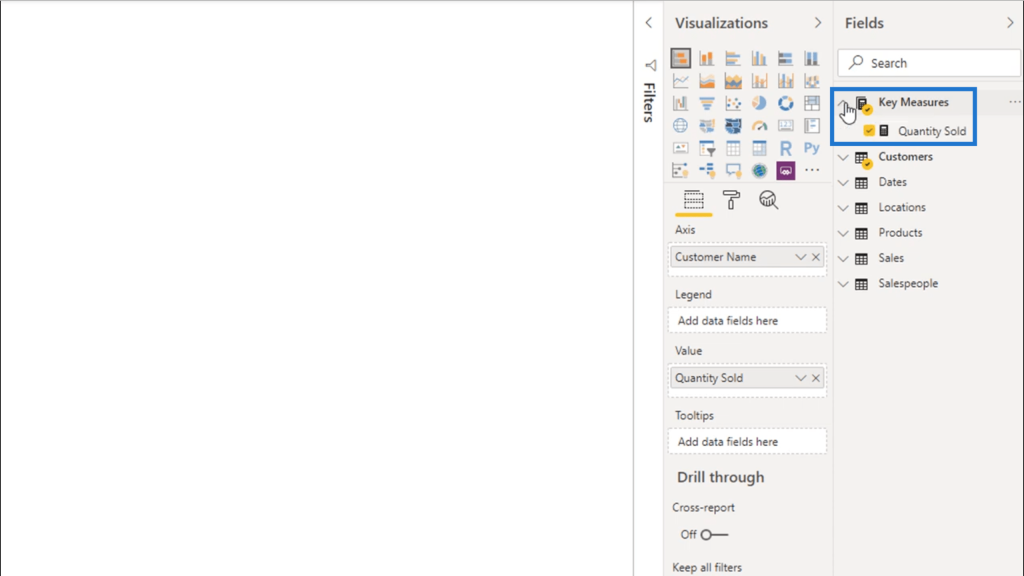
As I create more measures, I can either add them to this group if they qualify as a key measure, or create a new group for them depending on the case.
For example, if I come up with measures I’ll be needing for time comparison, moving averages or cumulative totals, I can name each group accordingly.
Other Areas To Organize
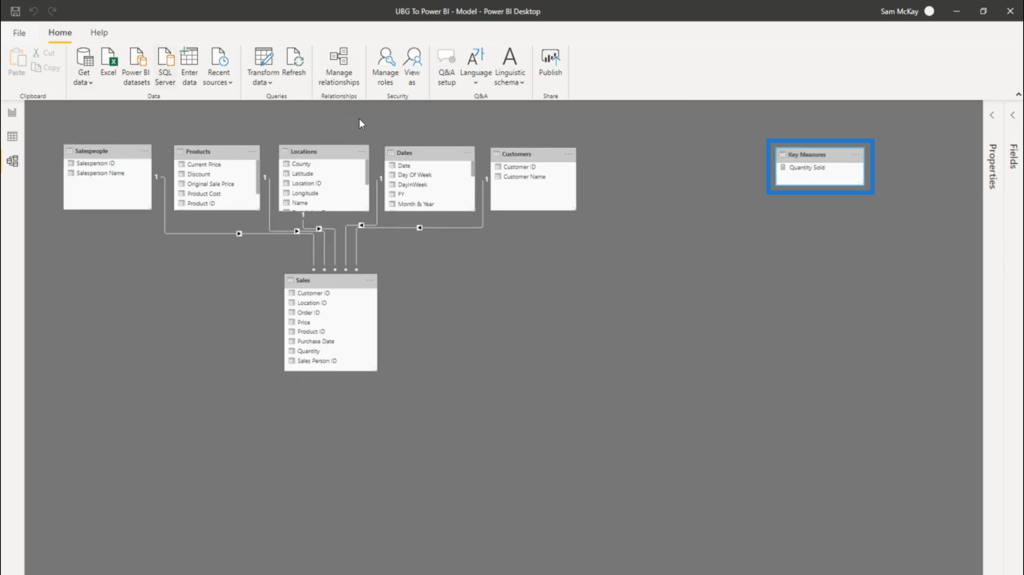
Aside from the Fields section, note that these measure groups will also appear inside the modeling area.
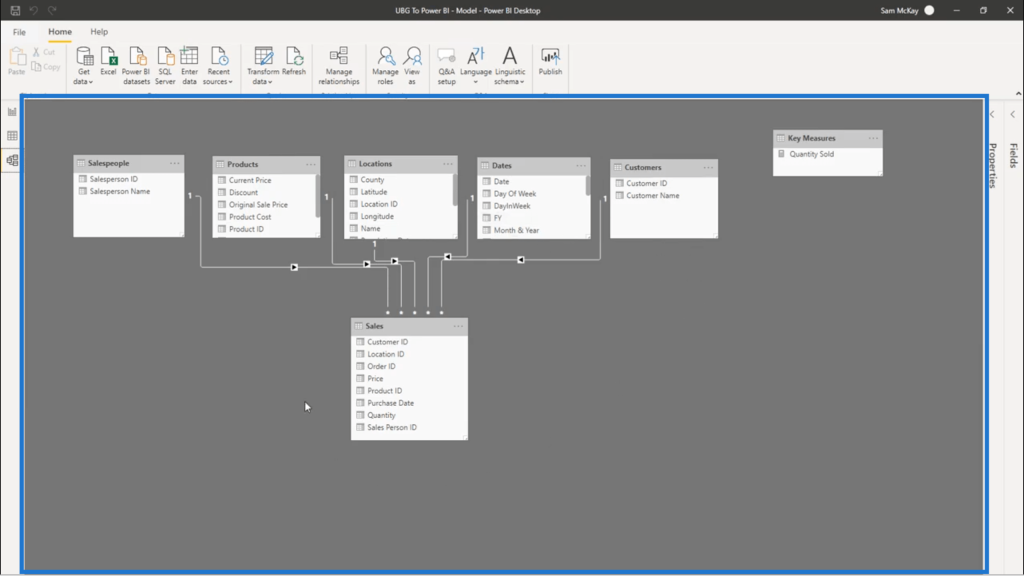
I generally put these on one side away from my model because they’re only there to run calculations. They won’t be needed in building relationships among the different tables.
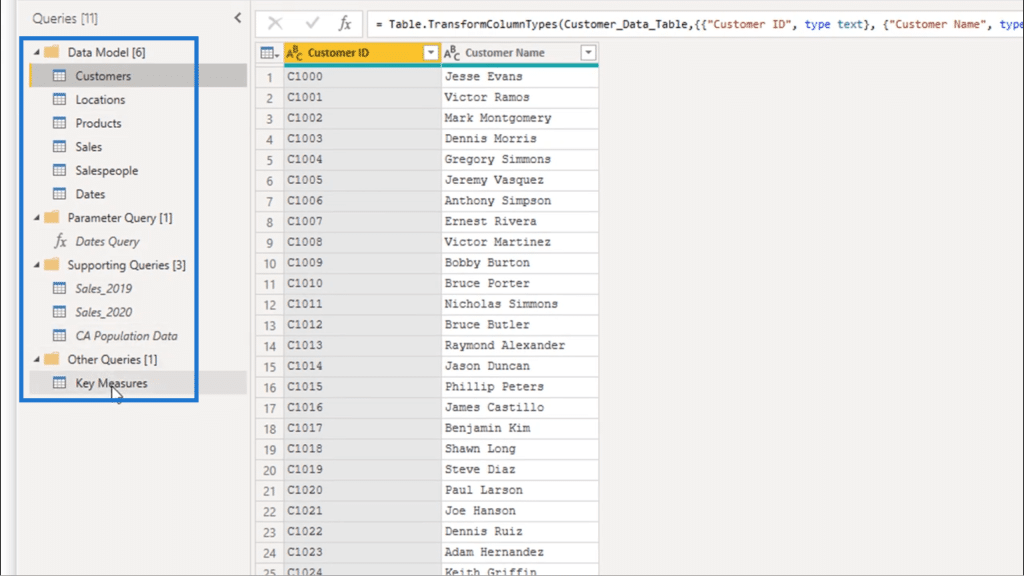
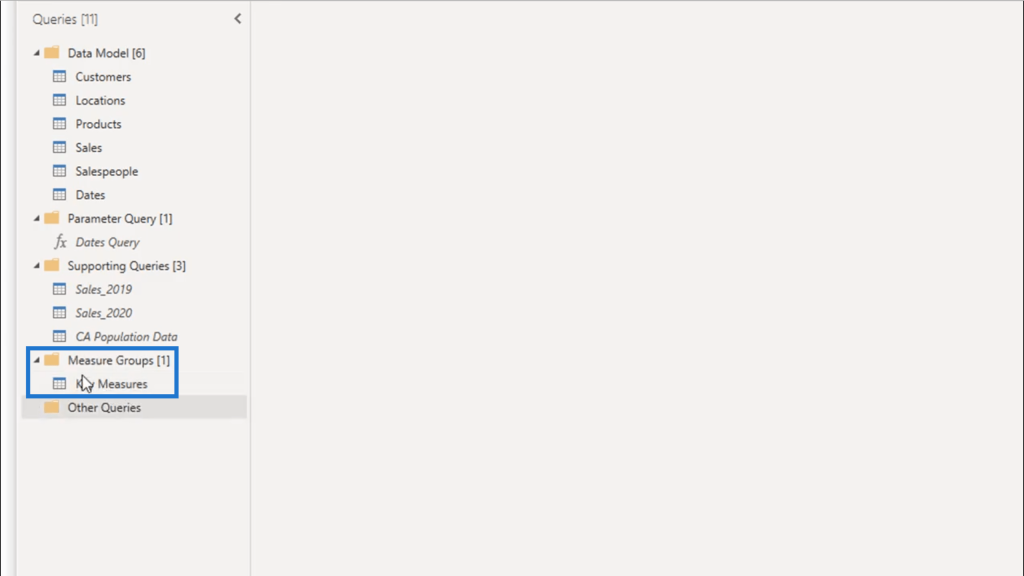
Measure Groups are also created inside the Query Editor. This is why it’s also important to organize this section to make sure that you have the right groups sorted in there.
For my Key Measures group, I’ll just add this to a New Group by doing a right click and choosing Move To Group.
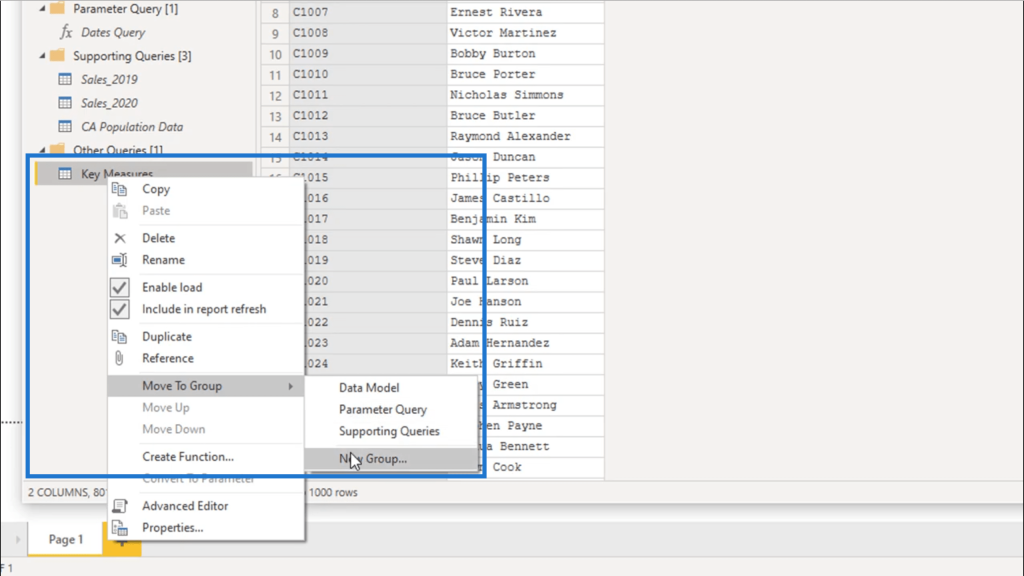
I’m going to call this Measure Groups.
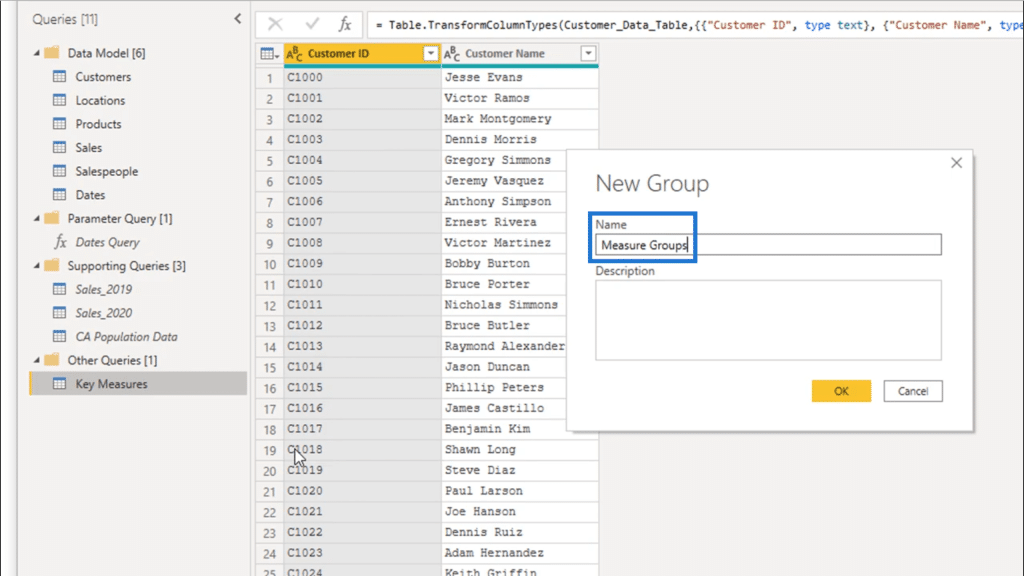
Once I have this folder, I can place all measure groups in it.
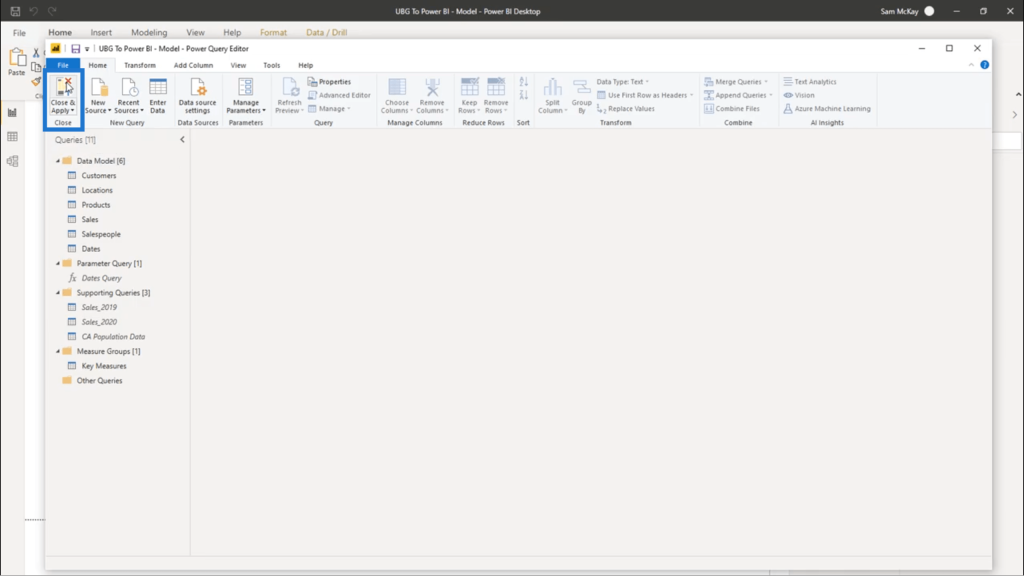
I’m just going to click on Close & Apply to save any changes I made, and any changes will update on the back end.
***** Related Links *****
Implementing DAX Measure Groups Into Your Reports – A Power BI Modeling Review
Top 3 Best Practices To Organize Your Power BI Models
Measure Branching: Power BI Development Strategy
Conclusion
With the help of measure groups, it’s easier to scale into bigger analysis, reports and visualizations. This creates a solid foundation on everything that you want to create.
It’s important to have this as a standard practice to make it easier for you to create a lot more measures. From here, you’ll find it easier to branch out to more advanced things.
All the best,
Sam


