In this tutorial, we’re going to learn how to create a currency conversion table for Sales in Power BI using DAX measures. You may watch the full video of this tutorial at the bottom of this blog.
Using this technique, we would only need to create a simple slicer to convert a currency to another. This is especially useful when dealing with data containing multiple currencies in Power BI.
For this demonstration, we’ll be using the World Wide Importers database from Microsoft.
Assumptions Used
These are the basic assumptions applied in this example:

For the first assumption, this could happen if our source data doesn’t have data for the weekends or holidays. Even if there’s no actual rate on those specific days, it does not mean that a rate does not exist.
The second assumption is that we have a Currency Rate Dimension Table. We can create this based on our fact currency rates and then add different fields to it.
Next, we’re also going to assume that Sales (the measure used in this instance) are converted on the date the sale takes place. We could take the average rate of the month or choose not to convert it to a specific currency until the end of the month.
There are multiple ways of viewing this which depend on the varying businesses’ requirements. But for this demo, we’re just going to say that we want to convert it on the day the sale took place.
We’re also going to assume that all initial Sales made are in USD.
The Data Model From World Wide Importers
Let’s take a look at the data model.

Again, this comes from the World Wide Importers database.
We have two Fact Tables – a Sales table and a Currency Rates table. We can see that the two fact tables are related to the DimDate table from the date column. This will be used as a filter for a matrix or table.
The DimCurrencyRates table is related to the FactCurrencyRates table based on the currency rate ticker.
Now, if we take a look at the DimCurrencyRates table, we can see that the ticker is the unique value that will be related to the FactCurrencyRates table.

There’s also a column containing the full name of the ticker in case some users are unfamiliar with the abbreviations.
The leading text and format columns aren’t going to be used in this demo. They will only serve as columns that allow us to format the currency appropriately using only one measure.
The sorting order is how these currencies will be viewed in a slicer. USD is the most commonly used so it’s placed at the top. It’s a more convenient arrangement compared to making it alphabetical.
Converting Currencies In Power BI
1. Create A Basic Measure
The first step is to create a basic measure.
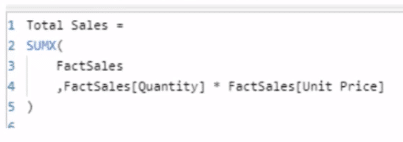
In this case, we’re using Total Sales. For this demo, we don’t have a Total Sales column so, we’re using SUMX to iterate the FactSales and get the Quantity multiplied by the Unit Price.
The table is simply showing the Date and Total Sales:

2. Add A Slicer
For the next step, we’re going to add a slicer from our dimension currency rates tables. We’re going to use the full name of the currencies.

3. Add The Currency Selected And Current Date Measures
We need to have two additional measures to help us figure out the currency the user selected.
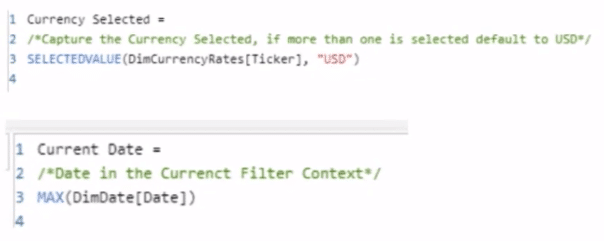
If a user selects more than one currency, it’s going to automatically use the default which is USD.
The default currency will depend on the business requirements. This can also be made to show a blank or an error.
Now, the current date is also important for this technique. And when we say current date, we’re not referring to the date today. Instead, it means the date for the current filter context.
We also want to know where we are, which is again referring to our status in the current filter context.
4. Add The Converted Sales Measure
Let’s now go to the to the file table and determine how to put these together to get a converted value.
This is the final measure to get the converted sales.
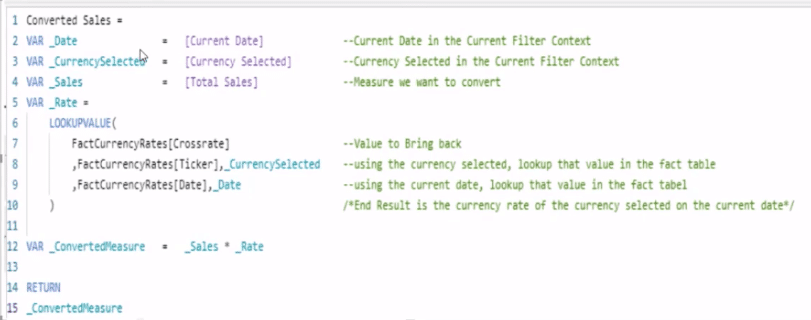
Variables are used because they clean up the code and make it easier to debug.
We want to know where we are in the current date so we have a variable defined as Date. We also have the currency we selected.
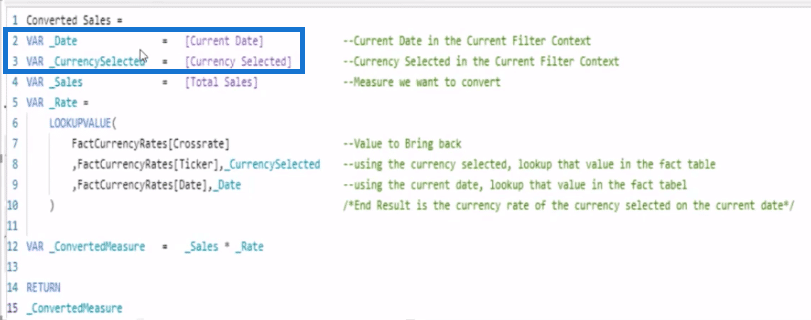
These are the previous two measures we’ve just created.
We’re also including the measure we want to convert.
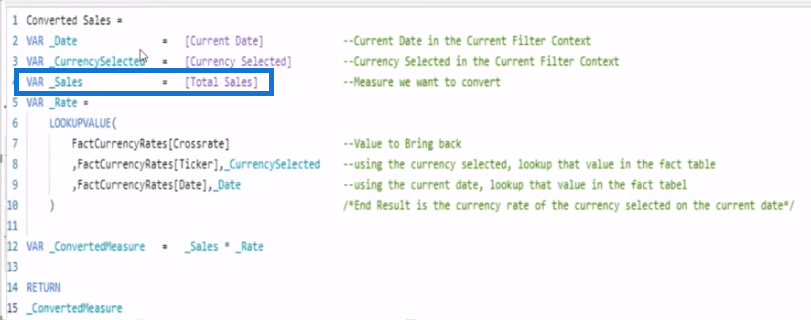
This dimension could be changed to anything. It could be Profit or Margin, among others. But for this example, we’re sticking with Total Sales.
In order to know the rate we need to give, we’re going to look up the Crossrate in the FactCurrencyRates table.
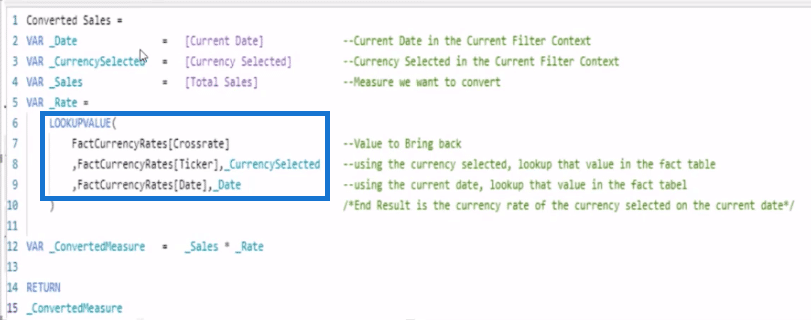
To look up the currency selected, we’re using the Ticker from the same table. This is why CurrencySelected has been set up using a ticker.
With this set up, the current filter context will pull back only one cross rate because there’s only one currency selected at a time.
Next, we only need to multiply the Rate by our Sales to get the converted value.

5. Setting Up The Currency Conversion Table
If we take the FullName of the currency rates table and put it under Columns, we’re going to see the amounts presented in all the different currencies.


So, you have one measure, Converted Sales, which quickly created a currency conversion table containing the Sales amount presented as 20 different currencies.
***** Related Links *****
Multiple Currency Logic In Power BI – A LOOKUPVALUE Example
Power BI Exchange Rates: An Update To Multiple Currencies Management
Implementing DAX Measure Groups Into Your Reports – A Power BI Modeling Review
Conclusion
This technique presented a simple way to create a currency conversion table in Power BI.
The key to make things simple is to make sure we don’t repeat codes, measures, and formulas. It all needs a bit of creative thinking to find solutions that make currency conversion in Power BI easier.
I hope you have learned a lot from this technique.
All the best,
Nick
[youtube https://www.youtube.com/watch?v=i8WKBiTHqVI?rel=0&w=784&h=441


