
In this tutorial, you will learn how to create and format a matrix in Power BI Report Builder. A matrix, also known as a “grid” or “crosstab,” is a powerful visualization tool for comparing and contrasting data across multiple dimensions. With Power BI Report Builder, you can customize the look and feel of your matrix to make it more visually appealing and informative.
In Report Builder, a matrix functions similarly to a pivot table in Excel. It can display grouped data in either row and/or column groups. It can also summarize information and display subtotals and grand totals.


Creating A Matrix In Report Builder
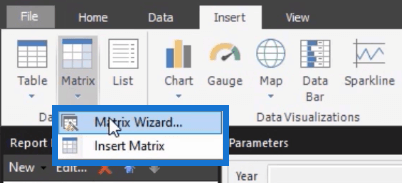
Go to the Insert tab in Report Builder. Click the Matrix option and select Matrix Wizard.
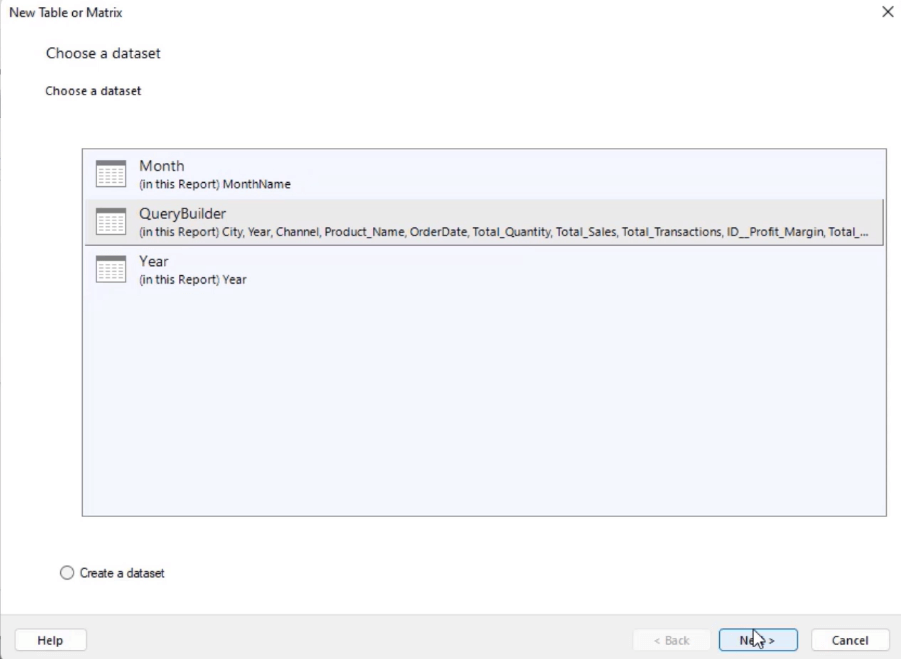
You can either choose an existing dataset or create a new one. In this case, the QueryBuilder dataset is used. Once you’re done, click Next.
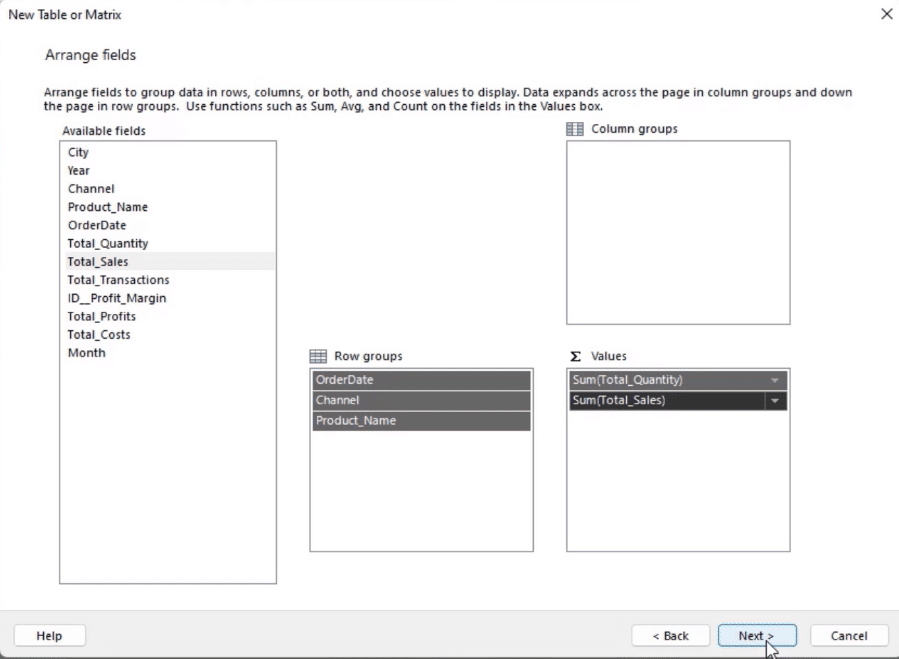
Arrange the fields and put them in the groups you want. The order in which you put the fields into the groups will dictate the hierarchy.
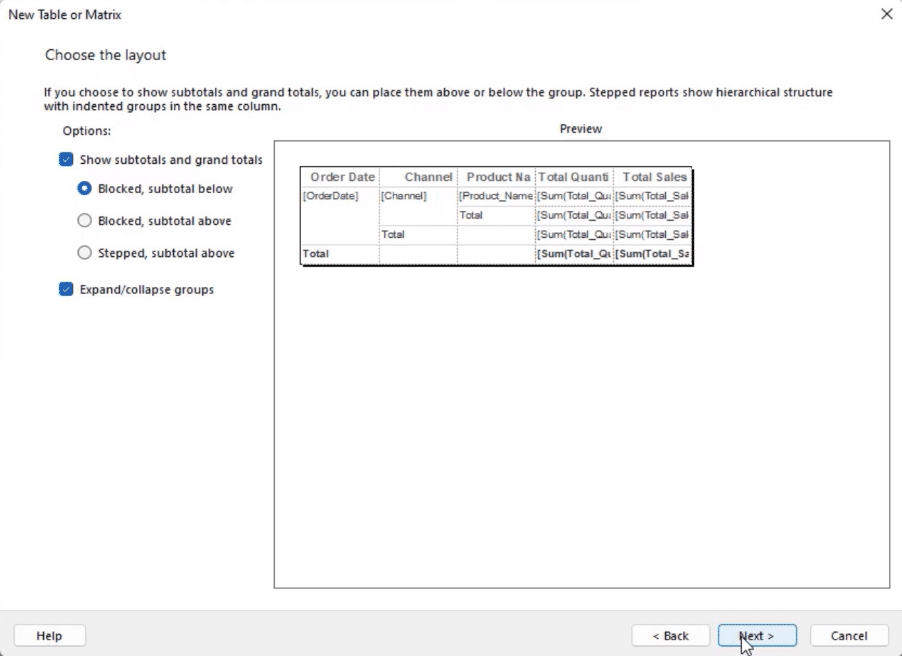
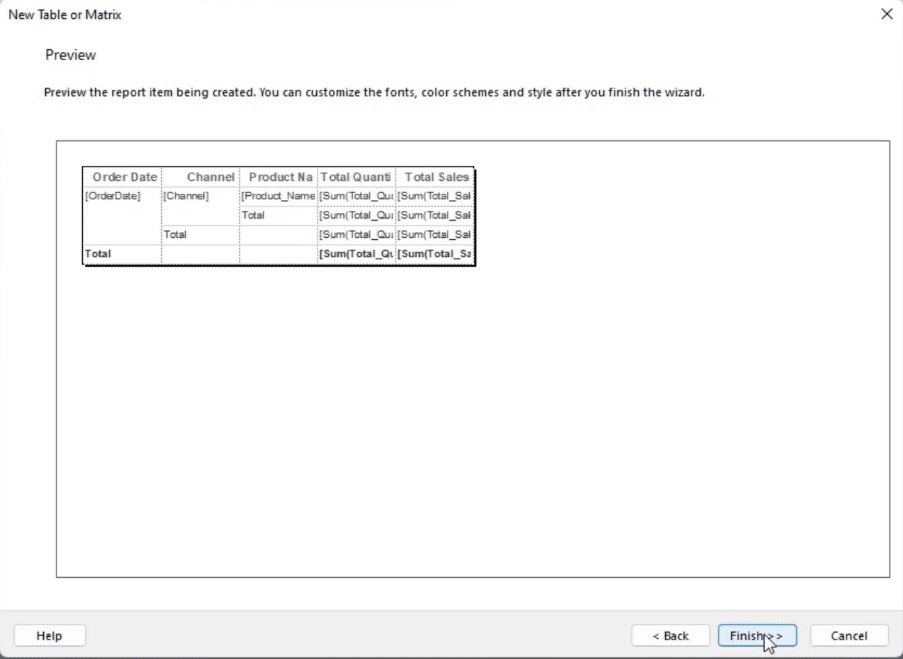
On the next page, you’ll be shown a preview of what the matrix will look like once it’s placed in the report. You can change its layout and format the subtotals and grand totals.
Once you’re satisfied with how the matrix looks, click Finish.
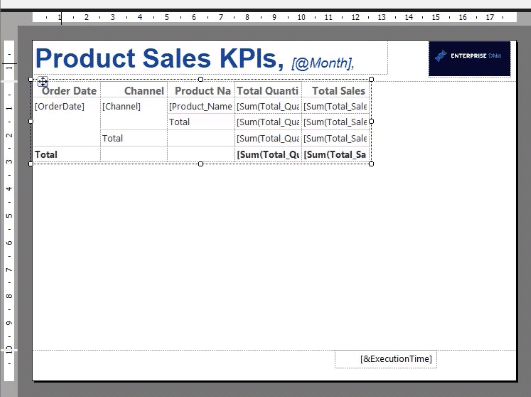
This is what it should look like in the design view of your paginated report.
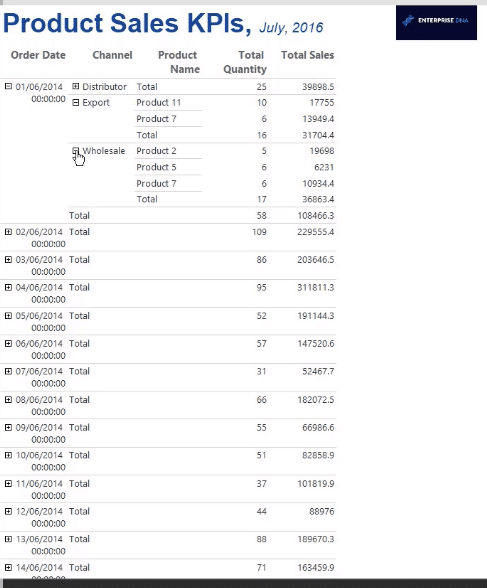
The matrix should appear like this when you click Run. You can click on the small plus/minus signs to expand or collapse your table entries.

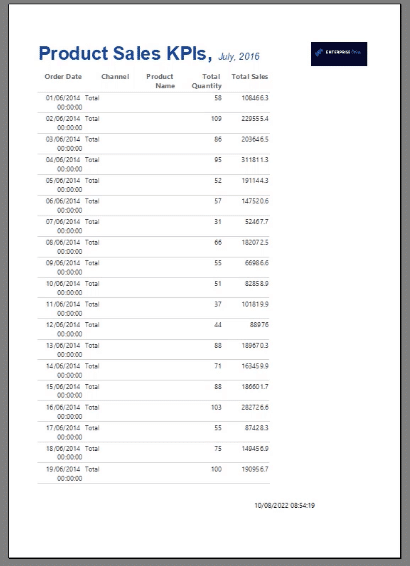
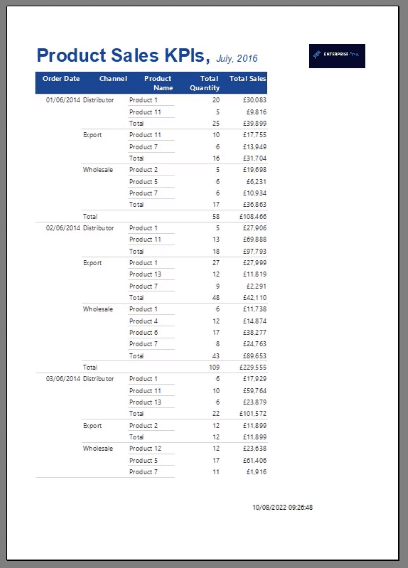
Clicking the Print Layout option will show what the report will look like once it’s exported as a text or PDF file.
Formatting The Matrix Data In Power BI Report Builder
Once you’re satisfied with the data shown in the matrix, the next thing you need to do is format it.
You can change the text format of each column using the Placeholder Properties option. You can access the Placeholder Properties wizard by right-clicking on the entry you want to edit and then selecting Placeholder Properties.
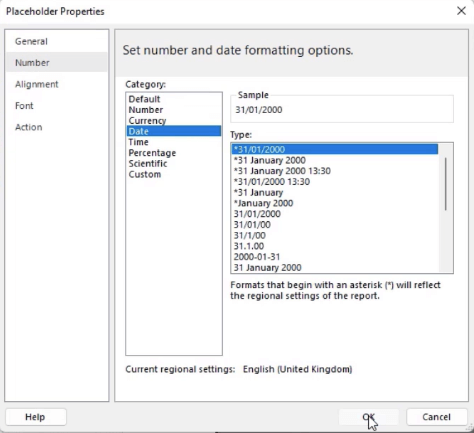
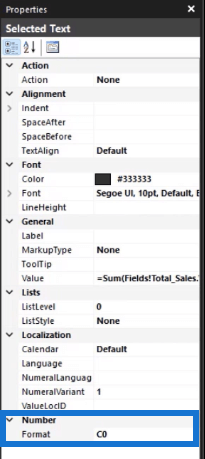
You can set the language using the Properties pane found at the right-hand side of Power BI Report Builder. You can also format numbers to a currency by writing C0 in the Number Format textbox.
Formatting changes can be further made to the background color, along with the font color, style, and size.
The expand and collapse options aren’t available in the print layout view. However, they can be accessed if you publish your paginated report to the Power BI Service.
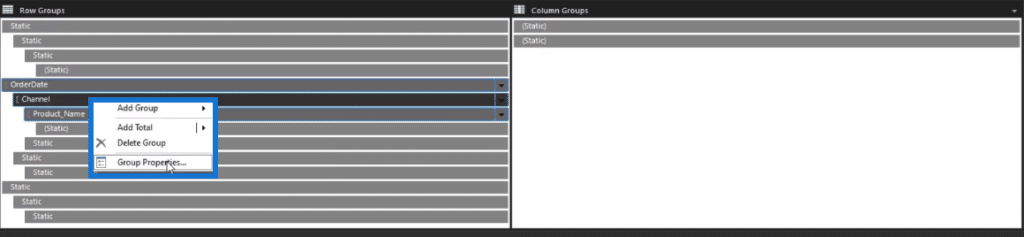
Another thing you can do is open the Advanced Mode of the Row and Column Groups and select which fields to show or hide.

Right-click on a field and select Group Properties.
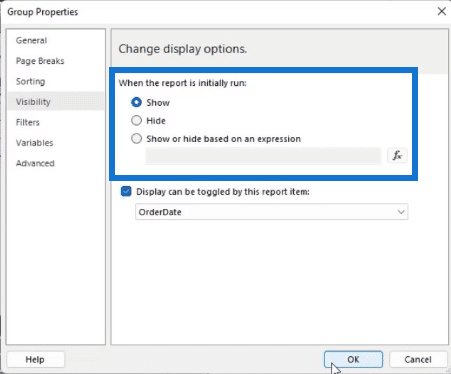
You can then choose which fields to show or hide when you run the report.
This is what the finished report looks like:
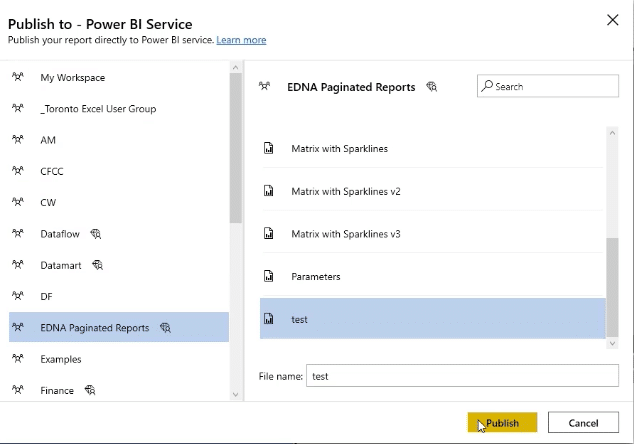
You can also opt to publish your report to the Power BI Service and decide whether users can use the expand or collapse options.
***** Related Links *****
Matrix Visualization In Power BI
Matrix In Power BI Using Calculation Groups
Report Builder In Power BI: Formatting Objects & Visualizations
Conclusion
A matrix is one of the most powerful tools in Report Builder. Creating it may be slightly challenging for beginners, but it becomes relatively easier once you get familair with the process flow.
Moreover, creating a matrix is not simply grouping data together. It’s also important to make sure that it’s user-friendly and presentable. So after you create your matrix data, continue to develop and make formatting changes that will improve the experience of the end user.
All the best,

Sue Bayes


