
Calculating an average in Power BI can be done in many ways to give you precise information for your business reports. You may watch the full video of this tutorial at the bottom of this blog.
However, sometimes calculating average sales per day may not be enough. You might run into a scenario where you only sell during weekdays.
If you run an averaging pattern in Power BI and you utilise the date table, it will run through every single day of the week, which is seven days.

In this case, your average will be lower than it should be because you will have days that will have zero results, which are days that you don’t sell.
In this example, I’m going to show you how you can solve this issue. We will have the scenario where you only sell during the working week, which means the weekend is not included.
Therefore, we will calculate the average sales only on weekdays.
We will then calculate the average sales per weekend and make a comparison of the weekday and weekend average sales. I will show you how to compute for the average sales difference as well.
But before we dive into the main topic, I’m going to show you how we work out the average sales per day, which I discussed on a previous tutorial.
Average Sales Per Day
Calculating the average sales per day is very simple. We just put it in via a measure, using the AVERAGEX function.

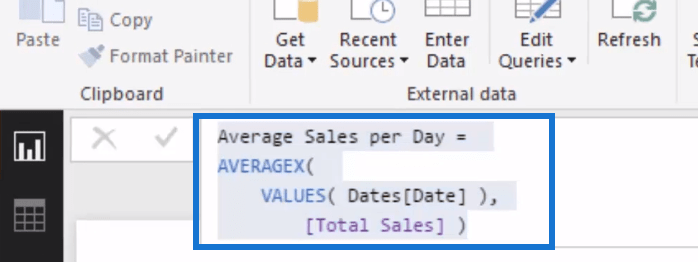
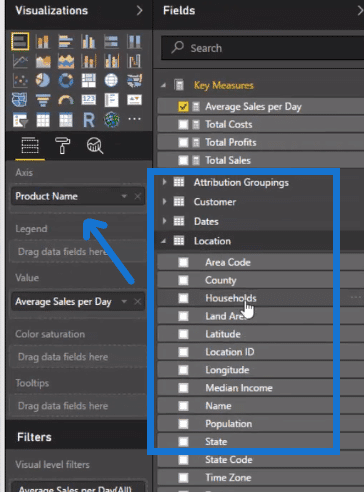
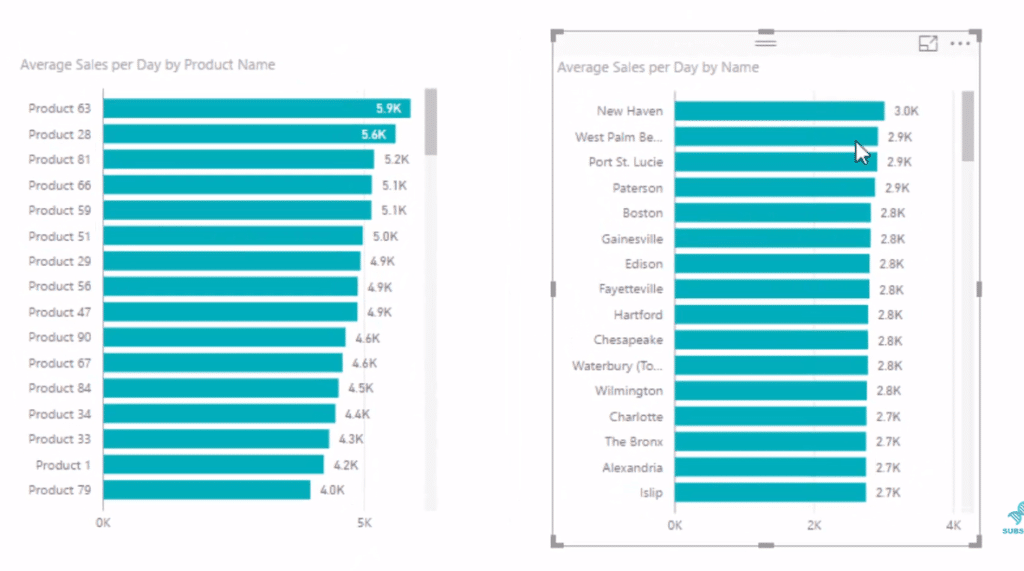
This formula can show us the average sales per day by products, location, customers, etc. Just choose from the options and drag it to the axis. Here’s how it looks like:
This is a very helpful calculation. However, if you are only selling during weekdays, then you need to have another formula to get specific results.
Average Sales Per Weekday
To compute for the weekday average sales, we need to create a date table that doesn’t have the weekends in it, iterating only over five days (Monday-Friday).
By utilizing the FILTER function, we can actually reduce the size of the date table virtually and then run this iterating logic through it via an AVERAGEX formula.
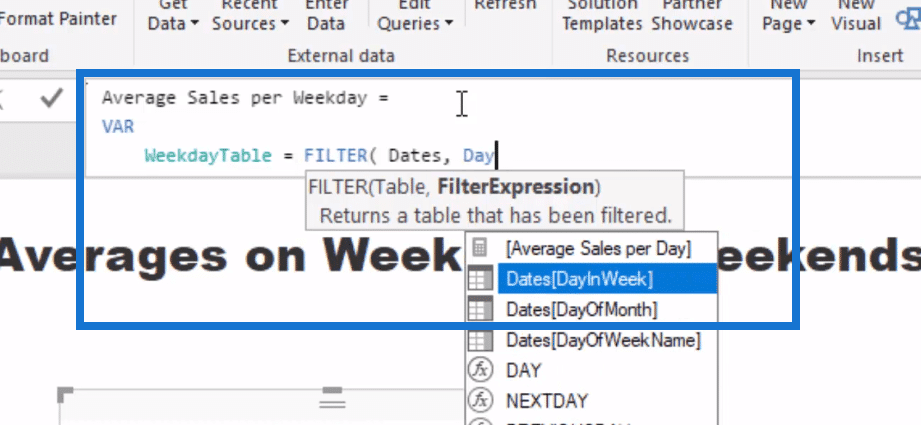
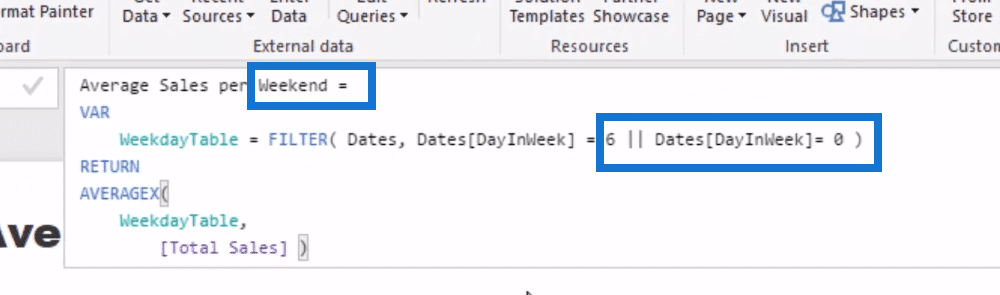
We create a new measure and call it Average Sales per Weekday. On the next line, we key in VAR for variable. In this formula, we use variables, as it simplifies everything.
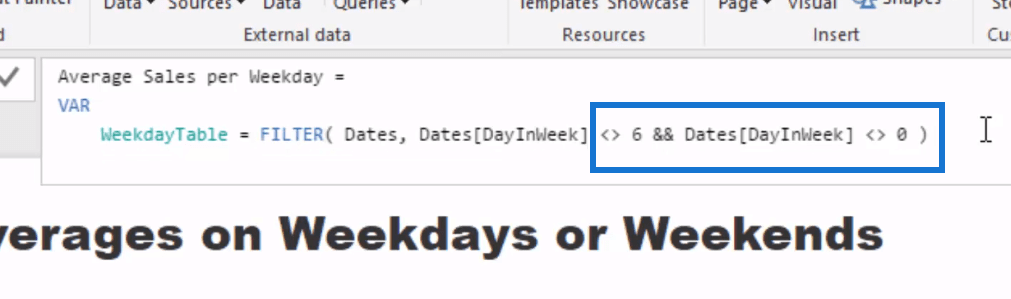
We will call this variable the WeekdayTable, and we put tables inside by using the FILTER function.
Then, key in DATES, which iterates through the entire week, and choose the column DAY IN WEEK that has each day of the week represented.
Then, type in <> to exclude Saturday and Sunday, where Saturday is represented by number 6 and Sunday by the number 0.
Therefore, the date table iterates through the dates, but does not include Saturday and Sunday.
Once we have this table inside the variable, we can then integrate it into our calculation.
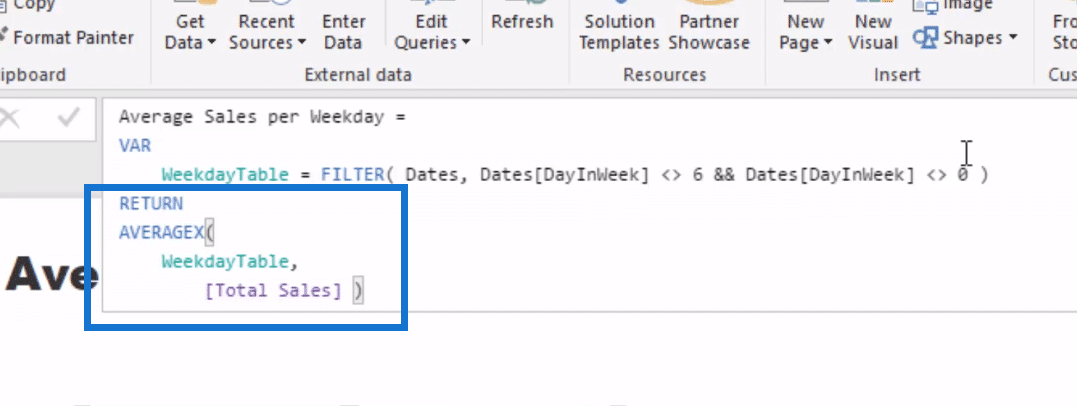
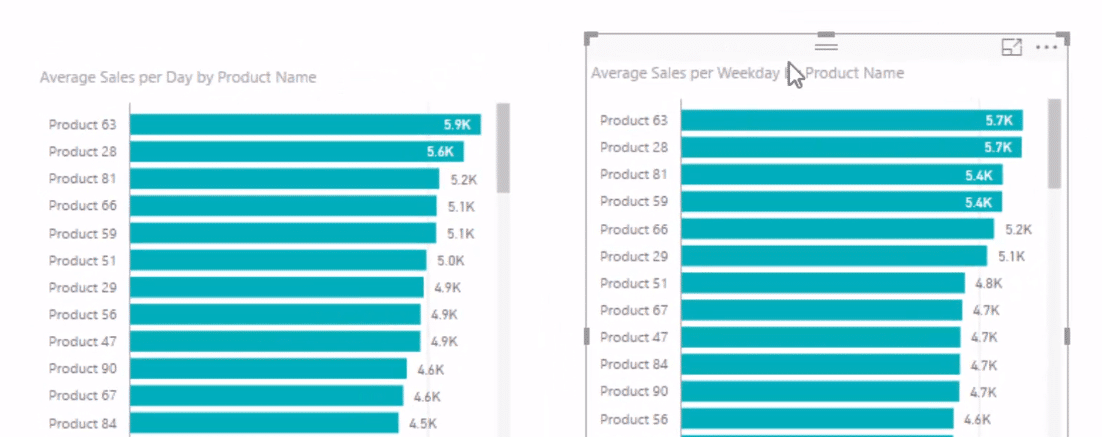
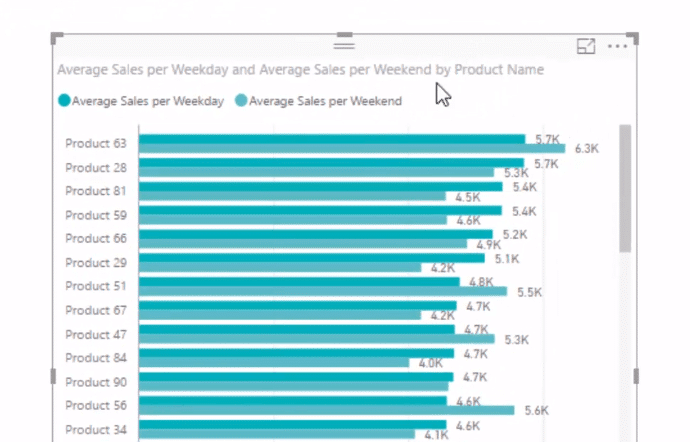
Using this formula, we can now create a visualization. Here we see both visualizations of per day and per weekday average sales.
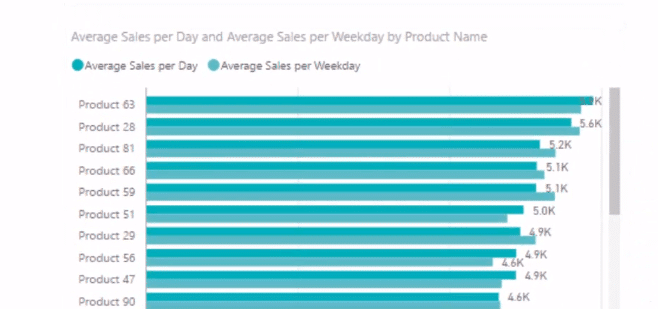
We can also layer the two visualizations on top of each other, putting them into one visualization, which shows the comparison of sales.
Now, let’s work on calculating the Average Sales per Weekend.

Average Sales Per Weekend
When computing for the average sales per weekend, we simply copy and paste the formula that we have just created for average sales per weekday into a new measure.
Then, change weekday to weekend, <> (does not equal) to = (equal), and instead of &&, you change it to || (or).
And, we can also compare the two visualizations (per weekday and per weekend) and see the difference.
But, if you want to be more specific with the difference in sales on weekdays and weekends, then we use another formula, which is the average sales difference.
Average Sales Difference
To get the average sales difference, we create a new measure. For this formula, we simply subtract Average Sales per Weekend from Average Sales per Weekday.
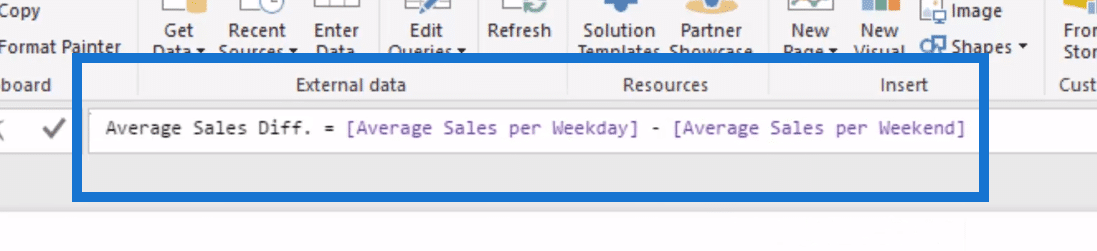
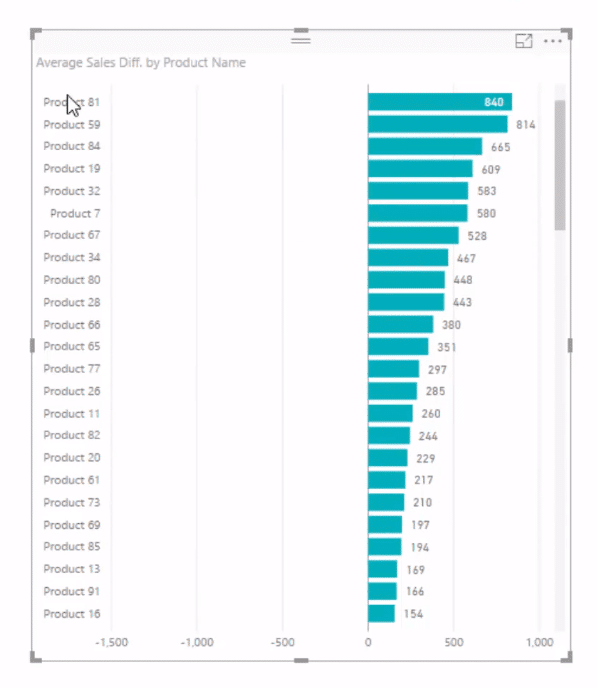
This formula can show us the difference in sales, say per product. We can determine which products sell better than the others on a weekday or weekend.
Here you can see that product 81 sells better than product 65.
***** Related Links *****
How To Calculate Averages per Day in Power BI w/DAX
Handling Weekday vs. Weekend Dates in Power BI Using DAX
Understanding How The AVERAGEX Function Works
Conclusion
In the blog, we worked on calculating the average sales per weekday and weekend. We started by reviewing the formula for calculating average sales per day. We also use visualizations to make comparisons.
You can learn a lot from this example. One of the most important concepts to understand in Power BI is how to use virtual tables inside of iterating functions.
Iterating formulas with virtual tables inside is a great concept to learn because there are many applications where this would be relevant in your own analysis that you’re doing.
Once you understand how iterating functions work, it opens up a world of analytical potential and your formulas become that much more simplified, as do your data models.
Thanks,
Sam


