
One of the best ways to implement conditional formatting is using the Field value option in the Visualizations pane. There are numerous reasons why this conditional formatting method is better than many, and one of them is that you can use the transparency masks on hex codes which we will discuss today. You may watch the full video of this tutorial at the bottom of this blog.
How to Make Conditional Formatting Transparent
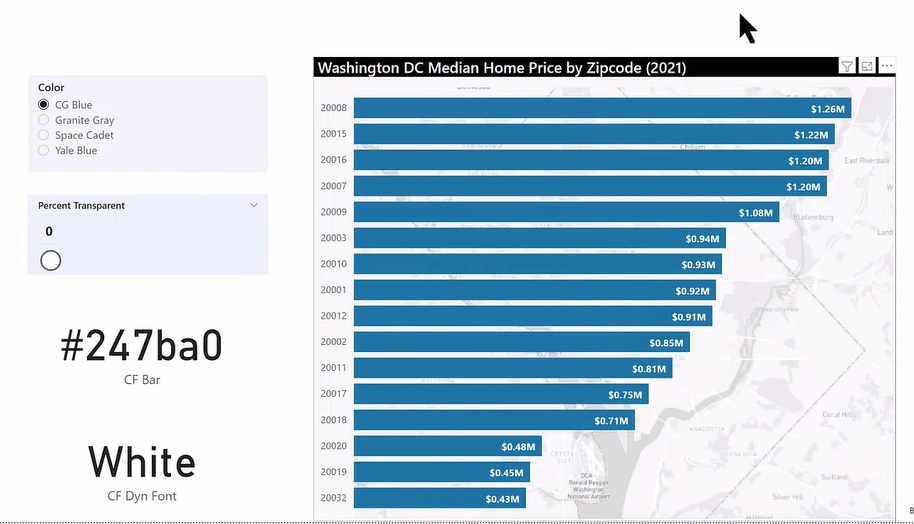
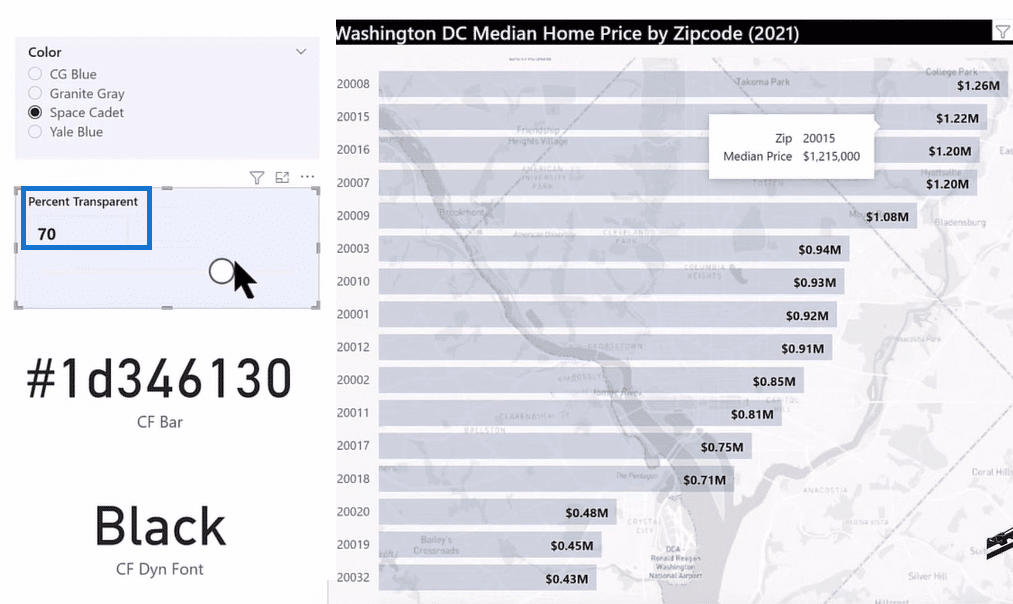
The image above is the data set on home prices that we’ll be working on today. We aim to make the bars on this Bar Chart transparent enough to see the map underneath.

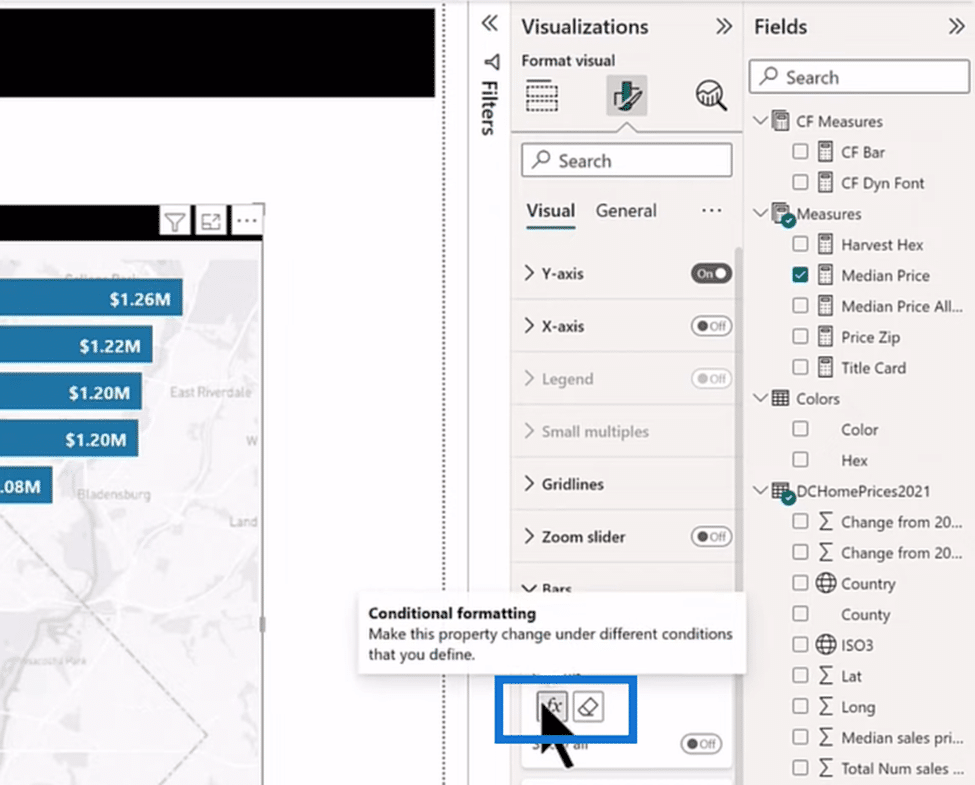
If we go to the Format page in the Visualizations pane, you will see that there’s no transparency option for the bars. However, we can make any element with a conditional formatting option here transparent using field value and conditional formatting.
If we bump this slider up a little bit, it’ll show the hex code with two optional characters on the end, as shown in the image below. What those characters show is the percent opacity for the hex code.
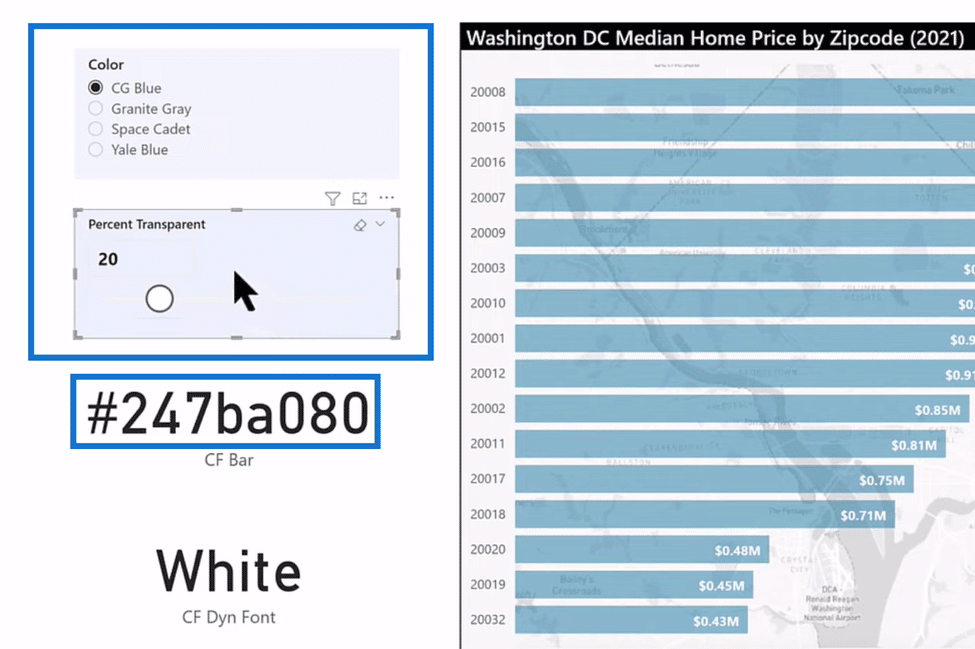
The first six characters of the hex code (247ba0) represent the Coast Guard blue color, while the last two (80) represent the opacity. You can calculate the opacity by subtracting the percent transparency (20) from the 100, thus giving us 80.
Numeric Parametic Slider
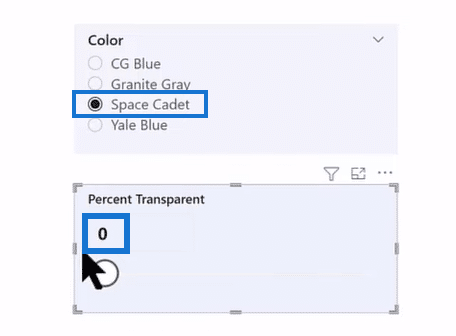
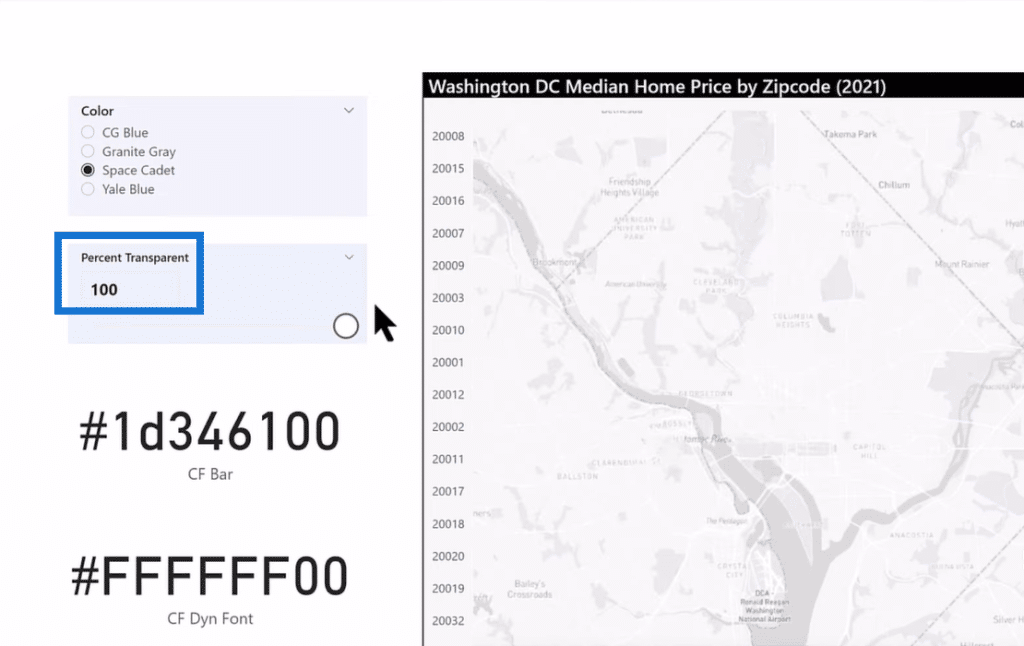
We first want to set the parameter using the numeric parameter slider and then adjust the color by harvesting the hex code from the table. Let’s use Space Cadet blue for our color and set the transparency to zero.
Now, this action doesn’t let you see the map behind it. If we look at this CF Bar measure in DAX, we’ve harvested the hex code and the Percent Transparent Value, as highlighted in the image below.
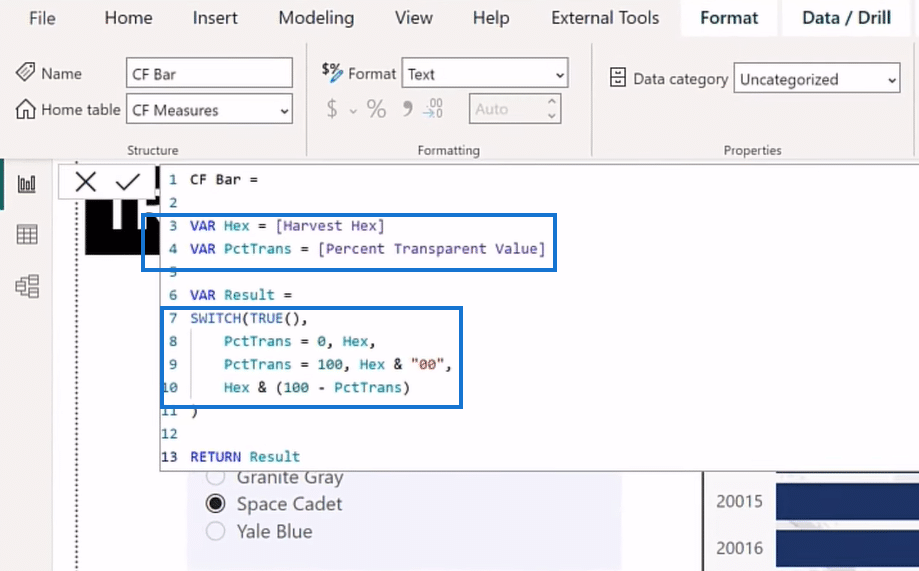
We then used a simple SWITCH (TRUE) construct that says if the Percent Transparency is 0, we return the six-character hex code or PctTrans = 0, Hex. The 0 gives us a full opacity hex code.
Furthermore, we added that if the Percent Transparency is 100, we return the hex code with 00 opacity or PctTrans = 100, Hex & “00”. The 00 gives us a fully transparent hex code. The image below is what a fully transparent hex code looks like, and it makes all the visual vanish.

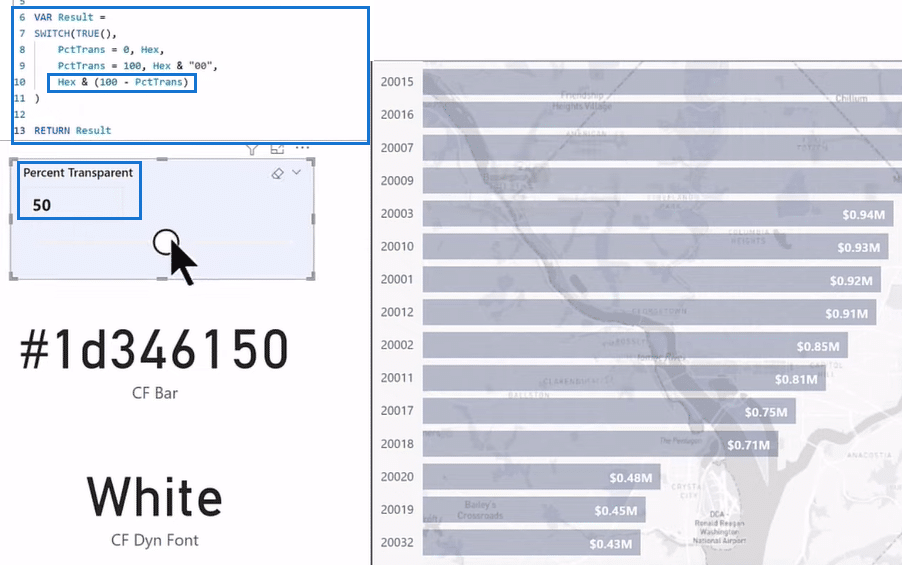
If we switch the True statement to everything in the middle and take the hex code to 100 minus the Percent Transparency or Hex & (100 – PctTrans – 100), we can make data labels more readable depending on selection. At 50 transparency or less, we are at the darker colors, as you can see in the image below
Using the Dynamic Font Measure for Conditional Formatting
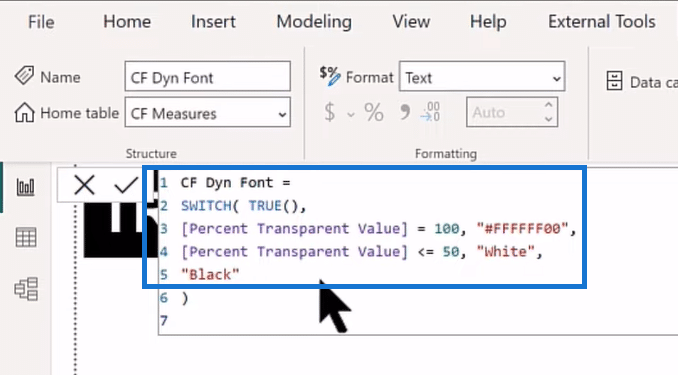
We are currently at the darker colors and want to use white for the data labels, so we’ll use the Dynamic font measure in the Field section.
It states that if the Percent Transparency is less than 50, we will use white. If it’s at a hundred, then we make it invisible; if it’s greater than 50, we use black.
You can see below that if we change our Percent Transparency and lighten up the bar color, it turns the data labels dark.
***** Related Links *****
Expression Builder: Applying Conditional Formatting On Paginated Reports
How To Control The Interactions Of Your Visuals In Power BI
Custom Conditional Formatting Techniques In Power BI
Conclusion
Now you can set your transparency and color exactly how you want and use it in your Power BI visuals. Furthermore, you can allow the user to change hex codes for accessibility reasons and the like.
There are numerous other ways you can use conditional formatting in combination with DAX, transparency mask, and opacity numbers. The interesting thing about this method is that with either the gradient or the rule-based conditional formatting, you can only access it through the field value.


