I want to do a deep dive into something called combinatorial analysis. This can be defined as the choosing and arranging of elements of sets in accordance with prescribed rules. It might sound esoteric, but it’s actually got some very practical use cases. You may watch the full video of this tutorial at the bottom of this blog.
In this tutorial, I’ll show you how to do this using the Power Query in Power BI.
Combinatorial Analysis Example Case
In this example combinatorial analysis, the task was that we had a list of six warehouses and we needed to generate every unique set of three. It sounds like a pretty straightforward problem, but this is one of those cases where language really matters.
The correct answer here is either 216, 120, 56, or 20. So, depending on how you define that unique set and the rules you prescribed, you could be off by a factor of 10 if you don’t get the set correctly.
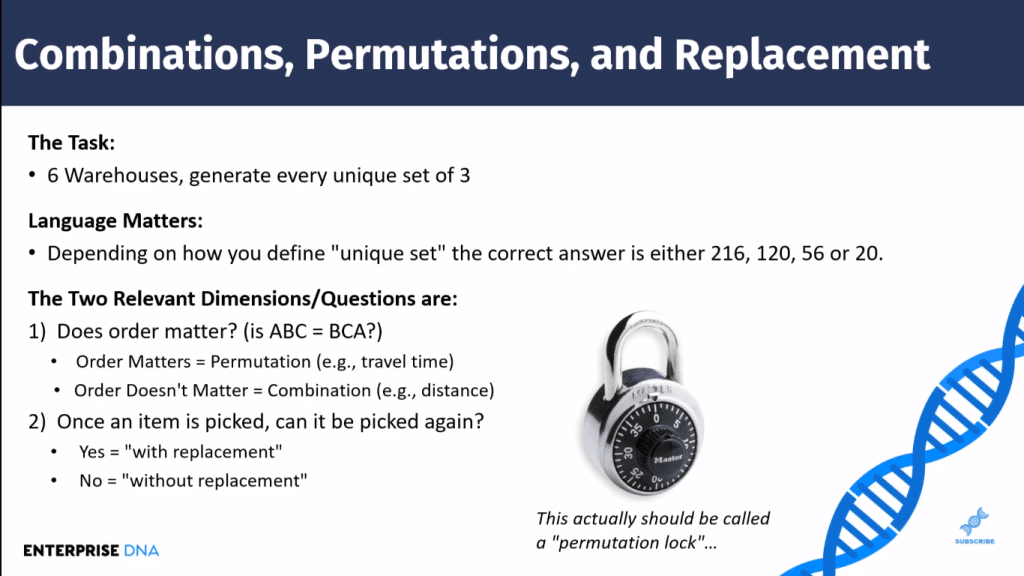
And so, there are two dimensions that matter here. The first one is “does order matter?” So when we’re talking about three sets of three, is ABC equivalent to BCA? So does order matter? And if order matters, we’re talking about permutations.
A good example of permutations where order could matter is (we’re talking about a warehouse context) in the case of travel time. It very well might be that if you visit warehouse A, then warehouse B, and then warehouse C, the travel time due to traffic flow with traffic against traffic, the time that you arrived at each warehouse, could be quite different depending on the order in which you visit them.
The flip side of that is “order doesn’t matter”, in which case we’re talking about combinations, not permutations. The use case here that is common is distance. For example, as the crow flies, the distance from A to B to C is not going to be any different than the distance from B to C to A. Those are going to be considered in a combination context.
Combinations are considered duplicates of each other. Whereas, in a permutation context, they’ll be considered unique.
And so, as you can see, a combination lock really should be a permutation lock because in that case, order does matter, making it a permutation, not a combination.
The second question or dimension that matters is “once an item is picked, can it be picked again?” For example, if we choose A as our first warehouse, can we choose A again, or do we have to choose unique elements each time?
The term we use here is “with replacement” or “without replacement”. So, if an item can be picked again, that’s with replacement, meaning you pick it. And in a sense, it goes back into the selection bin and to be picked again. If the answer is no, it’s without replacement.
And so, you can see in this solution that permutations with replacement are the least restrictive. So that’s the one that gives us 216 unique sets. And combinations without replacement is the most restrictive giving us 20.
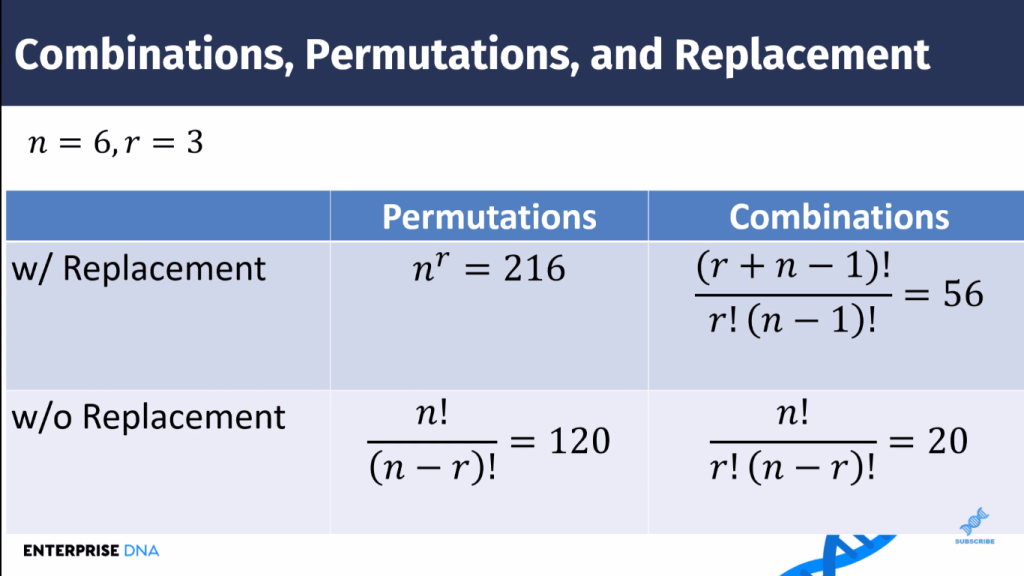
We’re just going to use these formulas as a way to check our Power Query results. So we’ll remember 216, 120, 56, and 20. Now let’s jump into Power Query and see how this combinatorial analysis all plays out.
Combinatorial Analysis: Permutations In Power Query
In the Power Query, I have here a very simple case with six named warehouses.

And I’ve developed this Power Query M function, which I’ve used to process combinations and permutations.
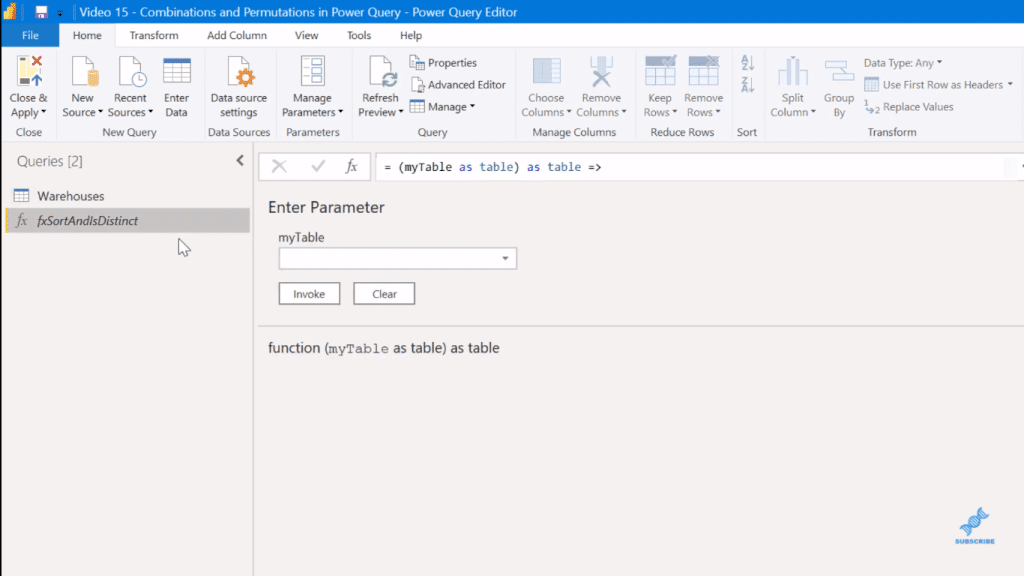
First, I’m going to develop that first use case, which is permutations with replacement, the least restrictive of the bunch. The way to do that in the Power Query is to take this Warehouses table and reference it (in DAX, we use CROSSJOIN).

I’ll call this, Per w Rep (permutations with replacement).

There’s a number of ways you can do a cross-join in Power Query. The easiest way that I’ve found is to just go Add column, then Custom column. In the custom column formula, reference the Warehouses table.
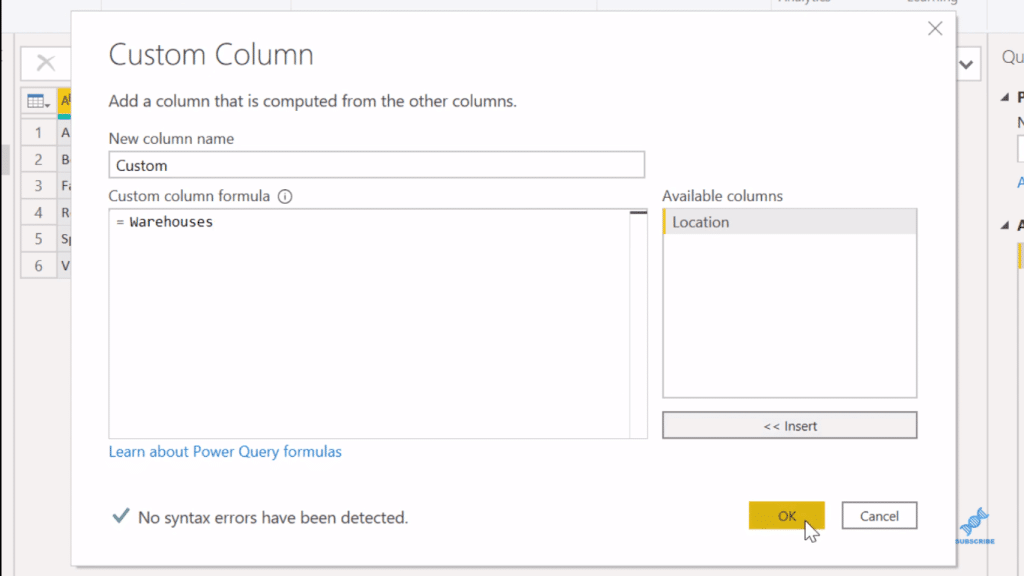
And what we’ll find when we click OK is that it generates a nested table.

Then, we expand that and unclick the Use original columns name as a prefix.

And we get this Location.1, which is every possible combination of two. So it takes the first six references against the other six combinations. The second six does the same all the way down until we have 36 different sets.

We can do the third one by doing this again. So we go Add column, then a custom column, and then Warehouses.
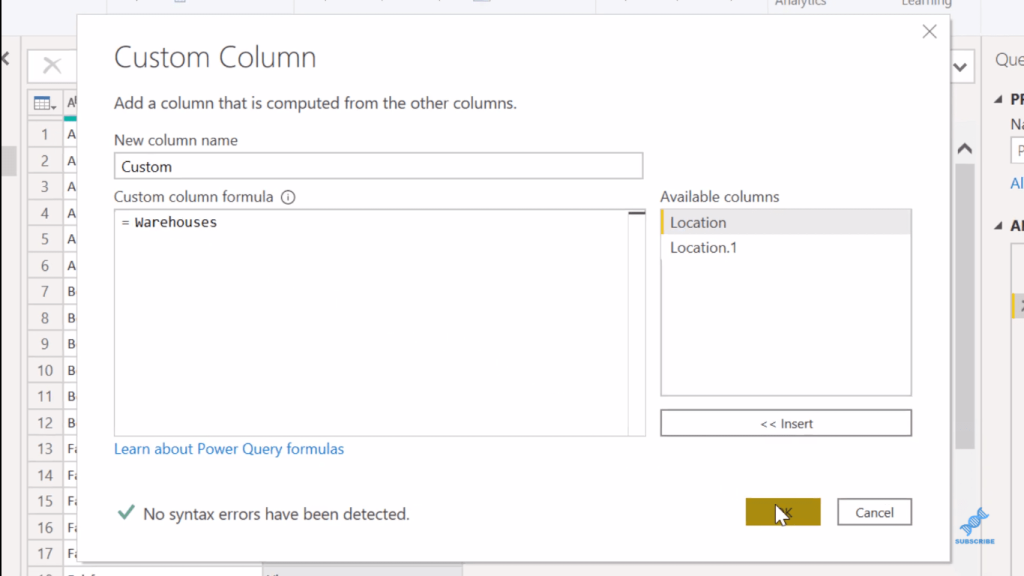
And we’ll have the 216 rows as the permutations with replacement.

And you can see from down here, 3 columns, 216 rows.

The next use case is permutations without replacement. What we’re thinking of here is basically everything that has a repeated element. So in this table, we’re going to look at from row 1 to row 8.

To do that, we’ll take a look at this function, fxSortAndIsDistinct.
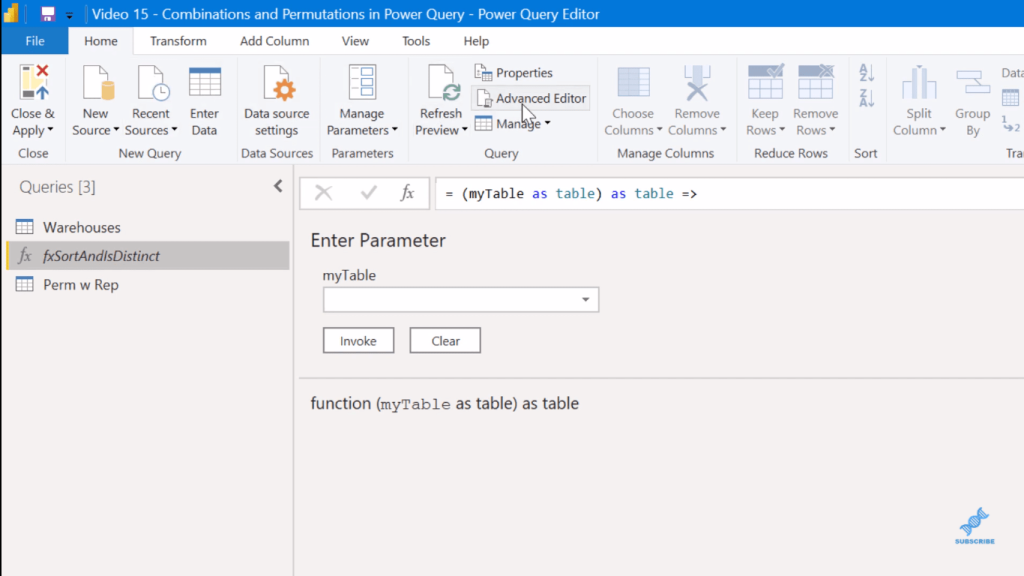
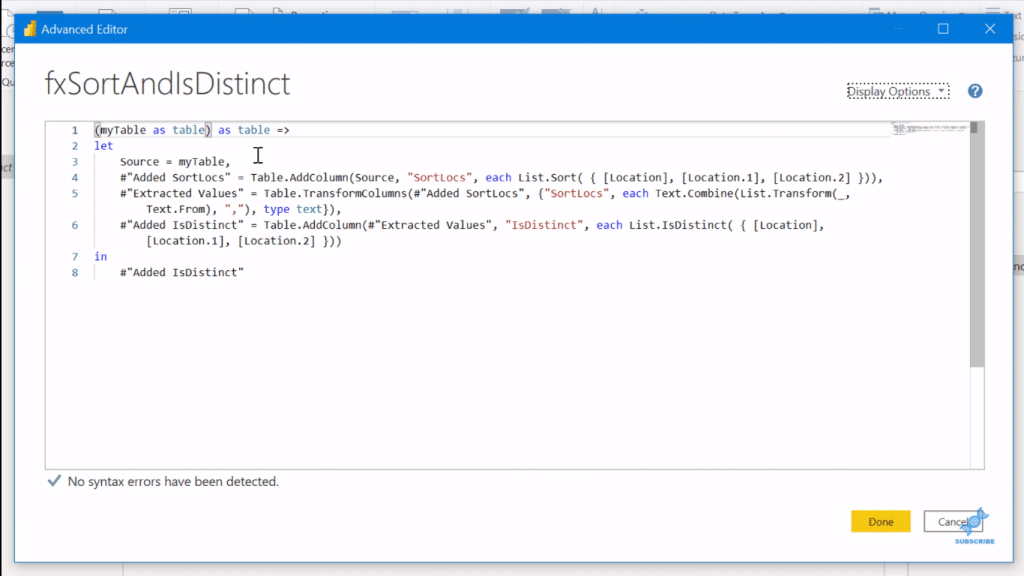
In the Advanced Editor, you can see this basically asks for a table, and then it does a SortLocs. But the important part here for the “with replacement” or “without replacement” is this is an IsDistinct function. What this does is just basically take a list of elements and determine true or false, whether it’s distinct or whether it has any duplicates in the list of items.
So we go here, select the Perm w Rep, and hit Invoke.

This will give us these two new columns, SortLocs and IsDistinct. Now, remember that the first eight records had duplicates and the ninth record was the first time we saw the distinct. That is why the ninth row here is the first one that shows up as true.

If we think back to the numbers that we had on the factorial calculations, we’re expecting 120 records if we take out the non-distinct records. So, let’s try to filter here and take out the FALSE.

As we do that, we get is down here exactly the 120 rows that we’re expecting. Now let’s rename this as Perm wo Rep (permutation without replacement).

Combinatorial Analysis: Combinations In Power Query
Now we’ll do the combinations with replacement. To do that, we simply do the process again and repeat the step (Invoked Function). So it’s okay that we have duplicates, but we don’t want sets that have the same elements, but in a different order.
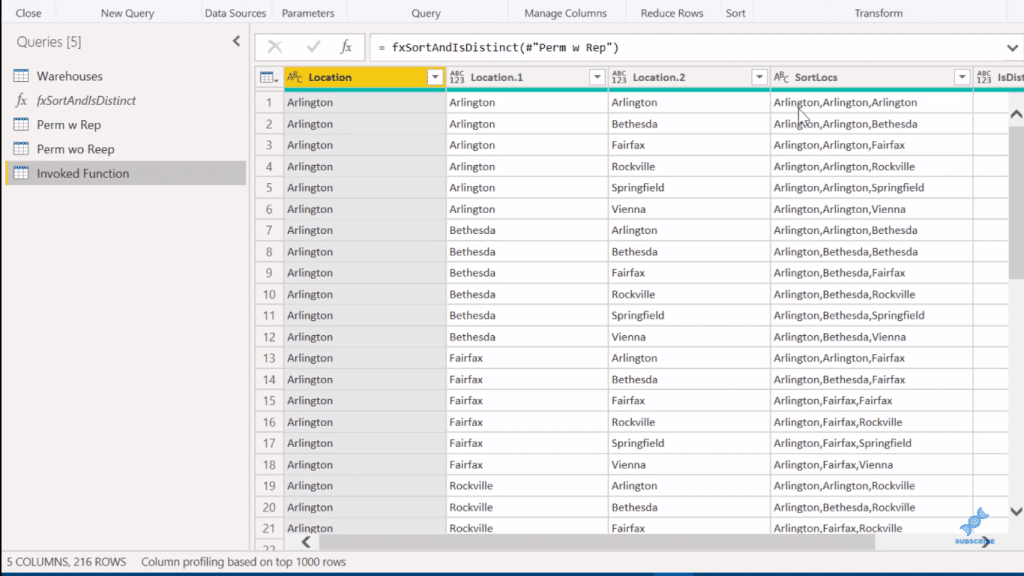
In this case, when we’re talking about combinations. If you remember that ABC is equal to BCA is equal to CAB, those are all considered duplicates of each other. And the way we determine that is through the Sort function (fxSortAndIsDistinct).
If we go back into the function in the Advanced Editor, we’ll see for that second column that we’ve taken that list and sorted it alphabetically. Then, we extracted the values delimited by comma from that list. Now we have each set sorted alphabetically. We’ve normalized the order to make it easy to find duplicates.

Now if we go back into this Invoked Function, remember that we’re looking for 56 records here. So we take this sort of location (SortLocs) and remove our duplicates.
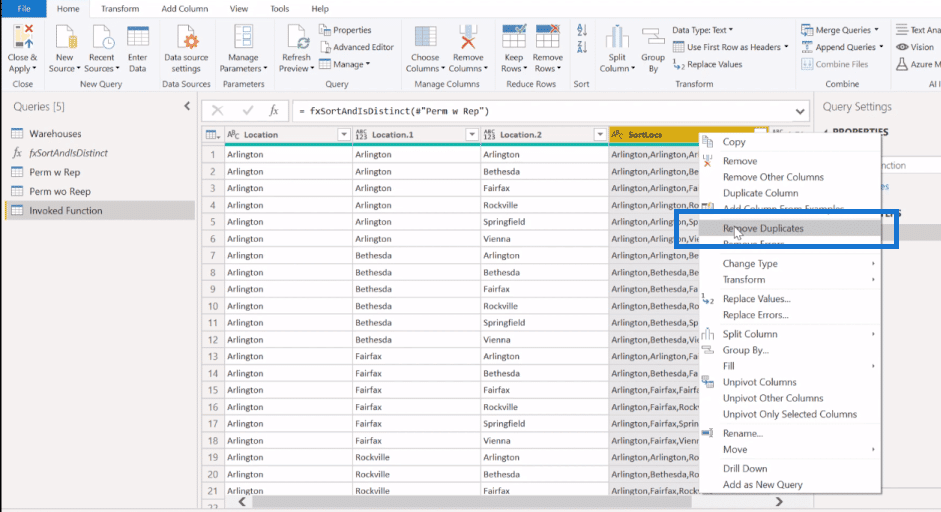
With that, we get 56 rows.

And so, this is our third use case. Let’s rename this as CC w Rep (combinations with replacement).
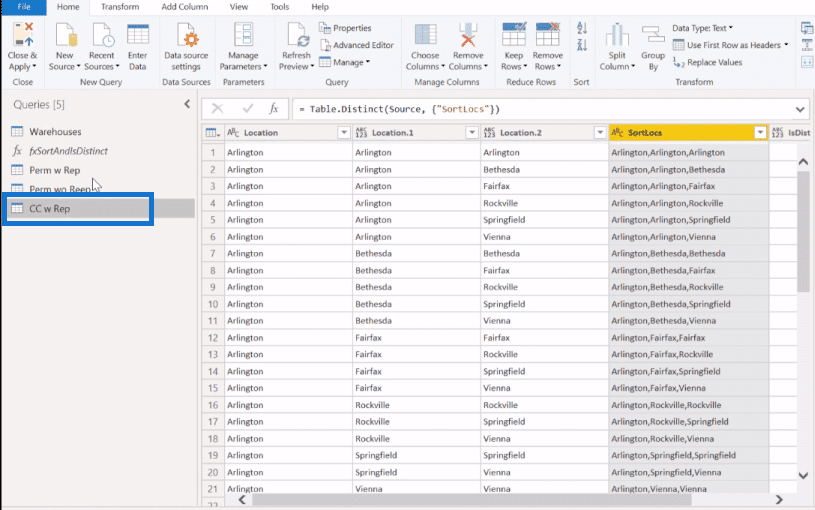
Let’s wrap this one up by taking again that permutations with replacement (Perm w Rep) table and do the same pattern (invoke). Then, we’re going to remove the duplicates (SortLocs column) because this is a combination and order doesn’t matter. It’s without replacement, so we also want only the distinct list. So, we click off FALSE in the IsDistinct column.
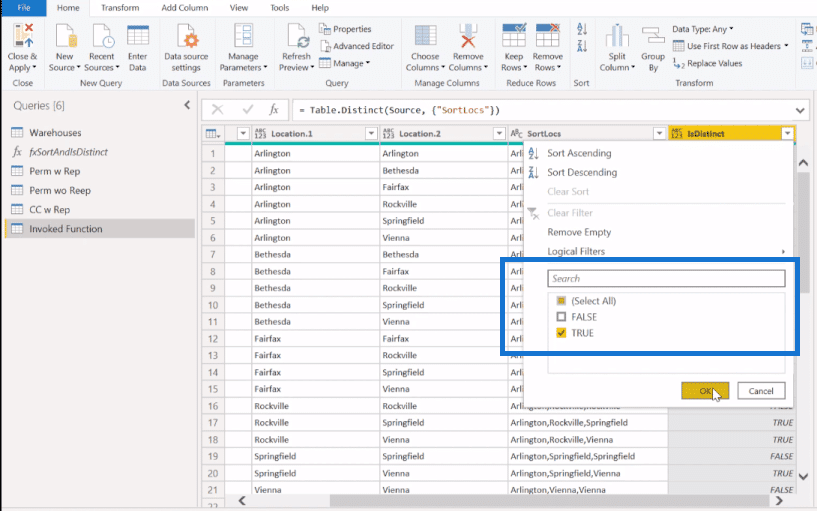
With this, we get 20 records. And now we have all four of our use cases.

***** Related Links *****
Sorting Date Table Columns In Power BI
Beginners’ Guide To The M Code In Power BI
Convert The Date Table Function Into A Table Query In Power BI
Conclusion
So now we have all four of our use cases. You can see really how powerful this is in terms of developing that combinatorial analysis that gives you control over replacement and distinct elements.
This is even applicable in some more complex cases where you have a partial replacement, or maybe select a duplicate element for the first one, but not the second time. You can still handle that nicely within Power Query.
I hope you found this useful. Check out the links below for more content. You can also watch the full video of this tutorial below.
All the best!
Brian


