In this tutorial, you’ll learn about fixing card visual results in Power BI. Cards are native visuals in Power BI that work well in telling the story of your report. They are versatile visuals that can be used in various ways in your reports. You may watch the full video of this tutorial at the bottom of this blog.
In Power BI, you can create simple and intricate cards with KPI type features. You can also put transparent buttons and incorporate them into the navigation experience. But as simple as they are, their results can be incorrect. This tutorial will help you correct those errors.
Along the way, you’ll also learn some of the best practices for virtual tables.
Card Visual Errors In Power BI Example
This is a simple example of a sales report dashboard:

If you look at the model, you’ll see that it’s a basic star schema Sales model.
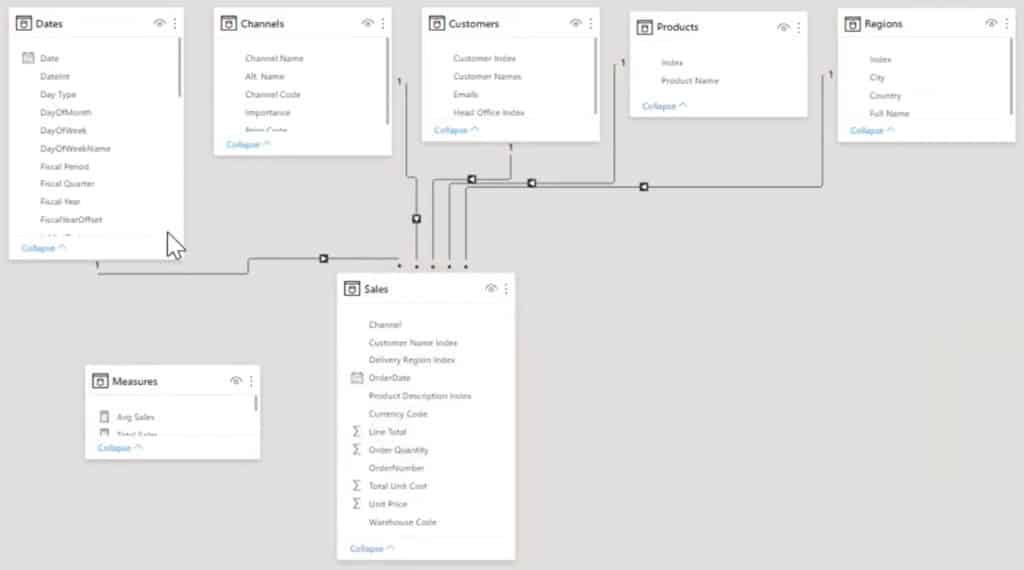
For this example, focus only on the Sales Fact table and the Date table.
This is the Total Sales measure which is the sum of the Line Sales.

If you drag this measure into the table and card, you’ll get your expected results.

In this example, the company had a problem in February 2020 leading to a product recall. This zeroed out all the Sales for that month.
To show this in your report, create a measure that sets the Sales to 0 IF the date is February 2020. Otherwise, it will compute the regular Total Sales value.
Name the measure Total Sales with Recall.

Card Visuals In Power BI Showing Incorrect Amounts
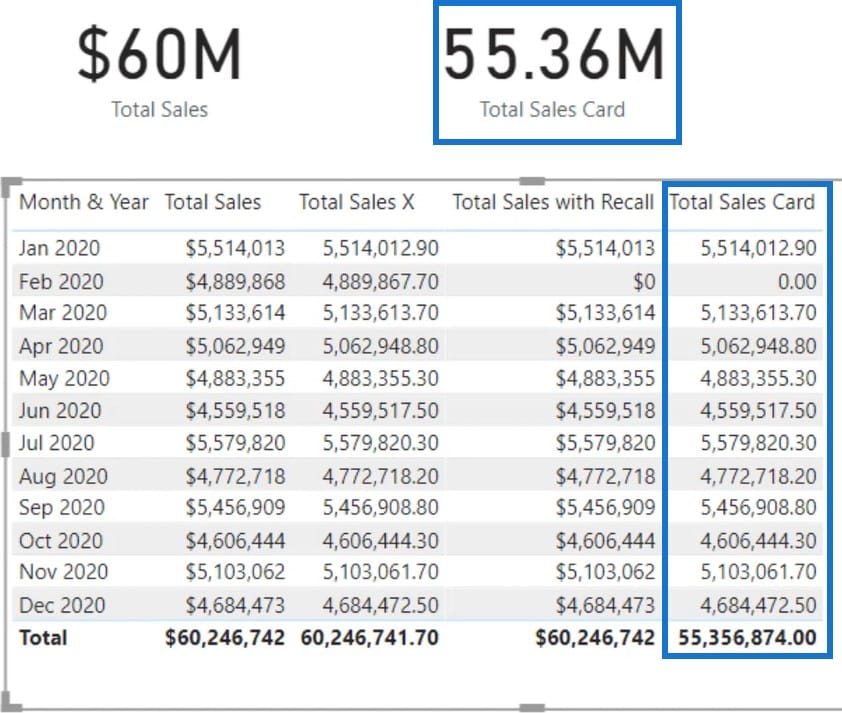
If you put this measure into a card, you’ll notice it shows a wrong result of $60 million. The amount should be less the February 2020 value.

Now, if you drag the Total Sales with Recall measure into the table, you can see that February 2020 yields a 0 value. However, the Total still yields the same result.
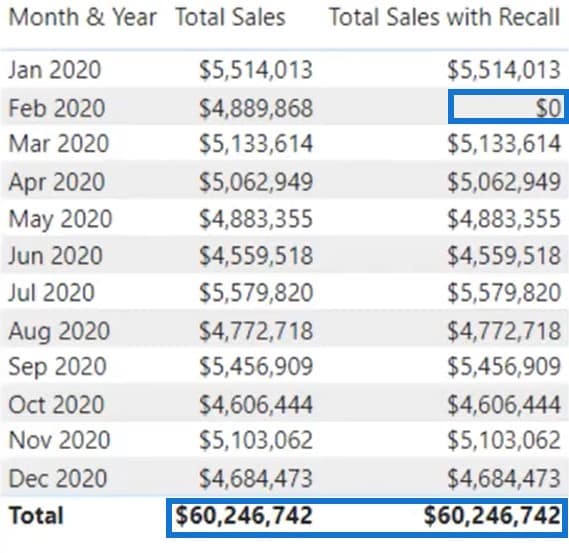
This means that the Total in the table and card didn’t calculate all the values above it.
The reason for that lies in the Total Sales with Recall measure. The Total is computing based on the evaluation context it finds.
If you look at the measure again, it says that if the context date is February 2020, it gets a 0. Otherwise, it gets the Total Sales.

Since it didn’t find February 2020, it gets the Total Sales for that evaluation context which is $60 million. To fix that, you need to make the measure calculate the values in the column including the 0.
Card visuals have no evaluation context; they can’t identify the value each month should have. So, you have to build that into your analysis and measure through a virtual table.
If you look at the Total Sales measure, you can’t build a virtual table because the SUM function only calls a physical column from a table. So, you need to use the SUMX function.
This is a Total Sales measure that uses SUMX.
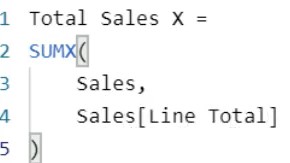
You can see that SUMX calls the Sales table first and then the column in that table.
If you drag that measure into the table, it will produce the same results as the Total Sales. To fix this, you need to create a virtual table.

How To Fix Card Visual Results In Power BI
One of the best practices in building a virtual table is to work in the DAX Studio or Tabular Editor. It will help you visualize what’s happening in the virtual tables while creating your measure.
When you start building complex virtual tables, visualizing what’s happening inside the table is critical.
Create A Virtual Table Measure
Go to External Tools and click Tabular Editor.

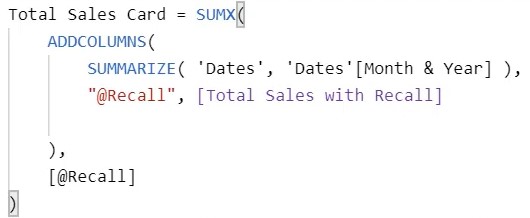
Next, create a new measure. In this case, call it Total Sales card.

Create a virtual table that shows the Month and Year, and has the results of the Total Sales with Recall measure.
Start the measure using SUMX. It calculates the total row by row. If a row doesn’t have a context in terms of month and year, it will calculate the sum of everything above it.
When creating a virtual table that adds a new column to an existing table, the best practice is to start with ADDCOLUMNS. Then, use SUMMARIZE. This function allows you to handle both simple and complex cases.
Inside the SUMMARIZE function, input Dates [Month&Year].
Next, add a column for the Total Sales with Recall measure and then name it. Naming prevents ambiguity between virtual columns, physical columns, and measures.
The best practice for naming a virtual column is to start with an “@”. So, name it @Recall and identify it as the Total Sales with Recall measure.
After specifying what table to use in SUMX, you need to put what expression it has to sum and then input @Recall.

Test If The Measure Works
Before testing the measure, you have to make sure that the virtual table is working. Copy the virtual table portion and create a DAX query.
Start with the function EVALUATE and paste the copied code. Then, press F5.

You can see that the virtual table is taking the Month & Year column and calculating the Total Sales with recall correctly by zeroing out February.

Now, go back to the Expression Editor and save it to the model.
Apply The Solution To Power BI
When you go back to Power BI, you’ll now have the Total Sales Card which has the virtual table measure.
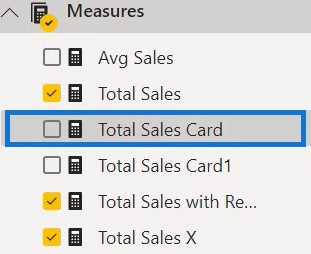
If you take the measure and drop it into the table and card visual, you’ll now see the correct value of the Total Sales. You have now fixed your card visual results in Power BI.
***** Related Links *****
Data Visualization Technique | Power BI Dynamic Visuals
How To Showcase Top Result In A Power BI Card Visualization
Master Virtual Tables In Power BI Using DAX
Conclusion
This tutorial showed you how to fix incorrect card visual results in Power BI. If you’re getting erroneous results on your cards, you can use this tutorial to easily fix them. You also learned the importance of virtual tables in solving the problem.
By implementing the best practices and DAX functions, you can now produce reports and visuals that always show correct results.


