Measure Branching is a technique in making calculations in Power BI. It’s not something you’ll hear often because it is unique to Enterprise DNA.
It’s a methodology that I made to create measures out of measures. You may watch the full video of this tutorial at the bottom of this blog.
Calculating The Total Costs Using The RELATED Function
I’m going to use the example of creating a calculation on profits. To compute our profits we need to subtract our sales from our costs. Now, if you look at our table of raw data in the Sales table, we can’t do it because the data is not in our fact table.
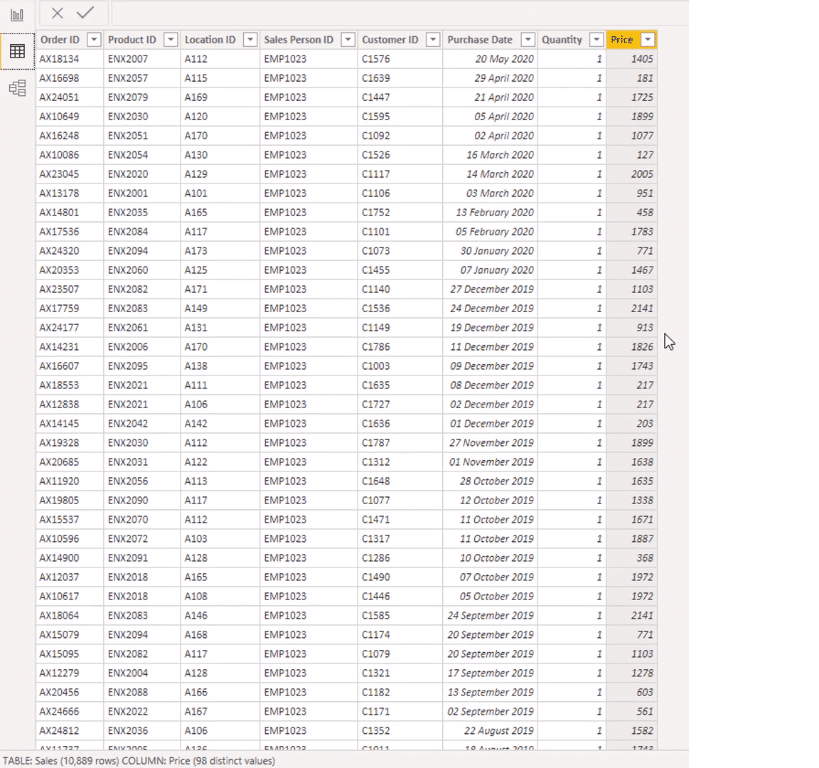
But what we can do is utilize information which is in another table to compute for our costs.
In the Products table, we have the cost information.
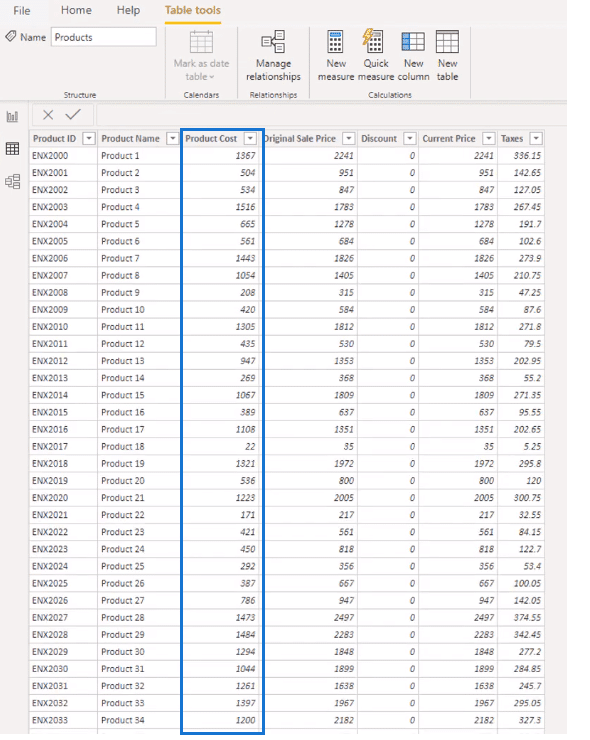
Using this data, we can calculate what our cost is in the Sales table and subtract costs from revenues to get our profit.
The great thing is that we can do this all within measures.
First, I’m going to create a new measure called Total Costs. And I’m going to use SUMX because we need its iterating function to do this. Next, I’m going to reference Sales and Quantity and multiply it by the cost.

Now, the cost column doesn’t exist in our Sales table. So, we’re going to use a function called RELATED.

This function returns a related value from another table. This is an interesting function which is not used often but this is a perfect example of where you would use it because we need to retrieve a value from another table.
Next, I’m going to input the Product Cost column from the Products table. Then close off the brackets and enter the formula.

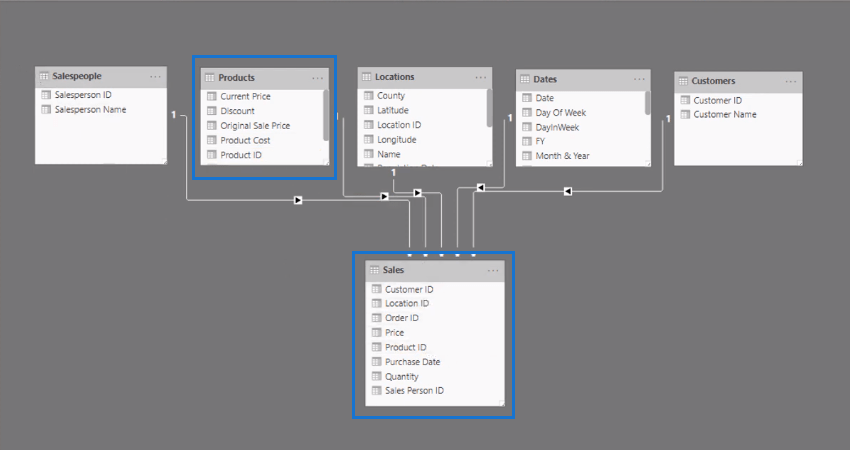
In this formula, the RELATED function grabs the associated cost for each individual product at every single row from the Products table. This is possible because of the relationship between each table.
You’ll see now that we have the Total Costs per customer.
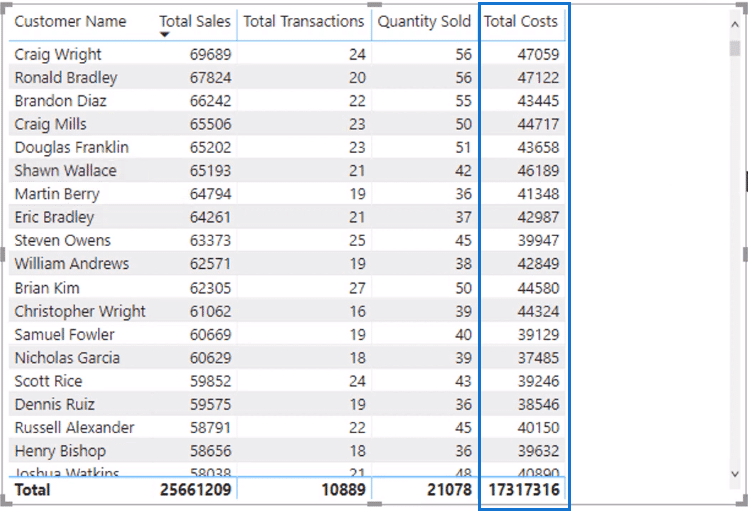
Once we’re done, let’s remove the intermediary calculations since they are unnecessary.
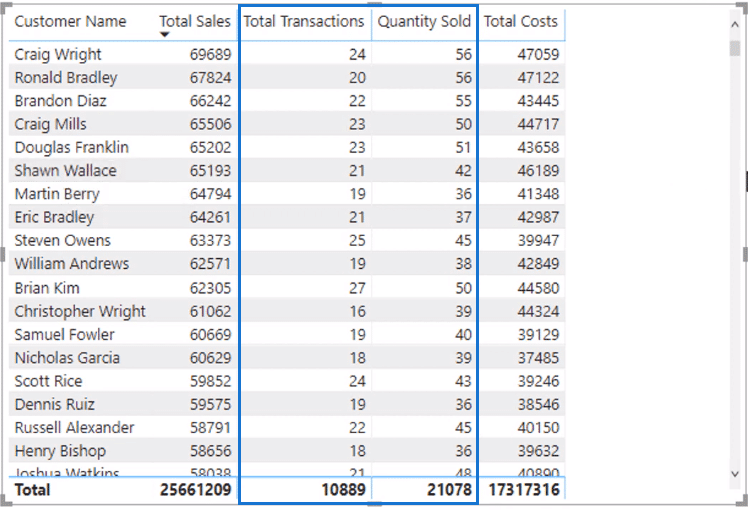
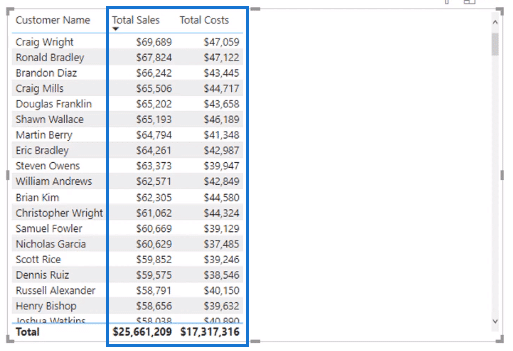
We can also format the data here. To do that, click on the Measure Tools Tab. For example, I can format the currency into a dollar sign to help with the data interpretation.

Calculating The Total Profits Through Measure Branching
We now have two measures: the Sales measure and Costs measure. These are the measures we need for calculating our Total Profits.
Next, I’m going to create another measure called Total Profits. The formula for this is the difference between Total Sales and Total Costs.

When typing in the measure, the IntelliSense identifies the measure immediately and we can select it from the drop-down.
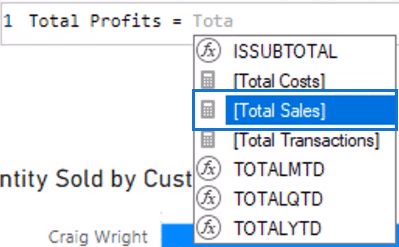
Now I have a new measure which is being created out of my core measures. This is the start of measure branching.
When we put this measure into the table, we can see what the Total Profits are per customer.
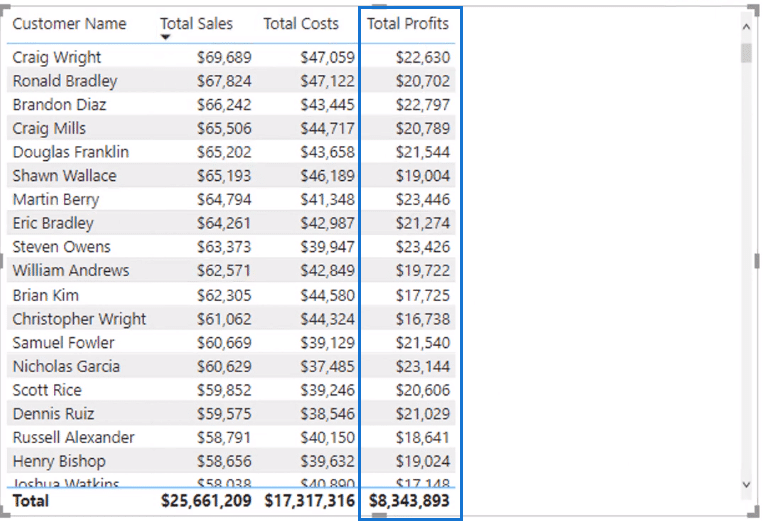
The great thing here is that we don’t need intermediary calculations. The measure branching is going to work behind the scenes.
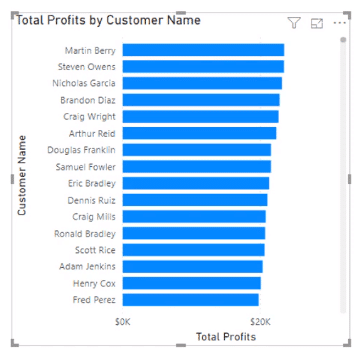
To use this in a visualization, I can input the new measure inside a visualization and filter it any way I like. For example, I’m filtering it by customers, but I could also filter it by county.
This is the visualization of Total Profits by Customer:
This is the visualization of Total Profits per County:
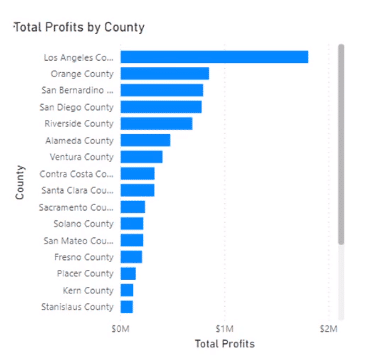
These are all calculated using measures.
Calculating Profit Margin Using Measure Branching
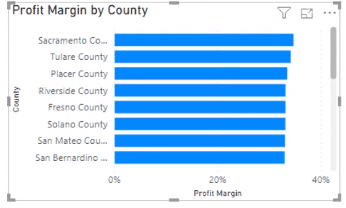
We can make this even more advanced by creating a new measure called Profit Margin. I’m going to use a function called DIVIDE, input Total Profits, and divide it by Total Sales with the alternative result of zero.

This Total Profits measure was created using our core measures and we’re reusing it again to create the Profit Margin calculation.
Now we have Profit Margins and we could turn this into a visualization as well.
*****Related Links*****
Measure Branching: Power BI Development Strategy
Using Power BI Measure Branching To Check If Your Margins Expand As Revenue Grows
Implementing DAX Measure Groups Into Your Reports — A Power BI Modeling Review
Conclusion
This is what measure branching is. It’s reusing measures within measures.
It starts with making one measure then as you go on with more advanced calculations, you use the primary measures to create new measures.
You start off with simple calculations then begin to advance into complex calculations with no effort.
Throughout the process, I have not created any additional data within my tables. I don’t need to create any calculated columns at all. All the calculations you need are within measures.
When you take things to the next level by calculating for your cumulative total, cumulative revenue, cumulative profits, and comparing them between dates, you can reuse these measures over and over again.
All the best,
Sam


